Modern Tools for Spatial Modeling and Animal Movement Analysis
Alaska - The Wildlife Society - Annual Meeting
Anchorage, AK - March 2018

|
Instructors: Elie Gurarie1,2, Eric Palm2
- Department of Biology, University of Maryland
- W.A. Franke College of Forestry and Conservation, University of Montana
1 Goals
The goal of the course is to develop basic skills to process and visualize movement data and environmental variables as a first step to answer questions related to habitat use and animal responses to environmental changes. Recent tools in R make high-level visualizations, including maps, animations, interactive graphics, and incorporation of environmental layers, relatively easy to create and manipulate. Movebank provides a standardized web-supported database for managing, sharing and annotating movement data with environmental covariates, a vital step in encouraging and supporting conservation decisions.
2 What to bring
Bring a laptop!
We will be using R - interfaced through Rstudio. Some experience using R is extremely helpful - though not ABSOLUTELY mandatory.
It would be helpful to install the following suite of packages ahead of time, to increase the chances that the code will work.
- Movement data:
move,adehabitatLT,adehabitatHR - Spatial processing:
sp,rgdal,rgeos,sf,raster - Mapping and plotting:
ggplot2,maptools,ggmaps,mapdata - Tidyverse:
dplyr,plyr,magrittr,lubridate
NOTE: To install packages directly from the R console use the following command:
install.packages("packagename")Or, if you want to try to install a bunch at once:
pcks <- c("pck1","pck2","pck3")
sapply(pcks, install.packages)
3 Structure
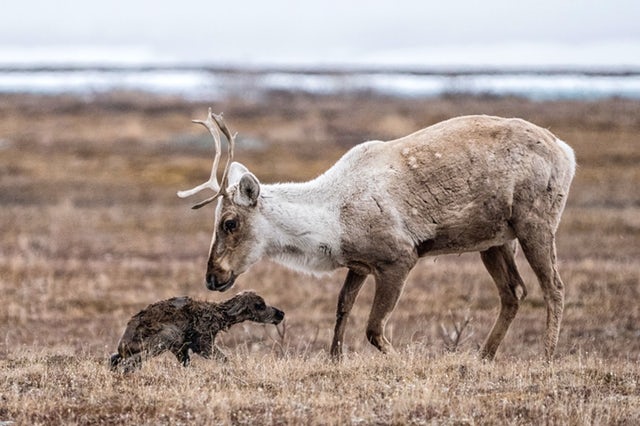
The course will mix short “lectures” on theory and tools with practical labs using R. The entire course revolves around a single dataset on a few caribou movement tracks from the Fortymile herd.
We will cover tools to prepare, manage and share your data and examples of data visualizations that will help you to explore your data and guide your follow-up analysis.
The topics in order are listed below and linked across the top of all pages. (The R script links provide distilled R-code scripts that work on the data that was made available to workshop particpants):
- Using Movebank - (R script)
- Processing Movement Data - (R script)
- Visualizing Movement Data - (R script)
- Loading and working with Spatial Data - (R script)
- Exploratory analysis of movement data - (R script)
- Resource and step selection - (R script)
Enjoy!


