Trait Analysis
Goal
Analyze the relative abundance of a bunch of traits
pcks <- c("magrittr", "plyr", "ggplot2")
a <- sapply(pcks, require, character = TRUE)
There is a data frame that looks like this:
load("../data/trait.dataframe.rda")
str(trait.dataframe)
## 'data.frame': 40258 obs. of 6 variables:
## $ Person : int 1 1 1 1 1 1 1 1 1 1 ...
## $ Transect: Factor w/ 3 levels "ax","ay","fx": 1 1 1 1 1 1 1 1 1 1 ...
## $ Location: int 1 2 3 4 5 6 7 8 9 10 ...
## $ Trait : Factor w/ 29 levels "Carbon_Source_General",..: 1 1 1 1 1 1 1 1 1 1 ...
## $ Variable: chr "heterotrophic" "heterotrophic" "heterotrophic" "heterotrophic" ...
## $ Value : num 0.195 0.805 0.743 0.902 0.316 ...I am not sure what its provenance is. I assume the number under Value represents the total relative abundance of that particular trait at a location, but honestly I have no idea - I’ve looked through all of my code and nowhere found code that I’ve written to create it, though it looks like something I would have created.
Trait abundance plots
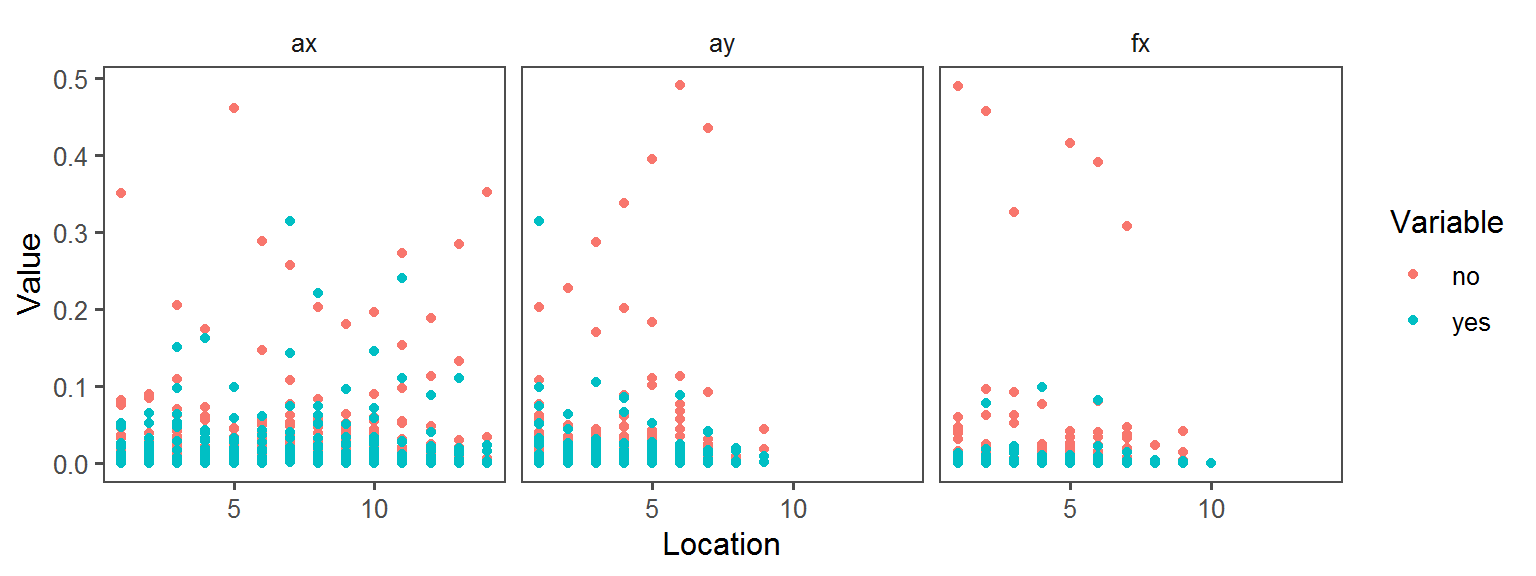
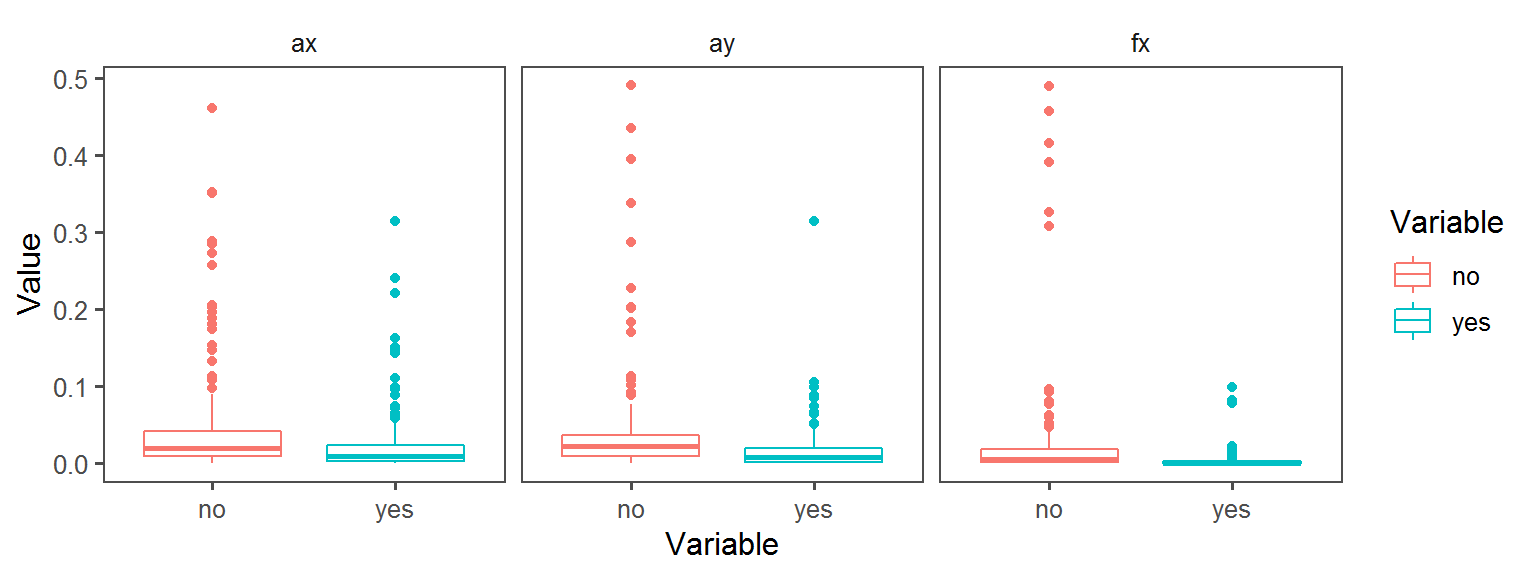
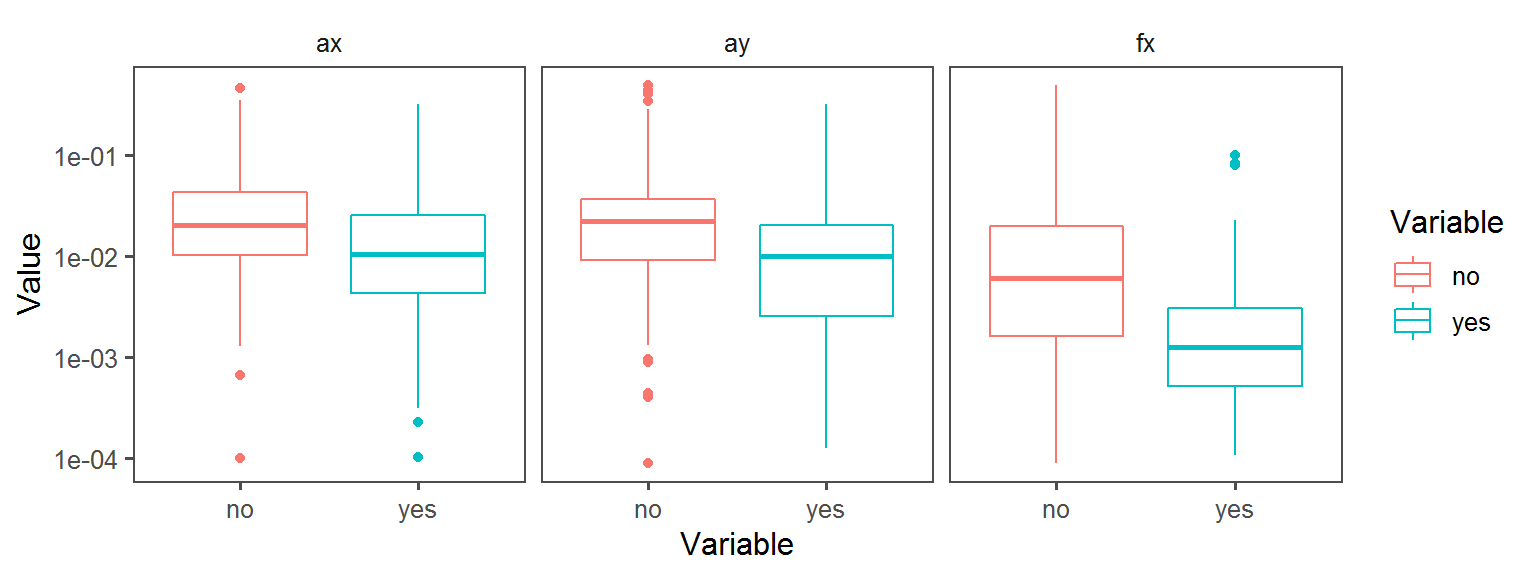
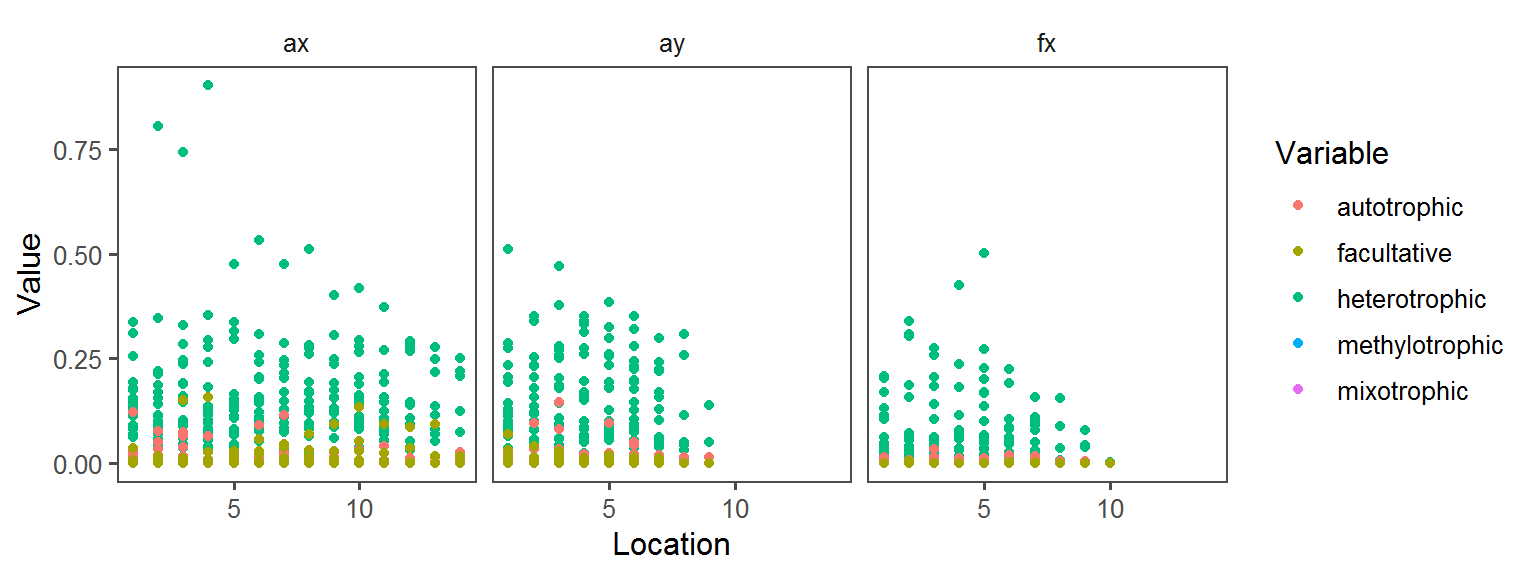
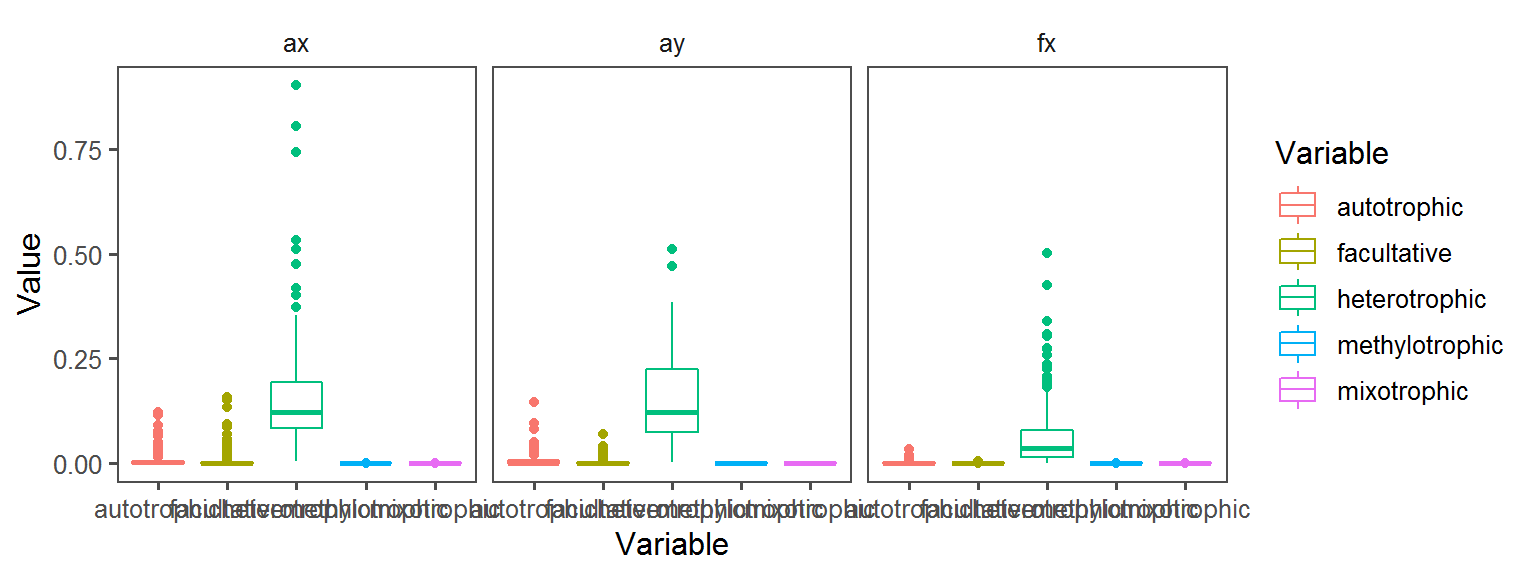
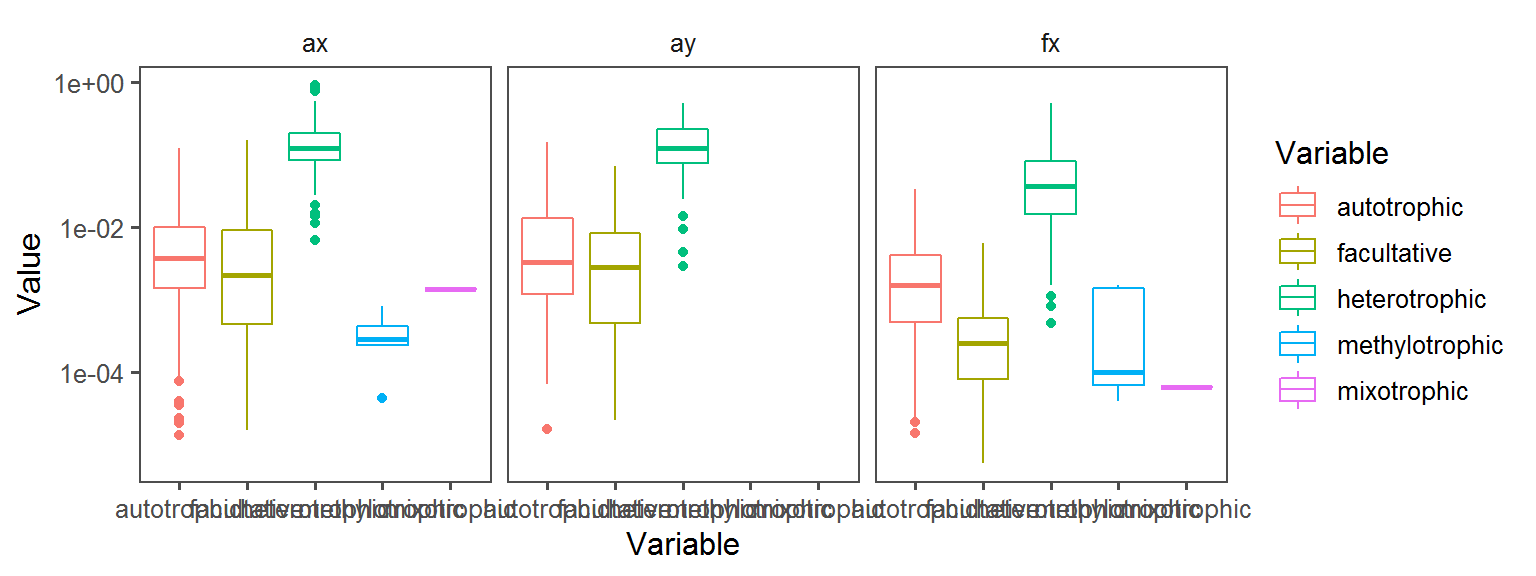
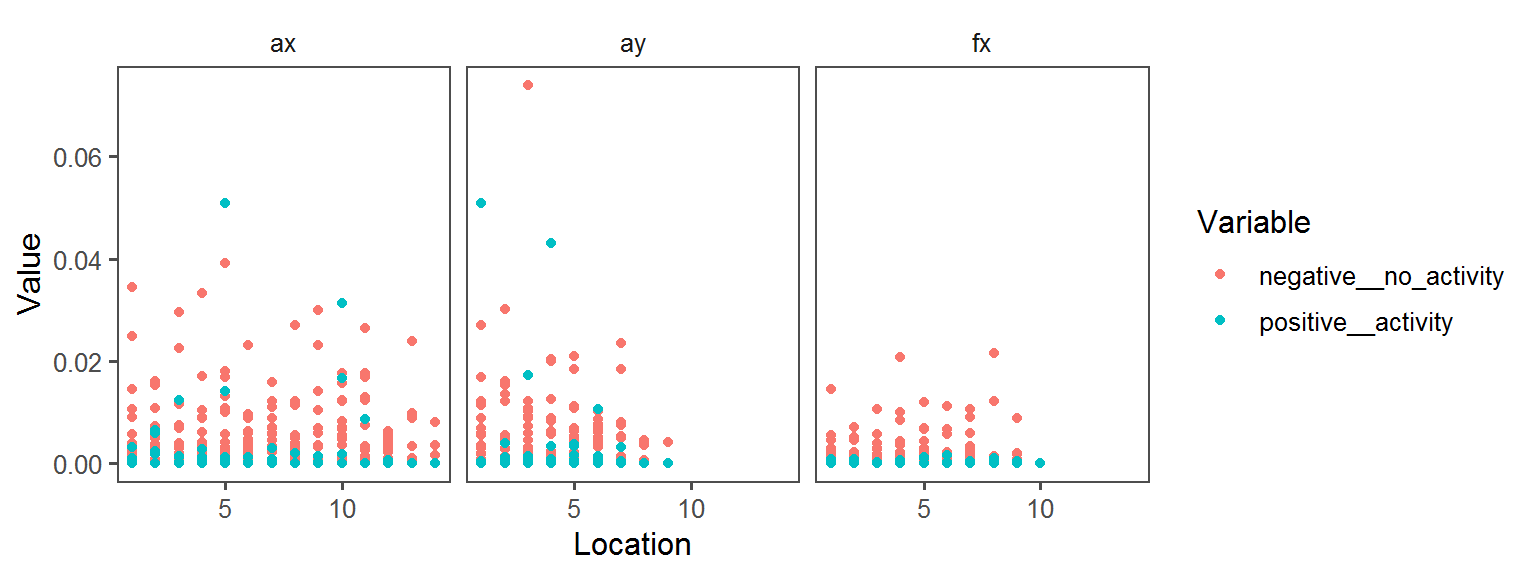
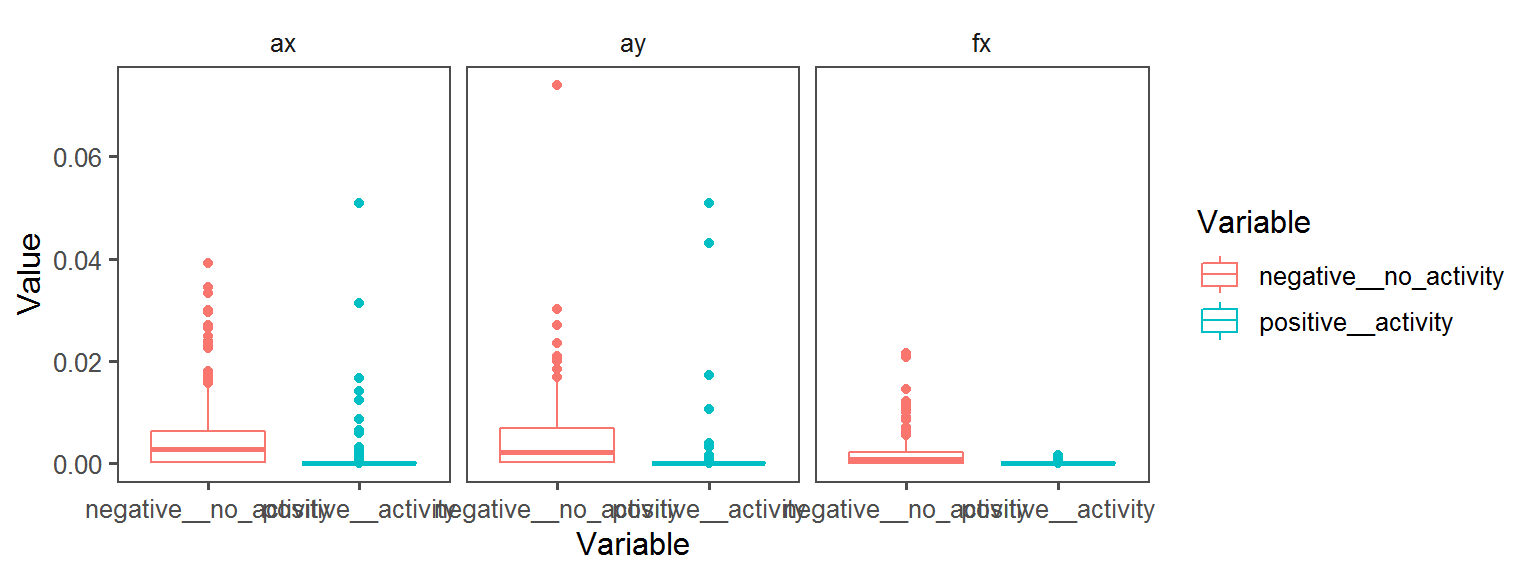
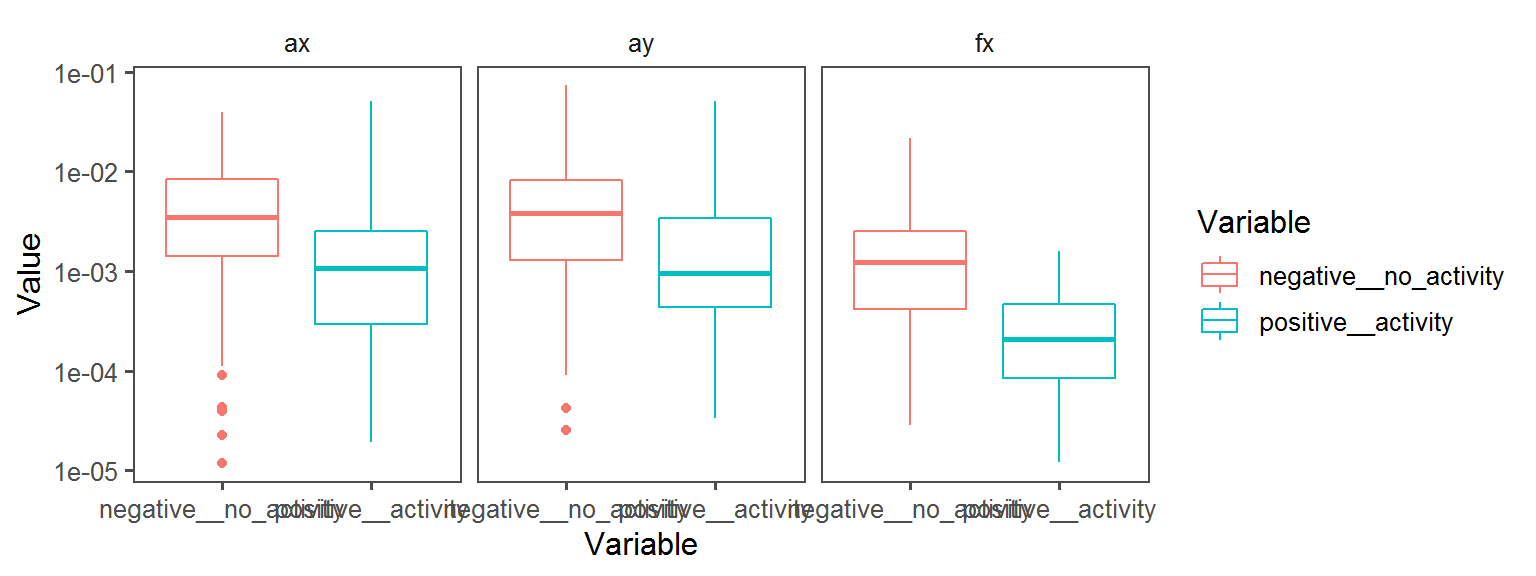
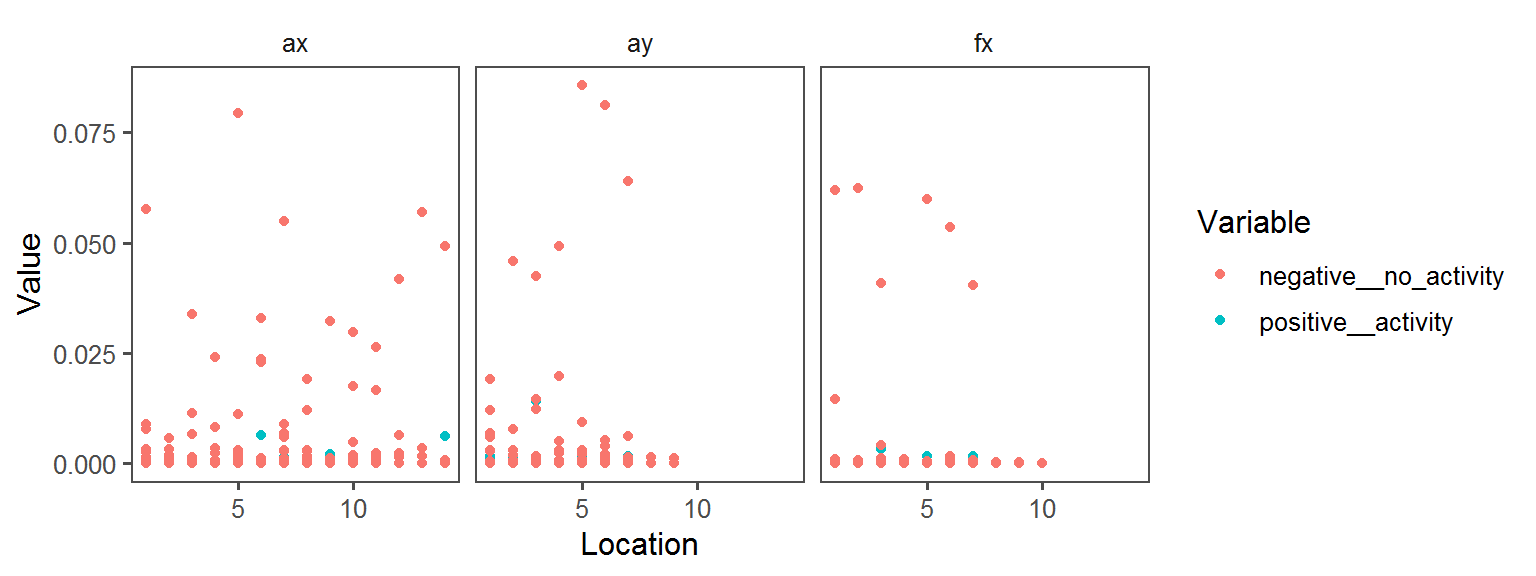
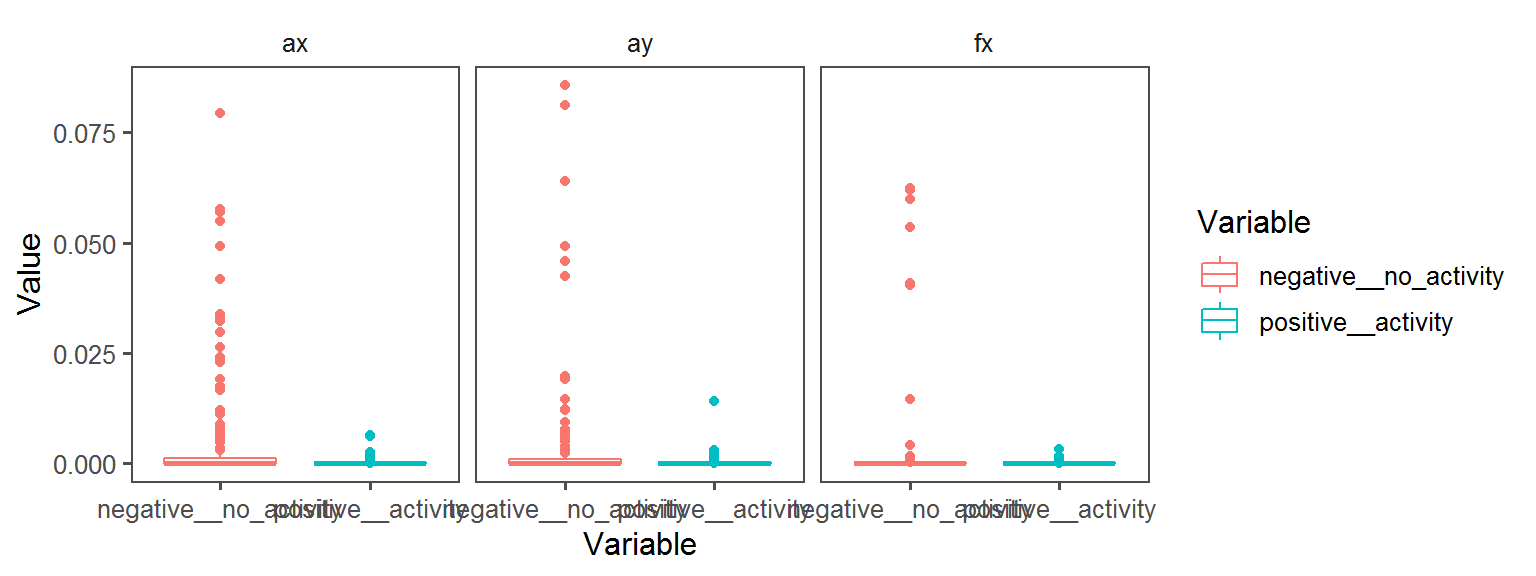
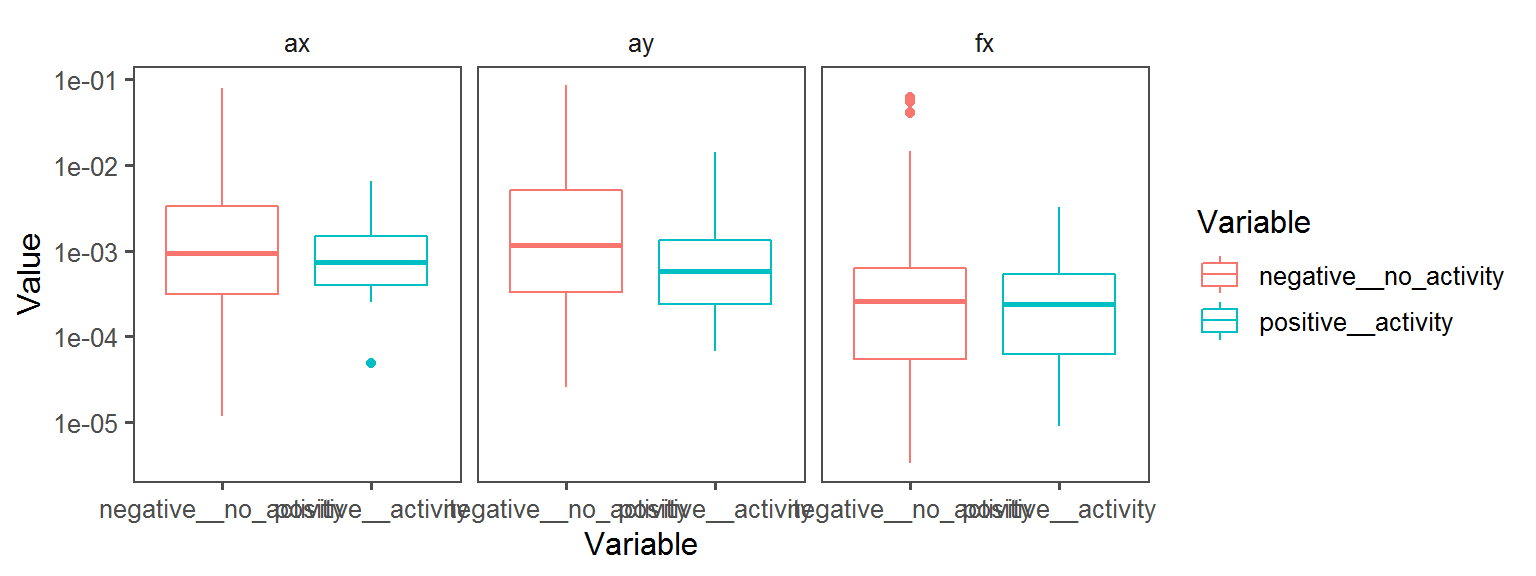
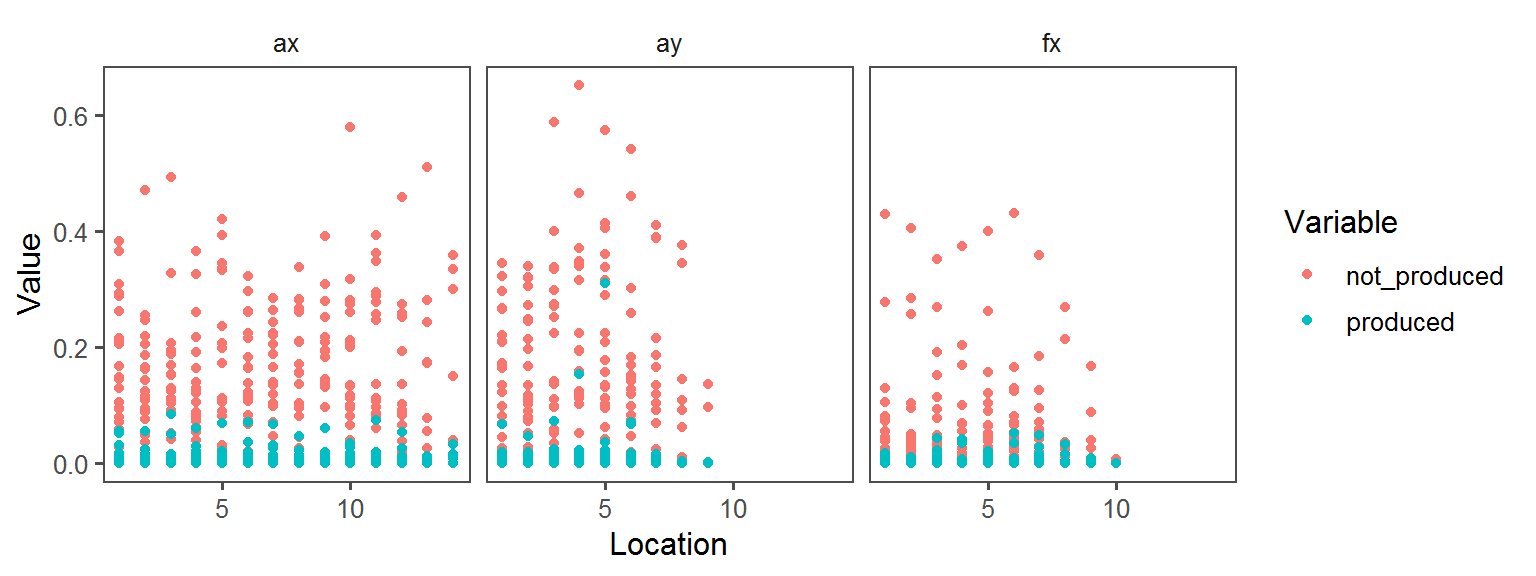
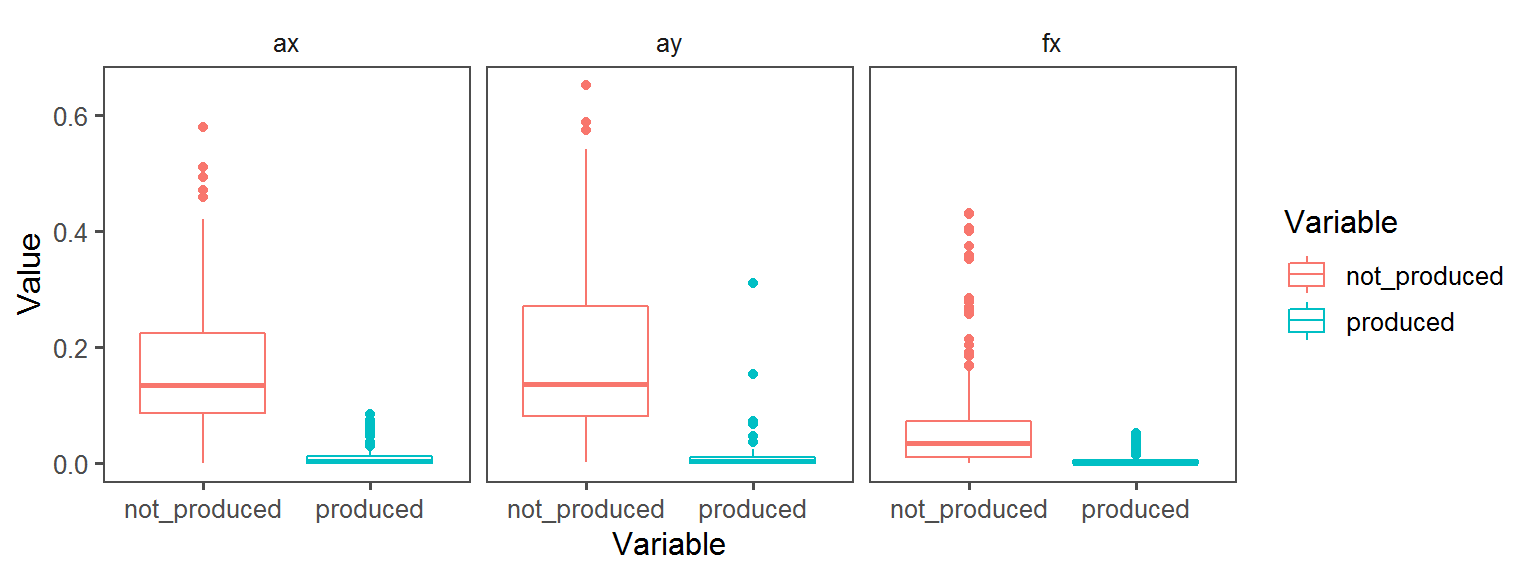
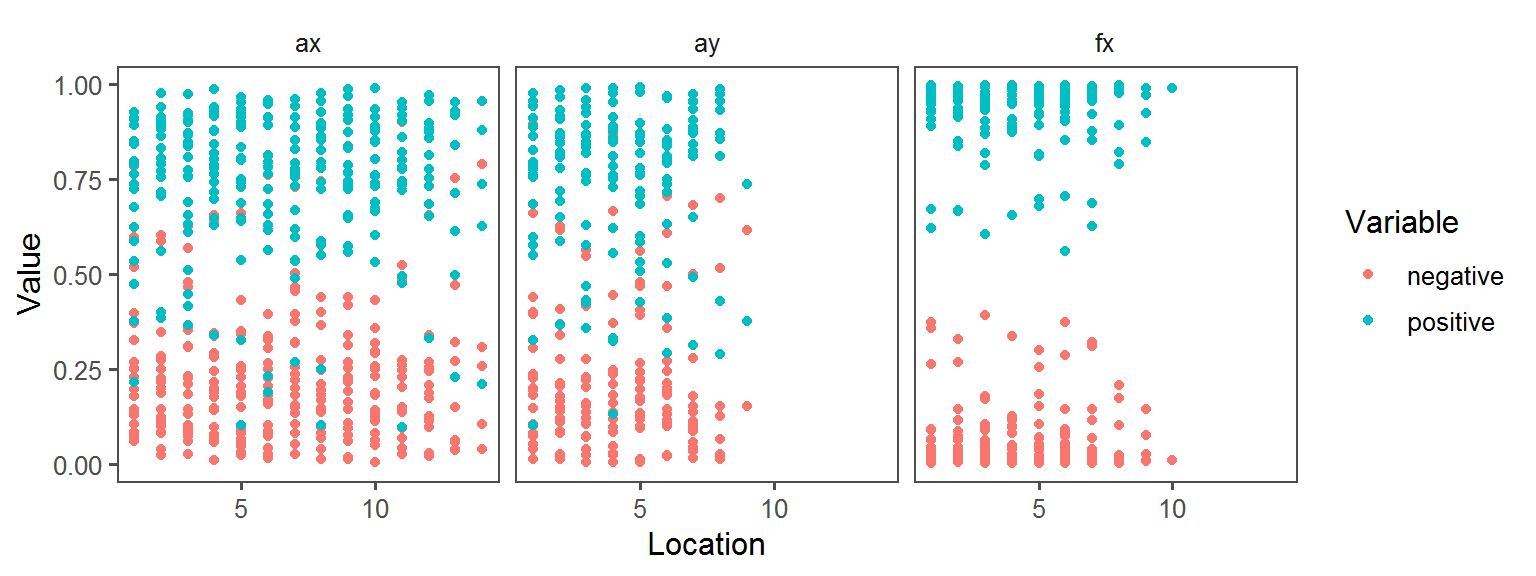
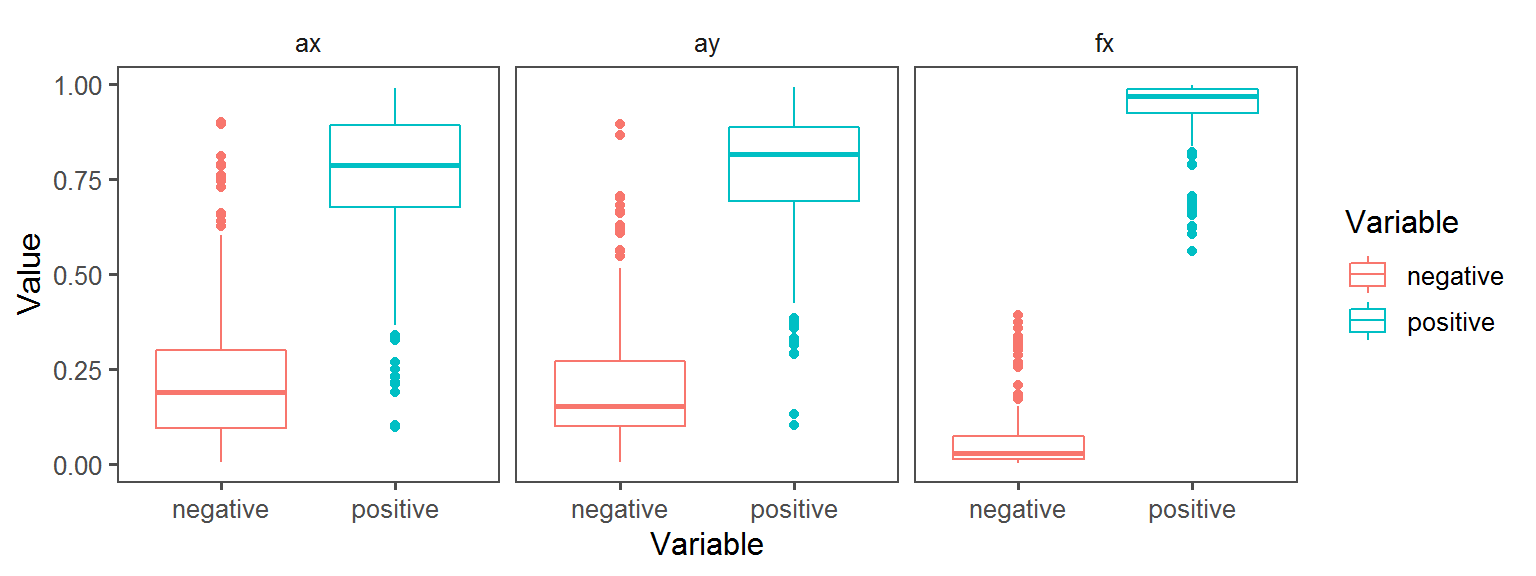
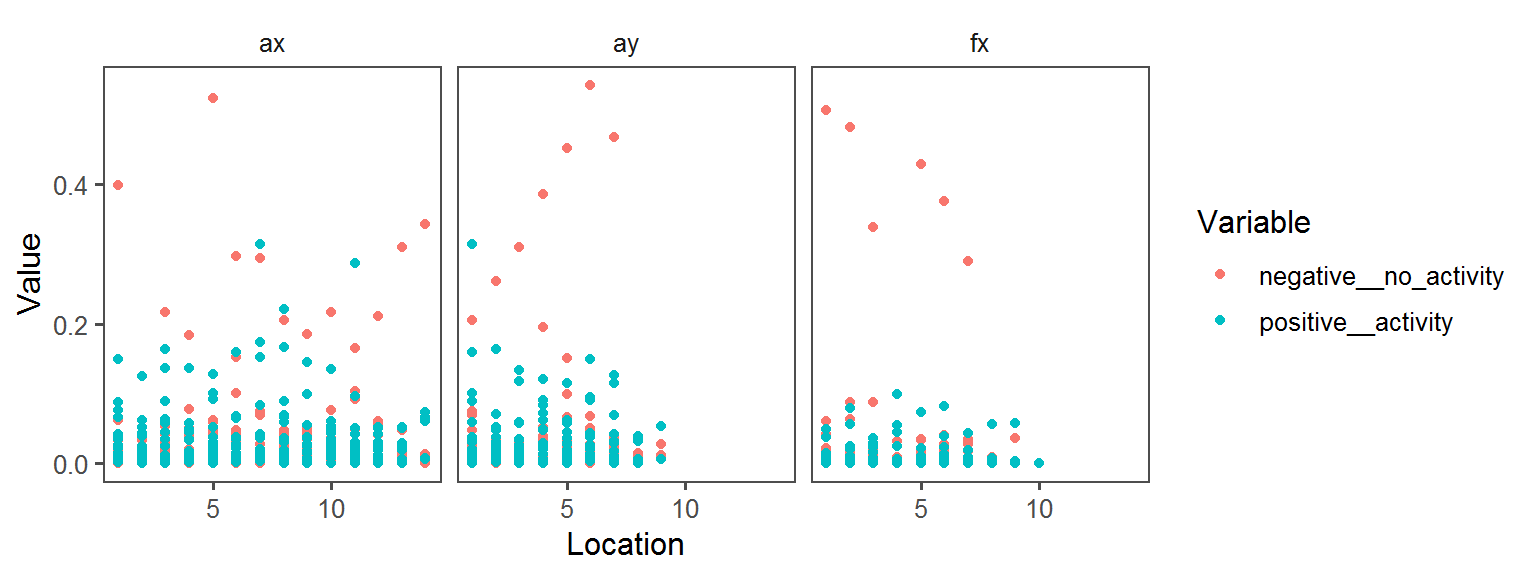
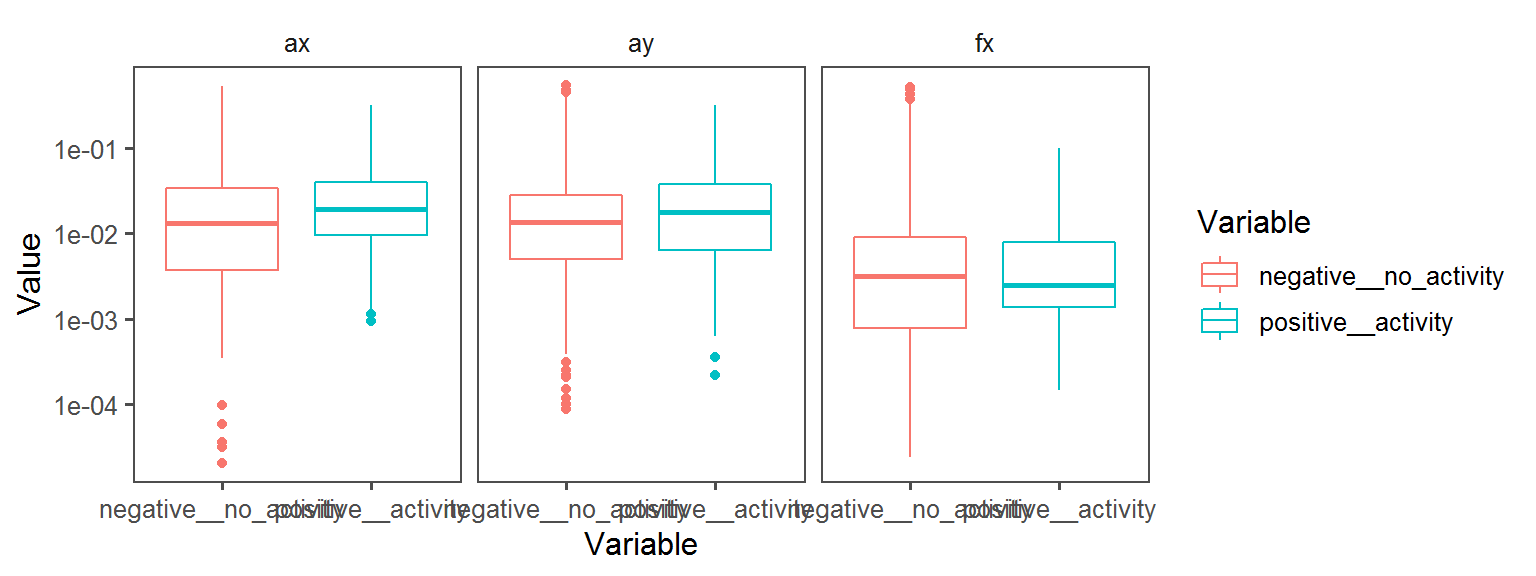
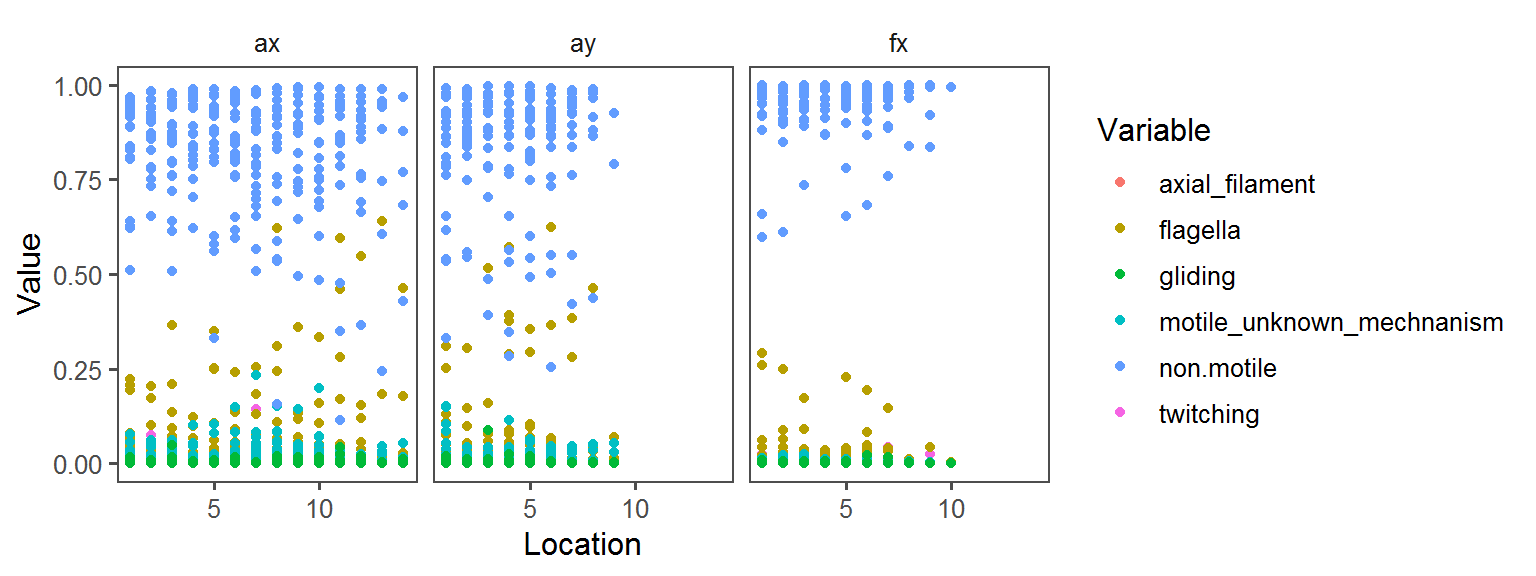
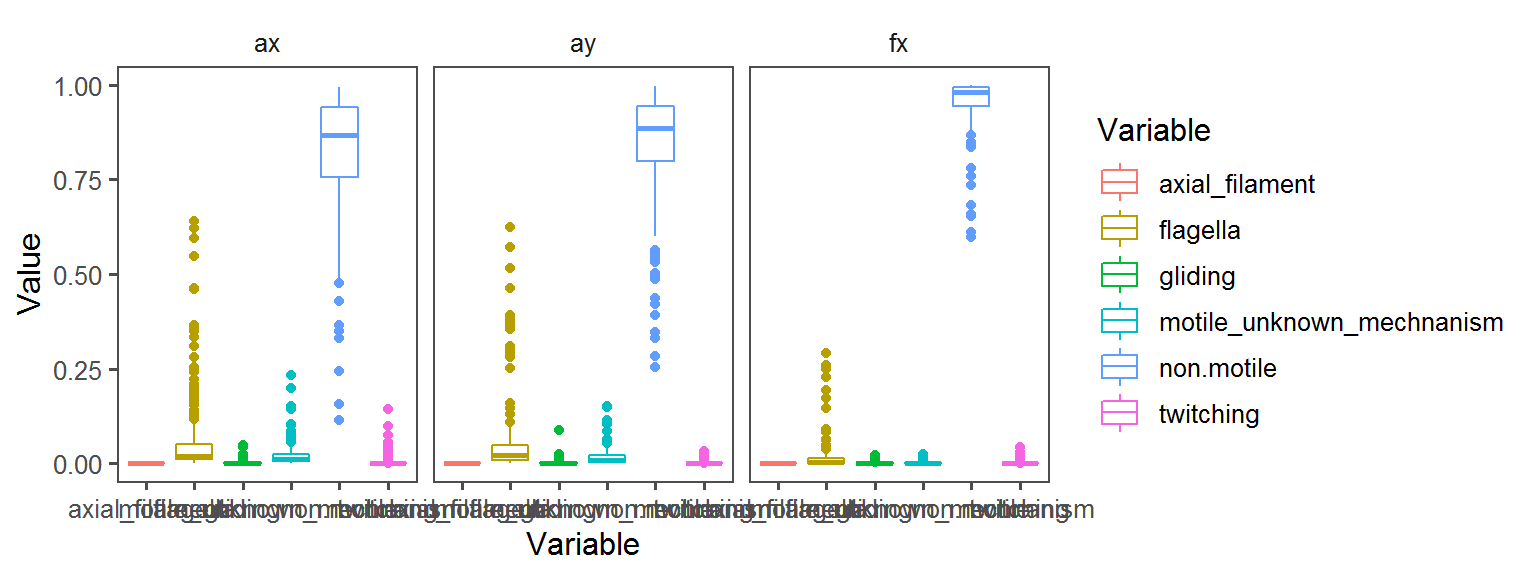
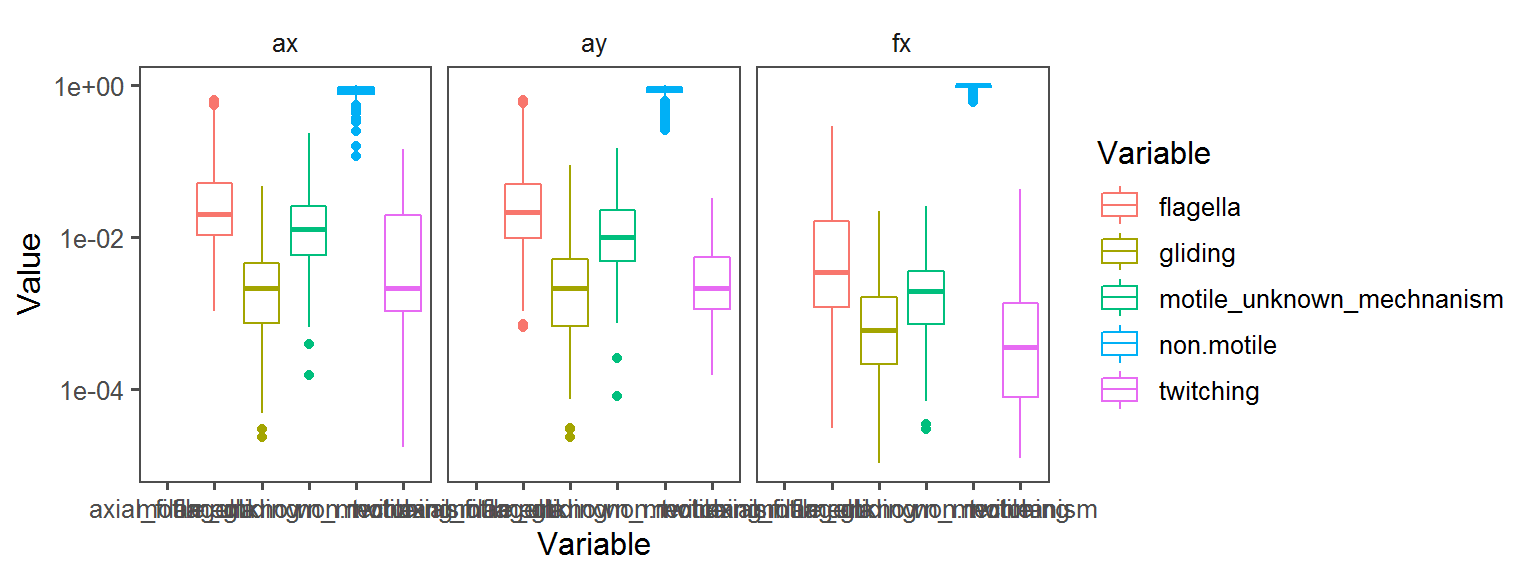
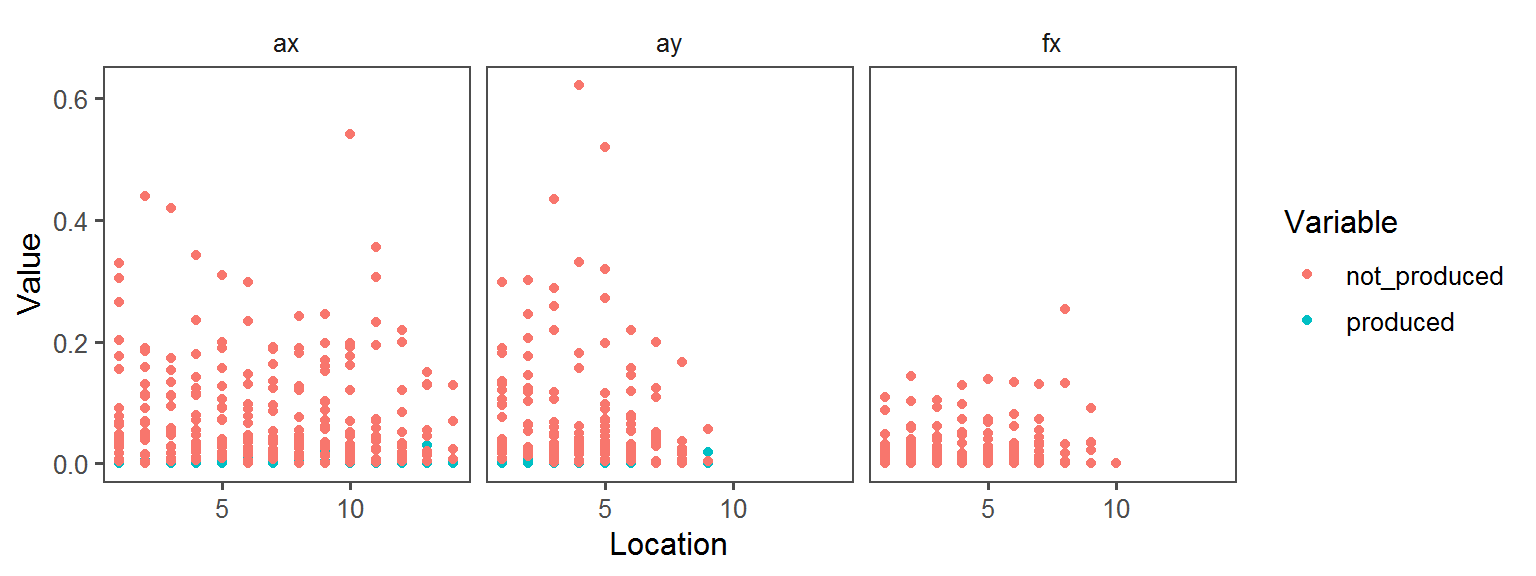
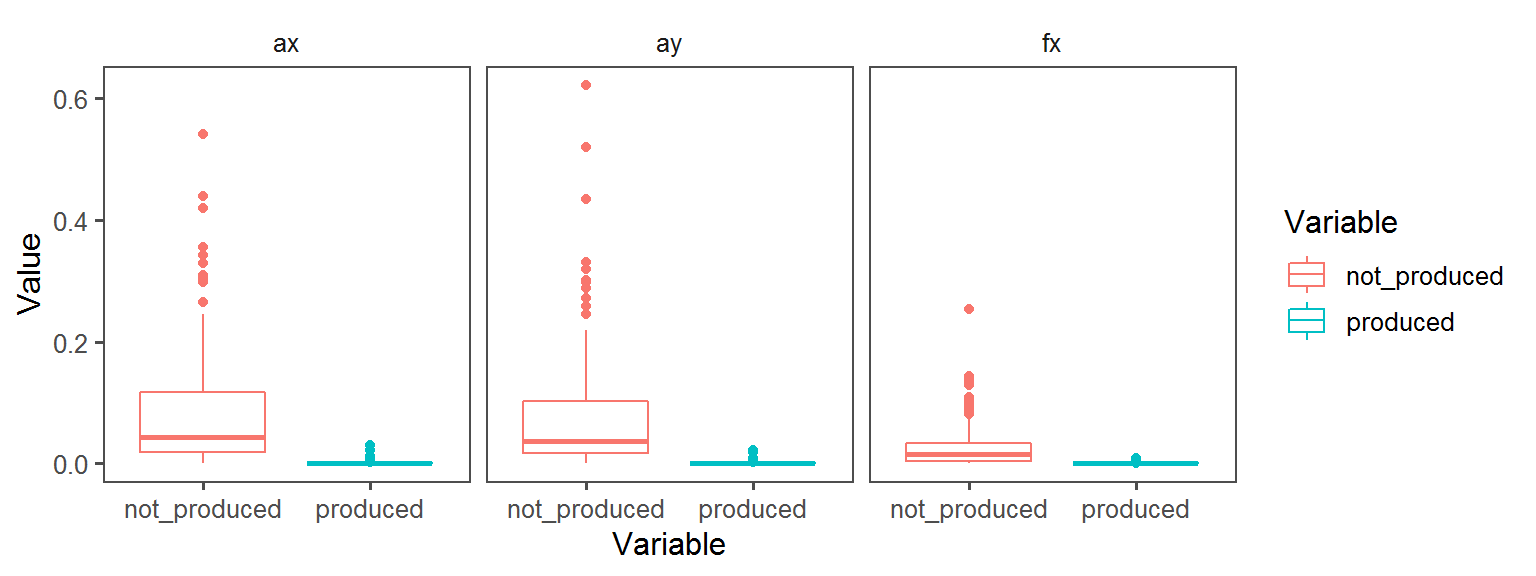
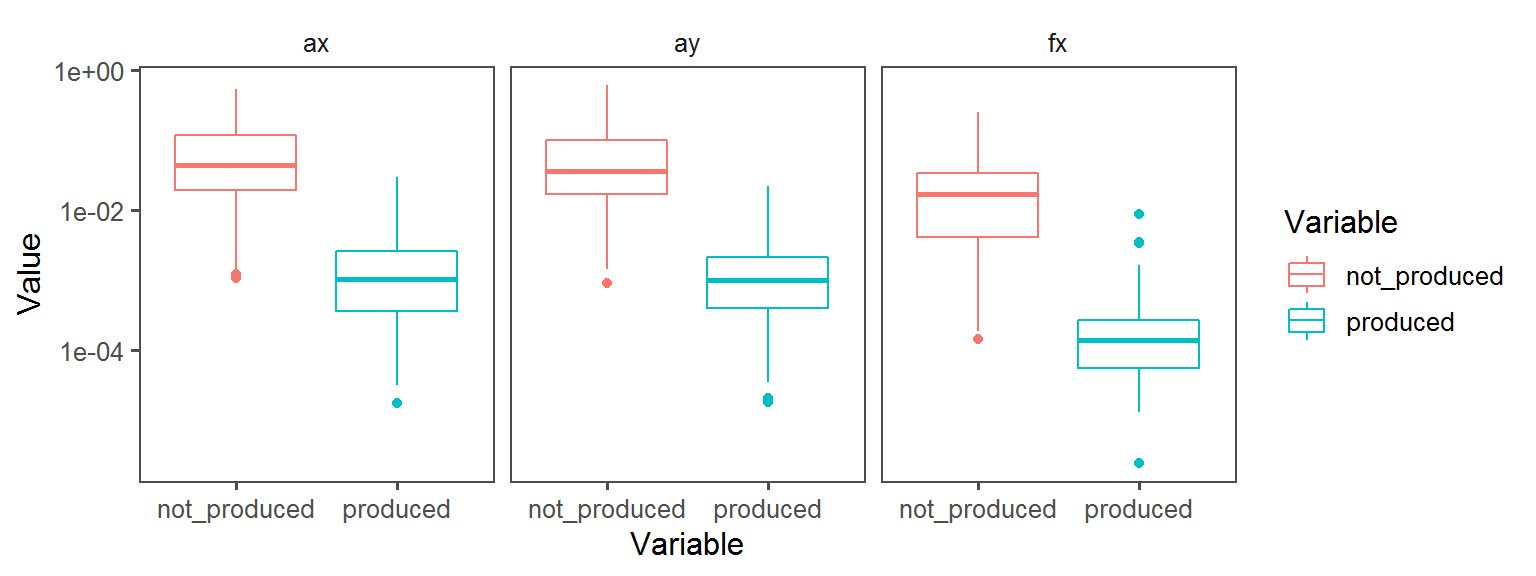
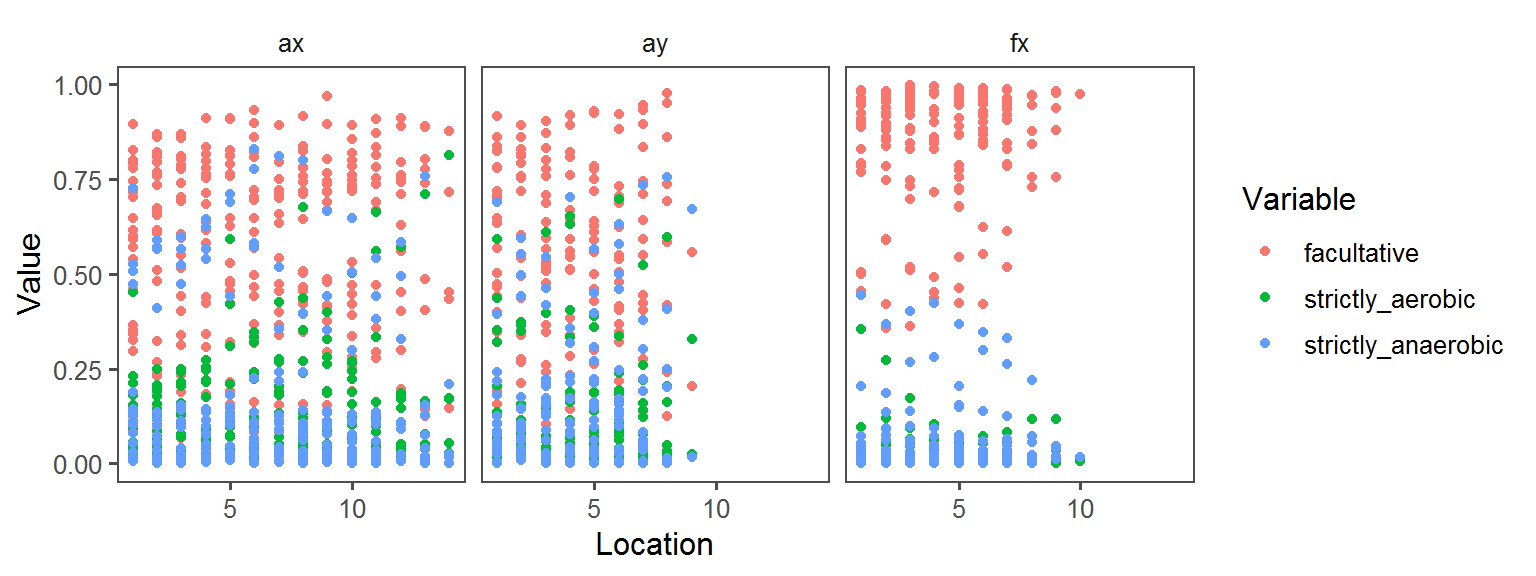
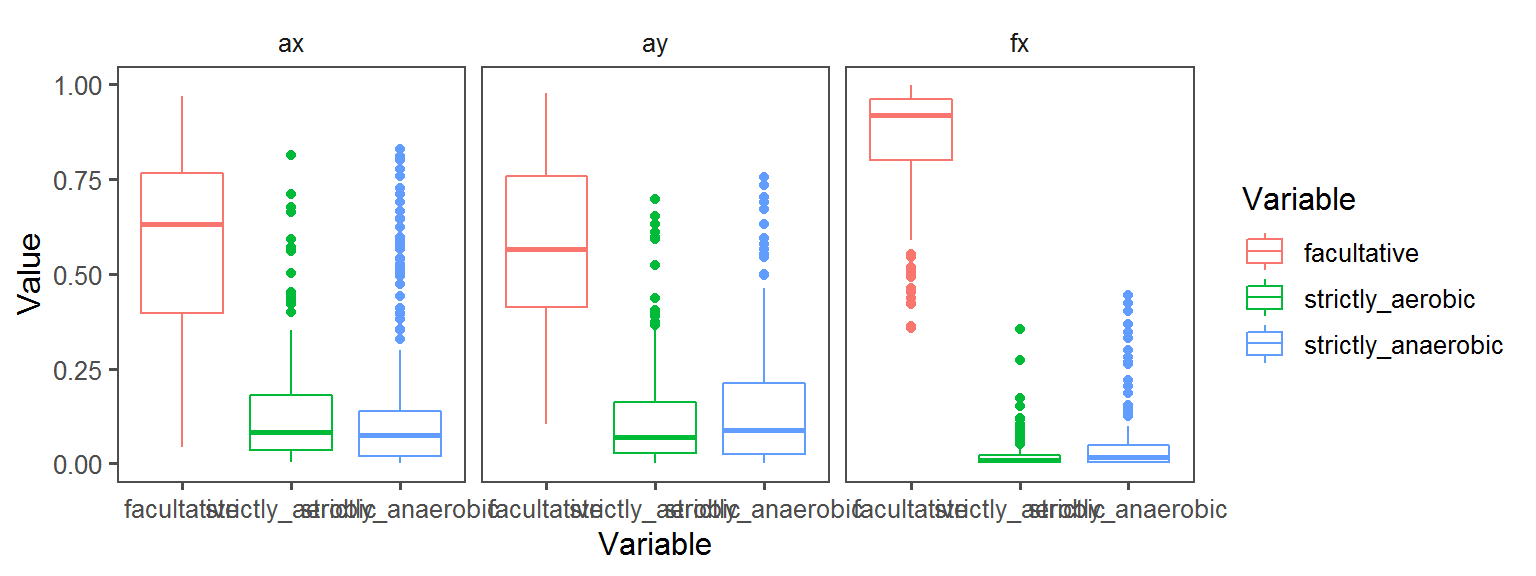
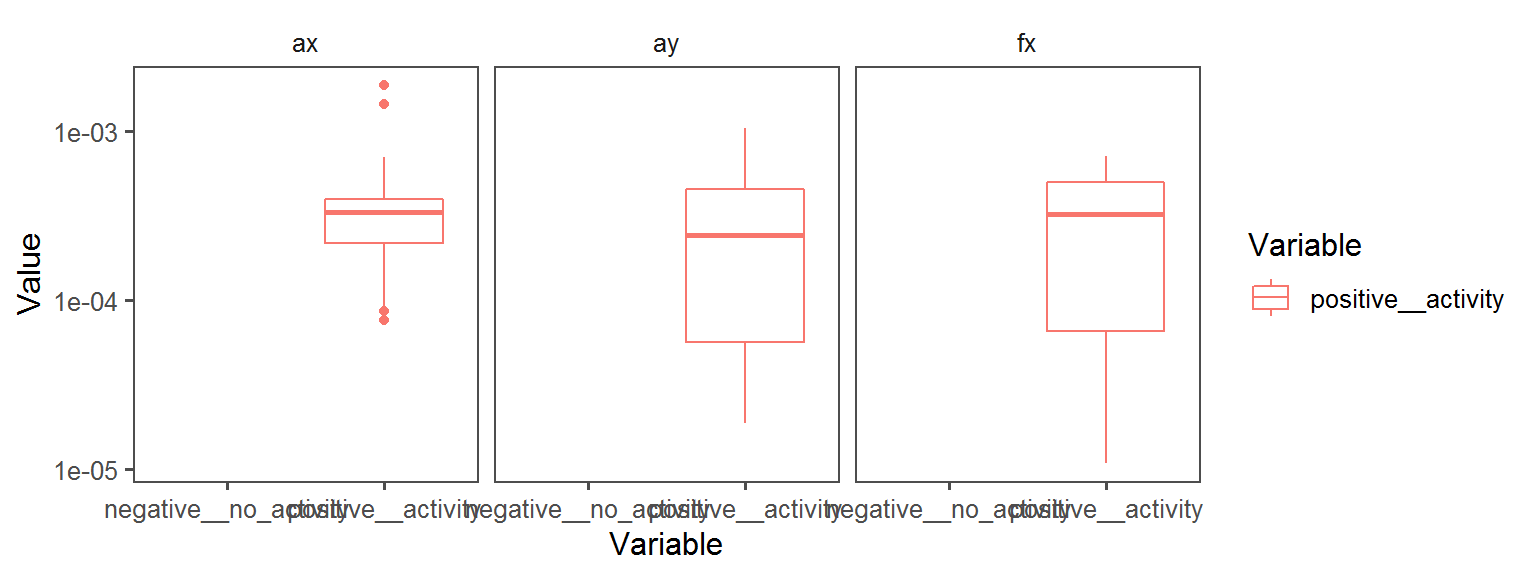
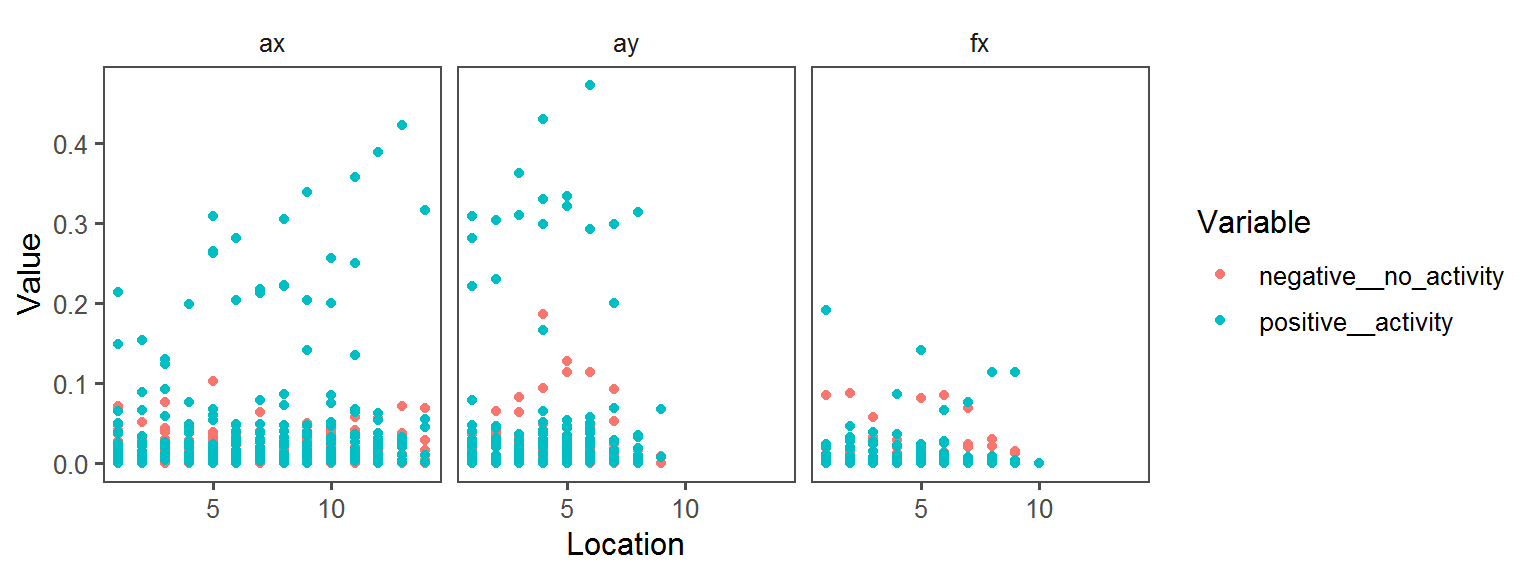
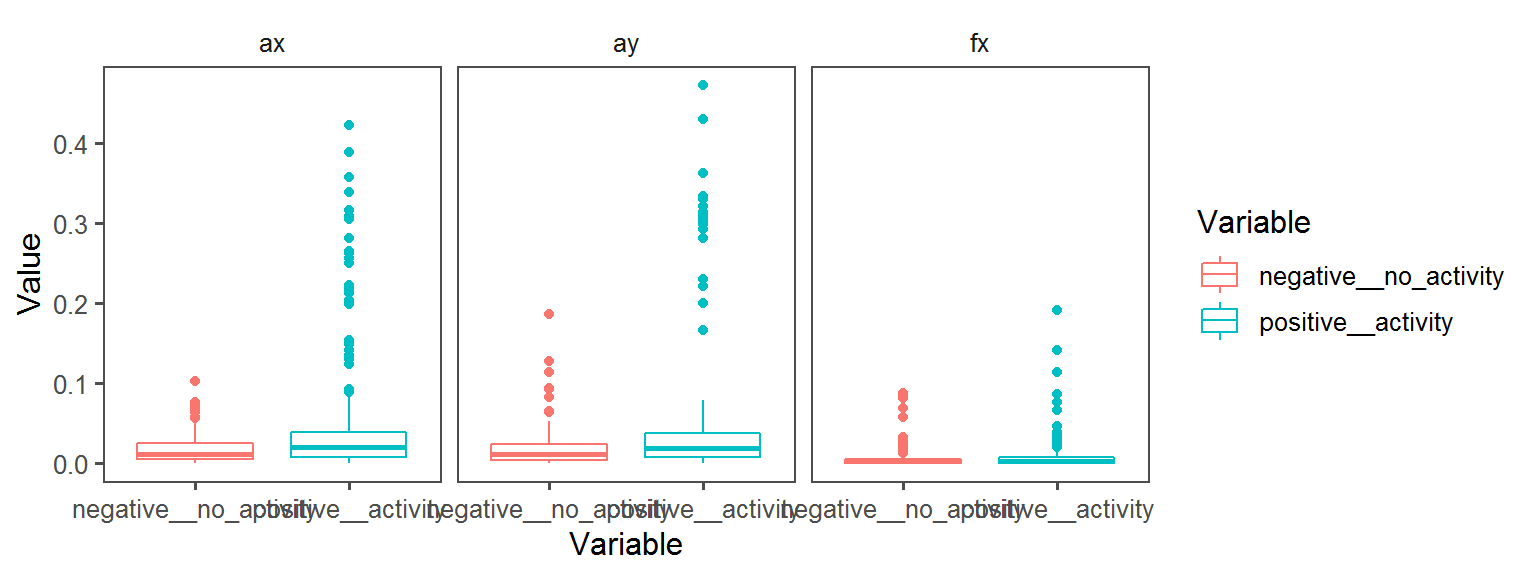
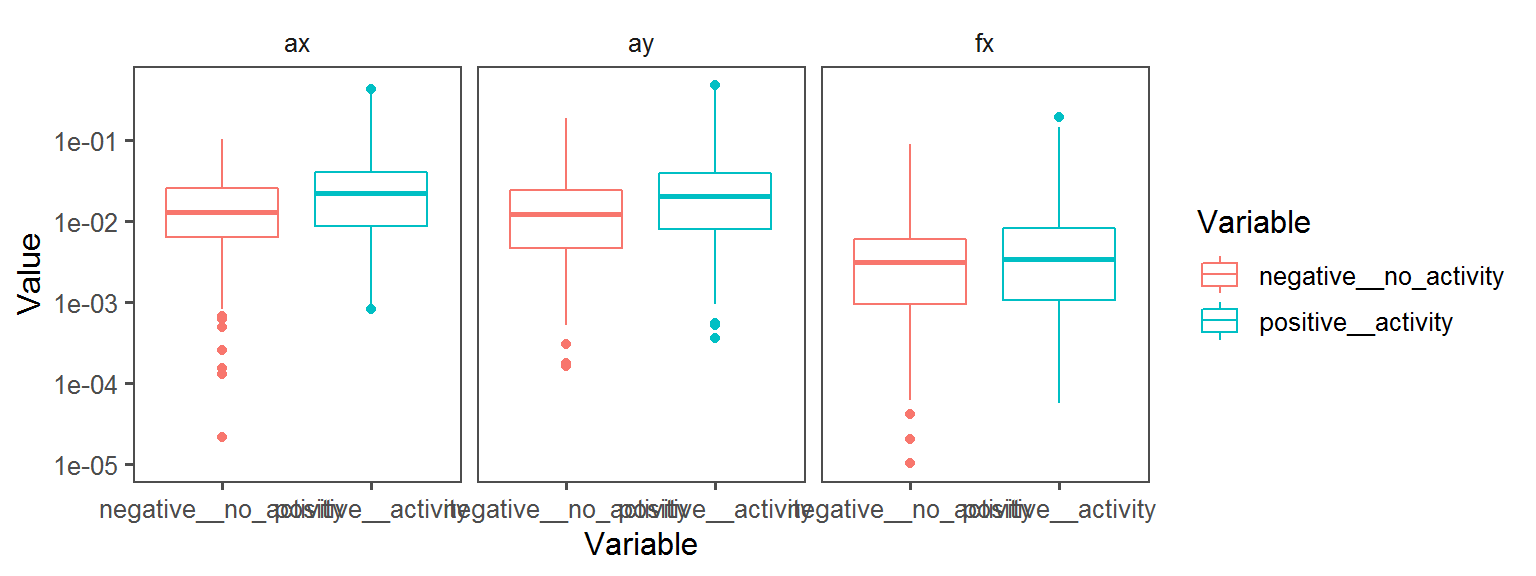
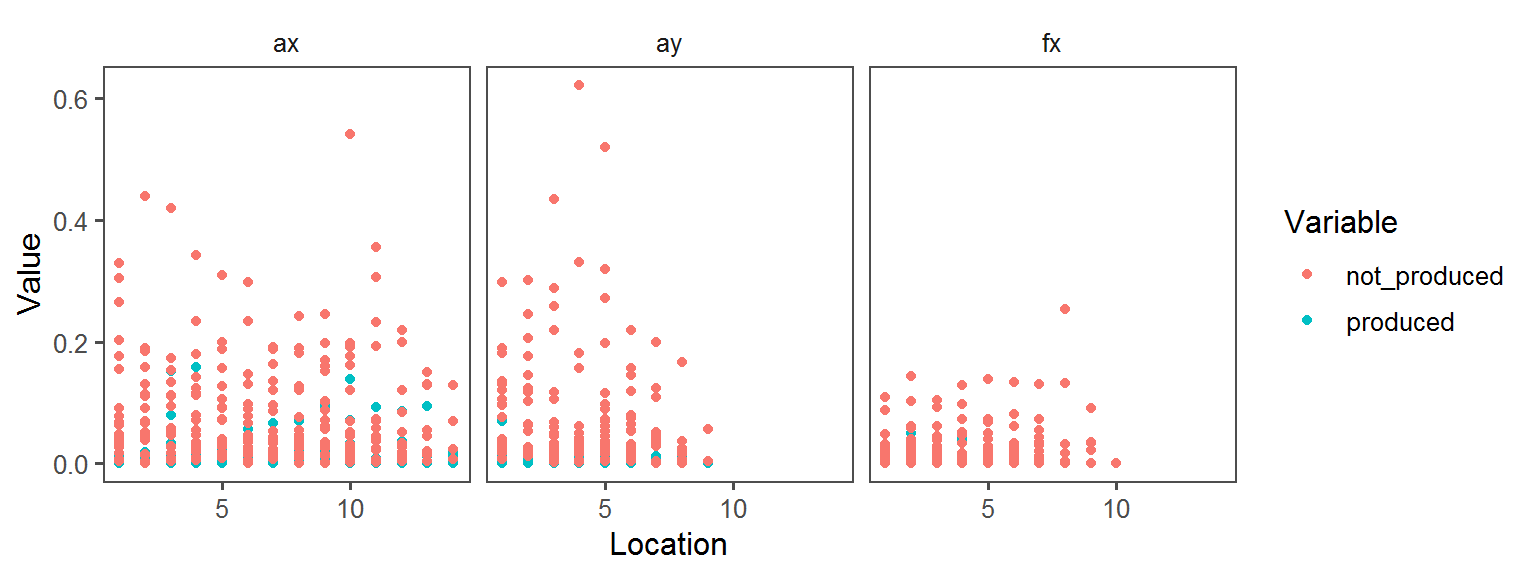
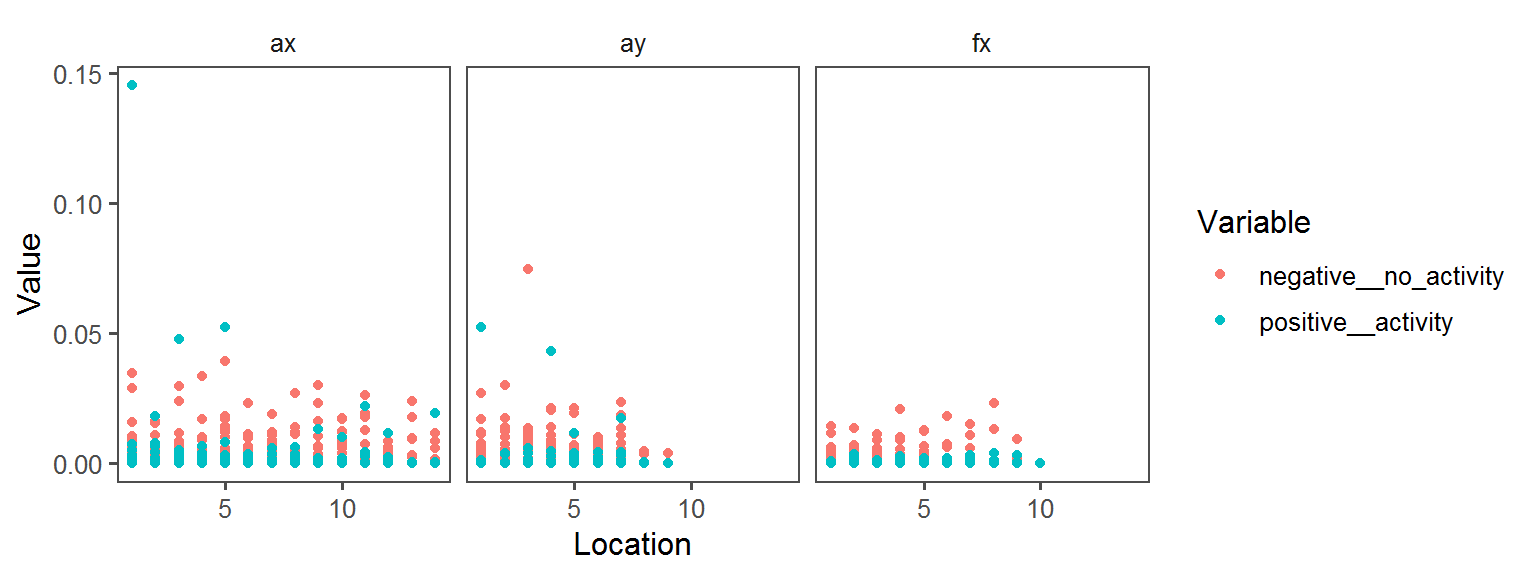
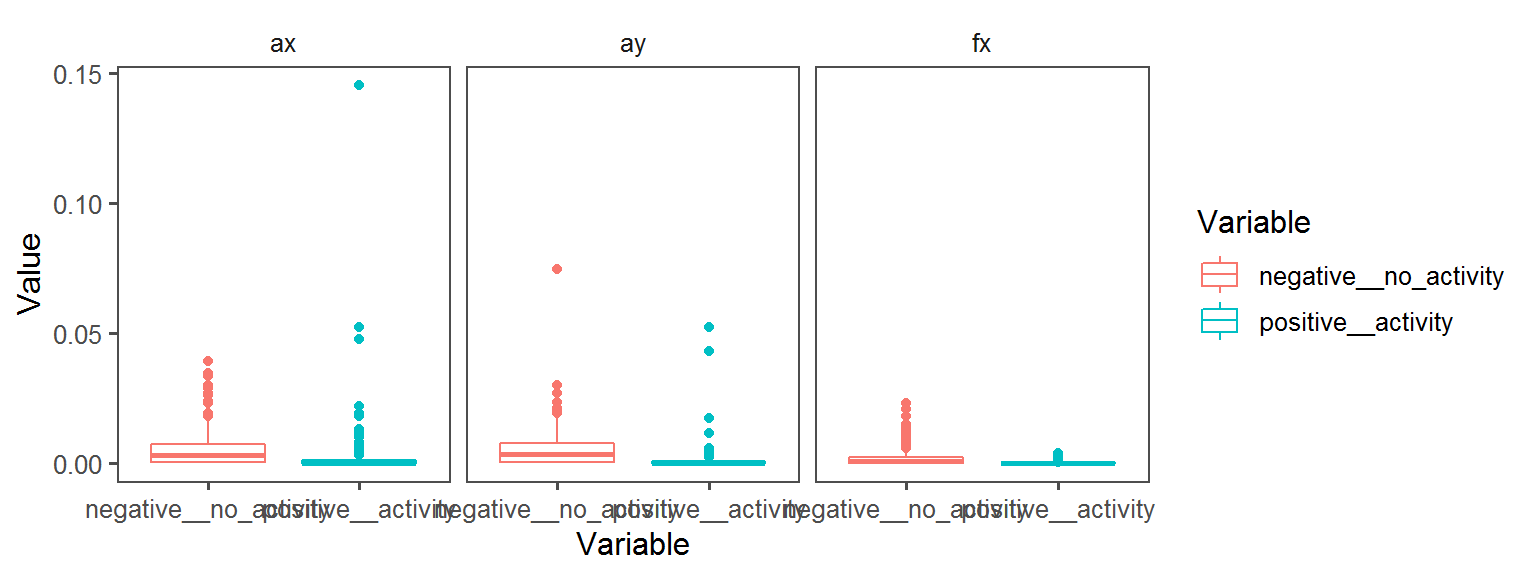
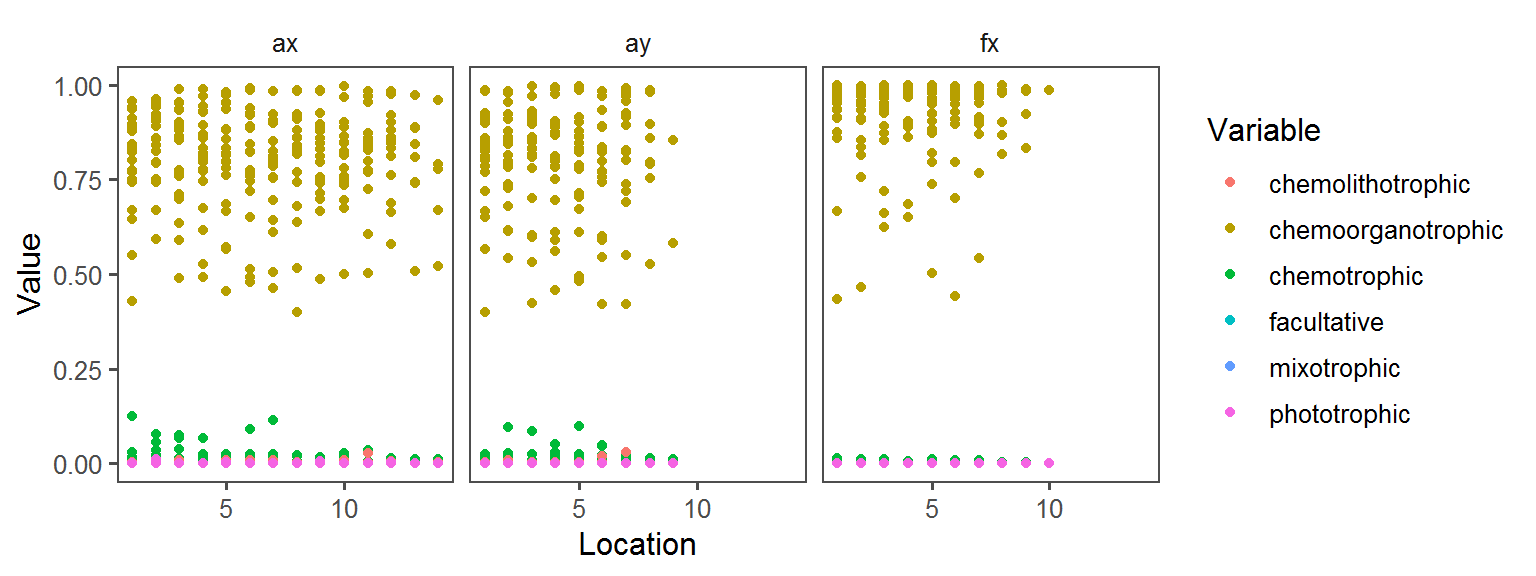
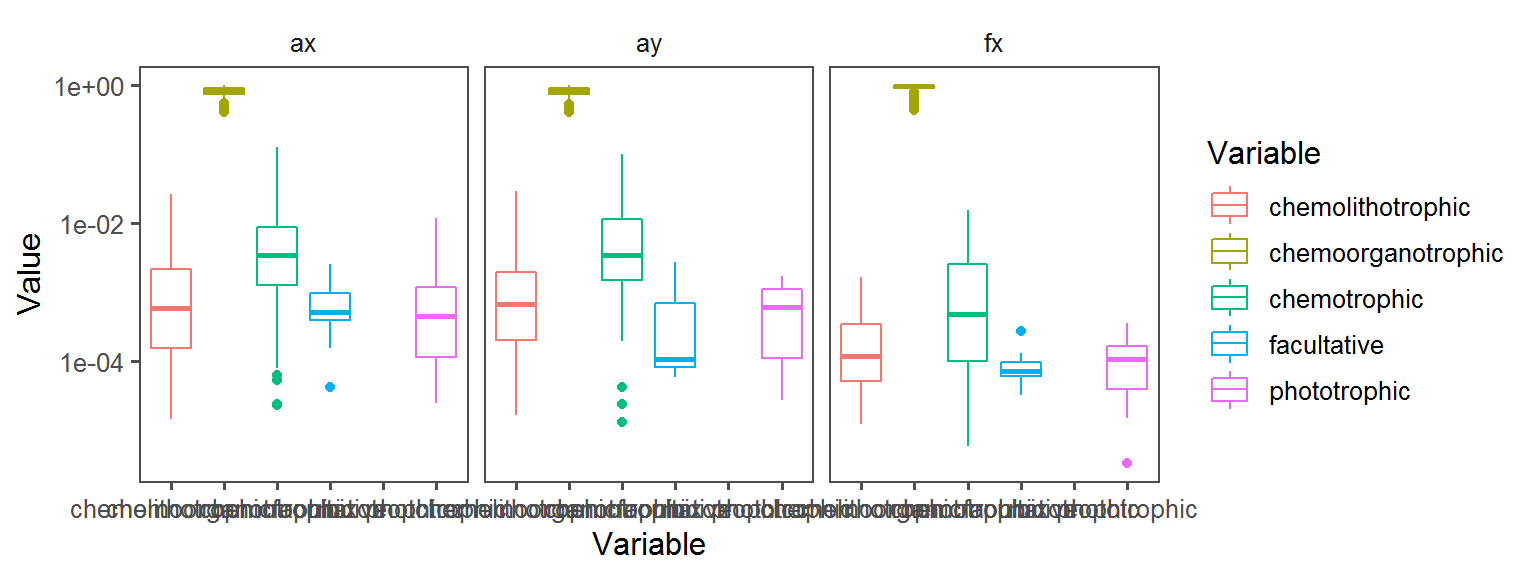
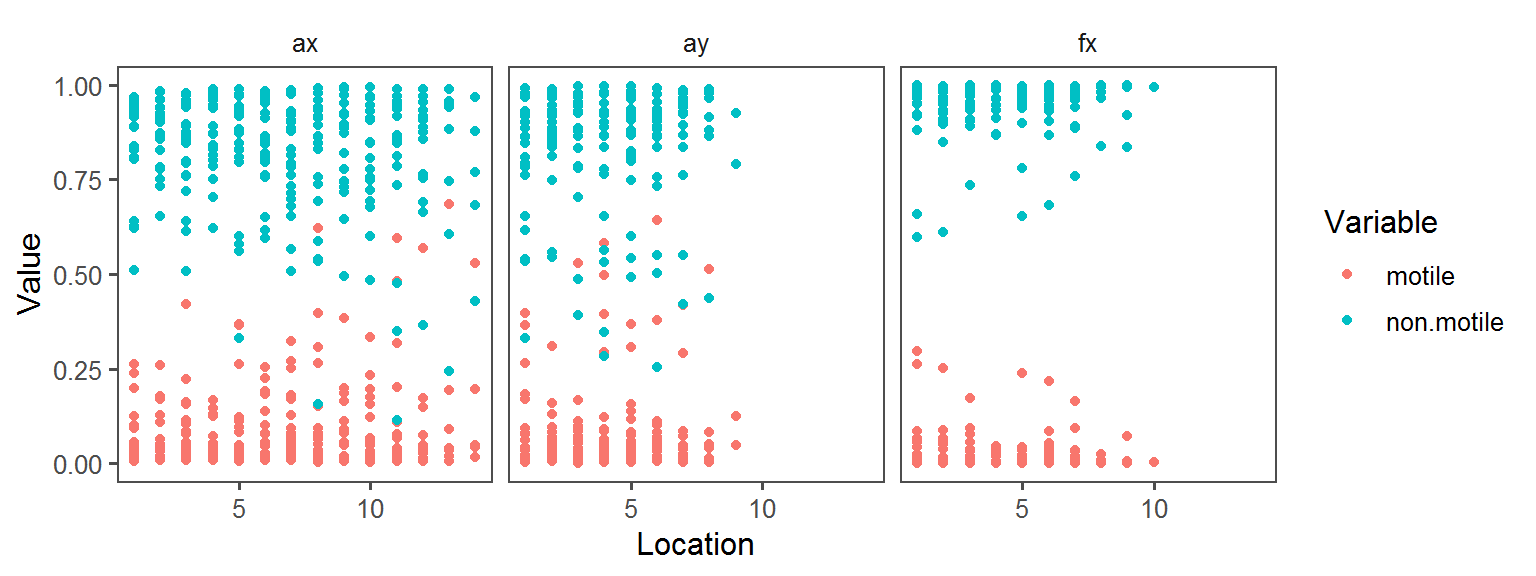
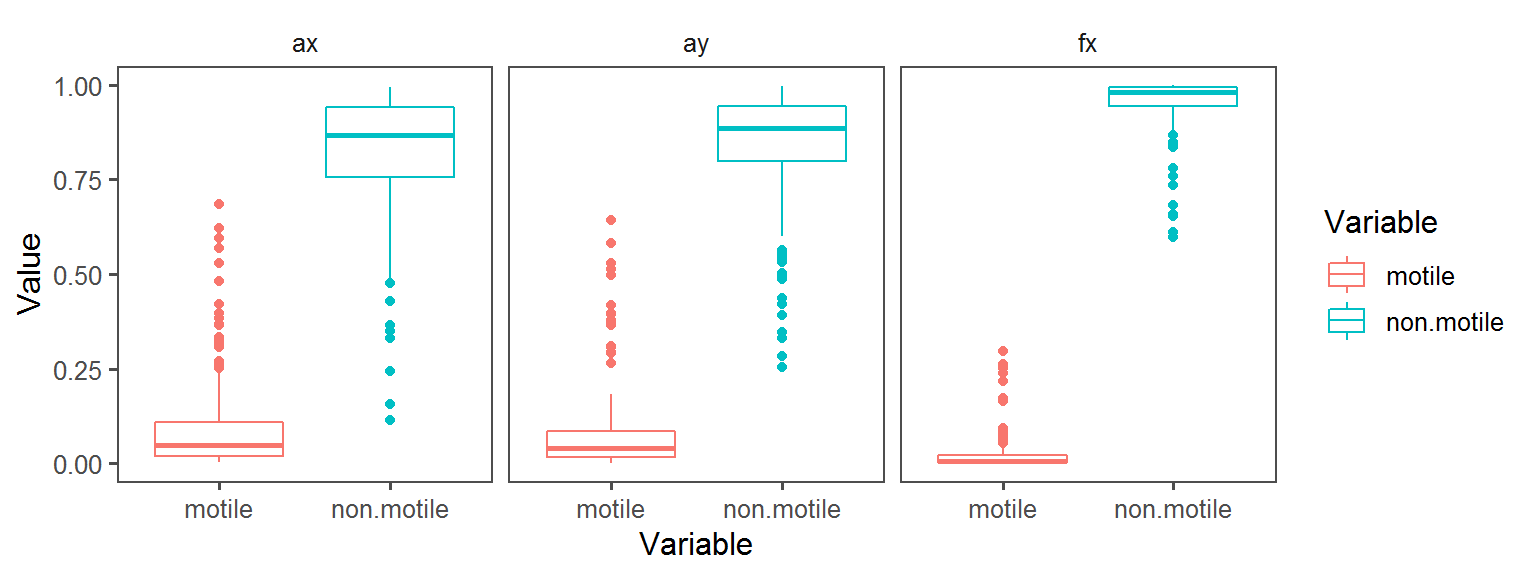
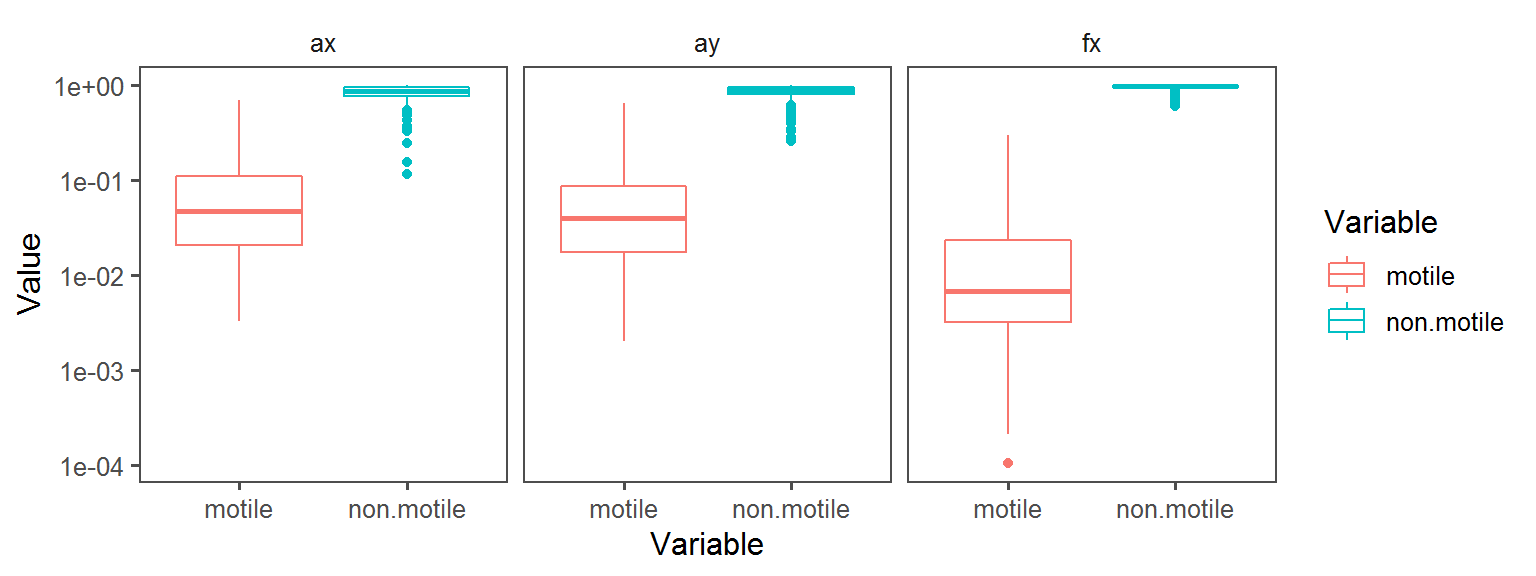
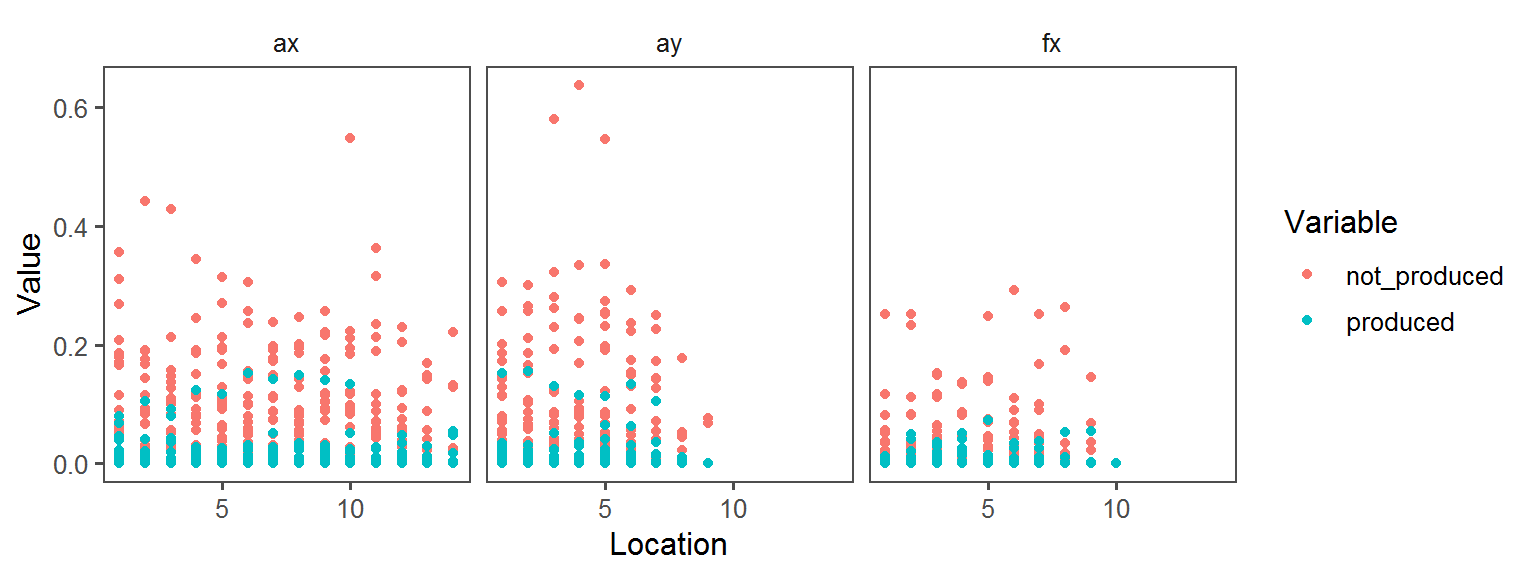
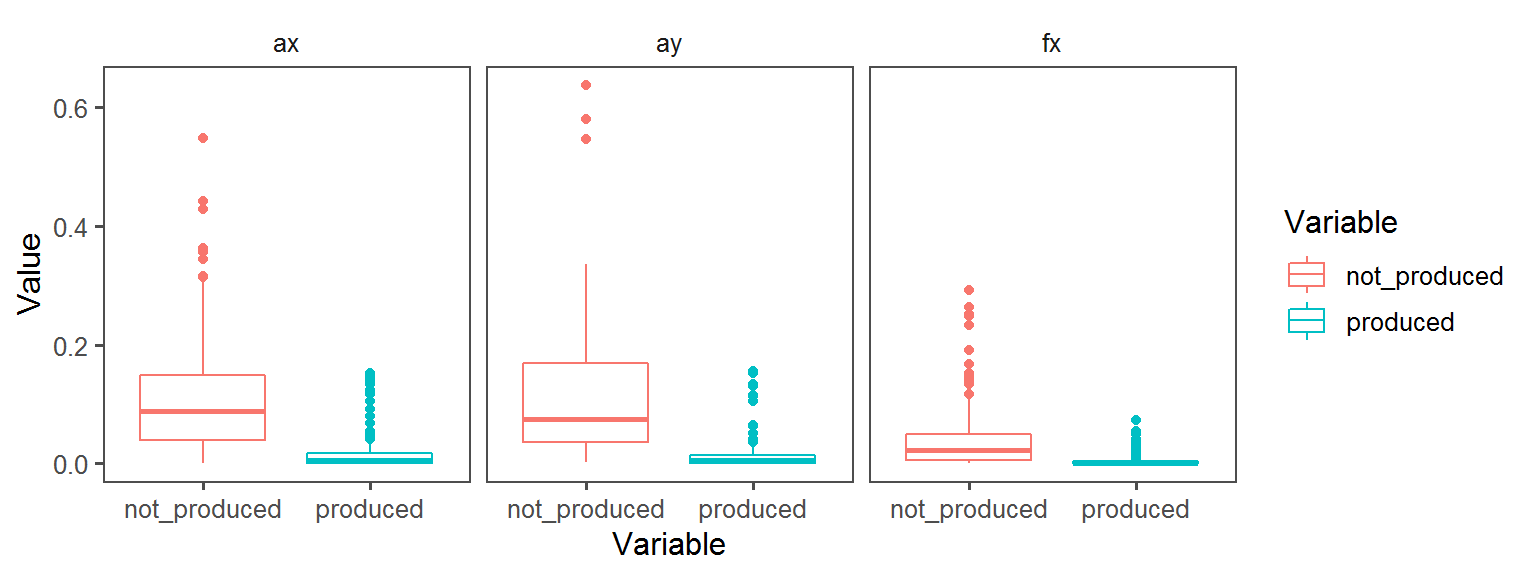
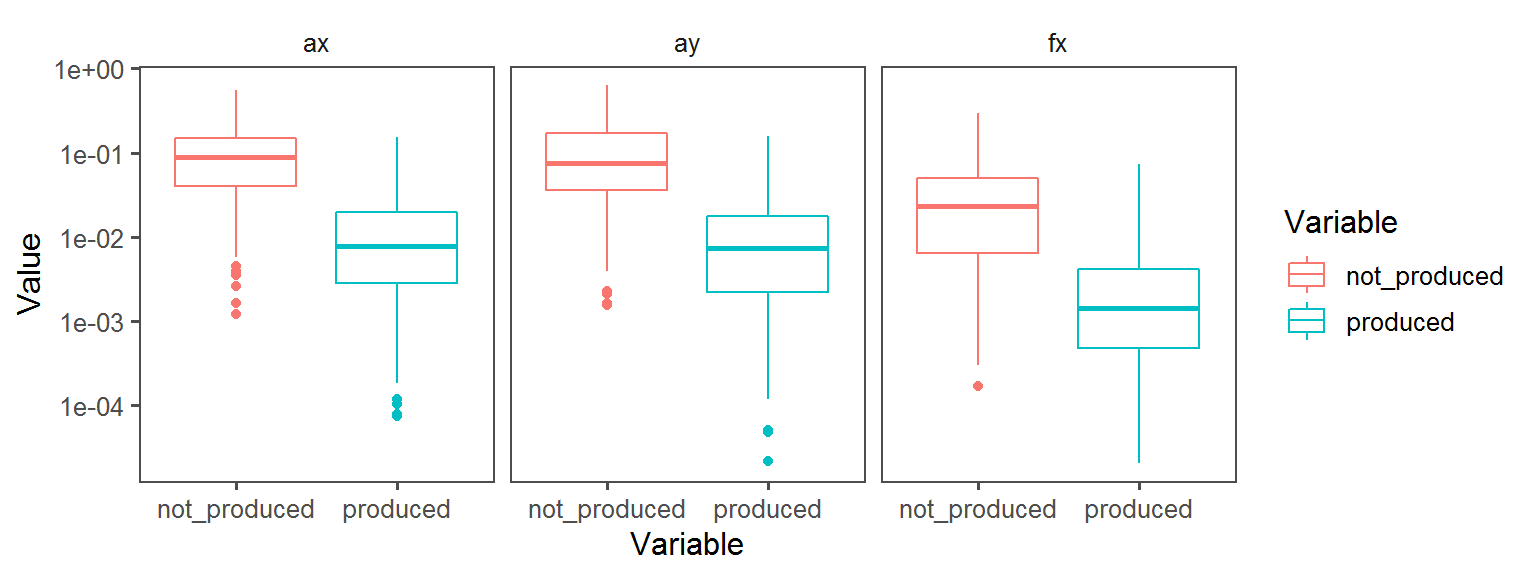
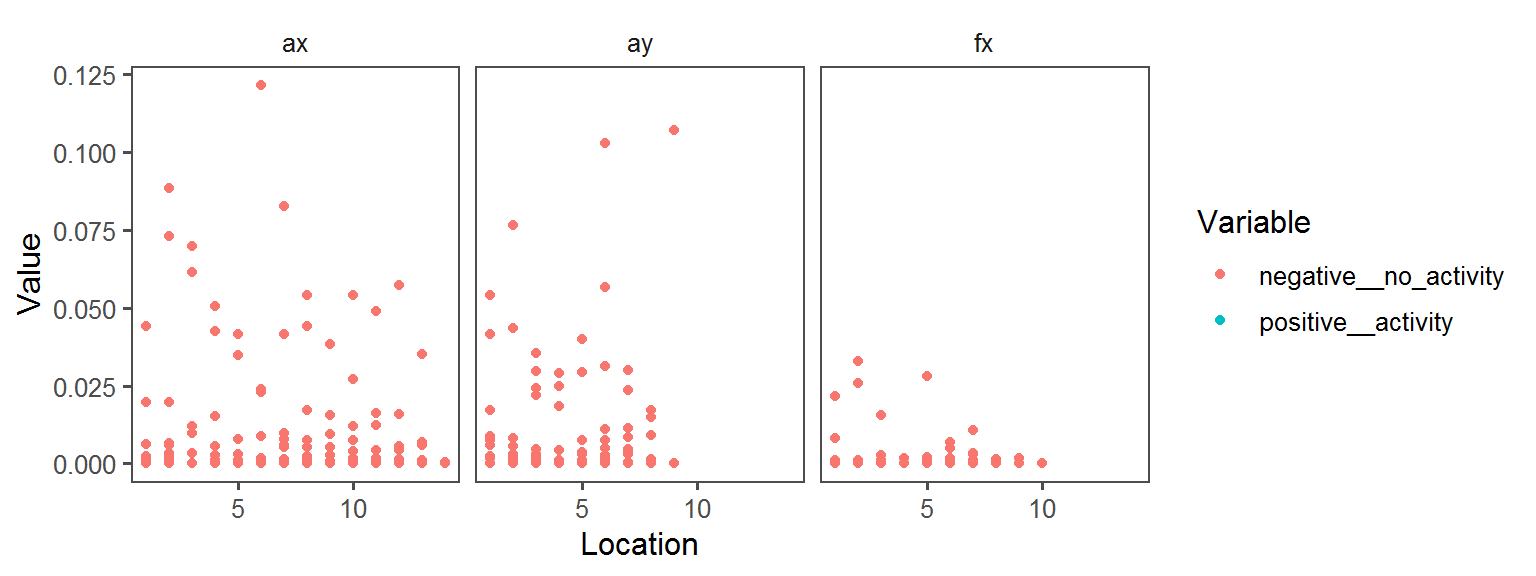
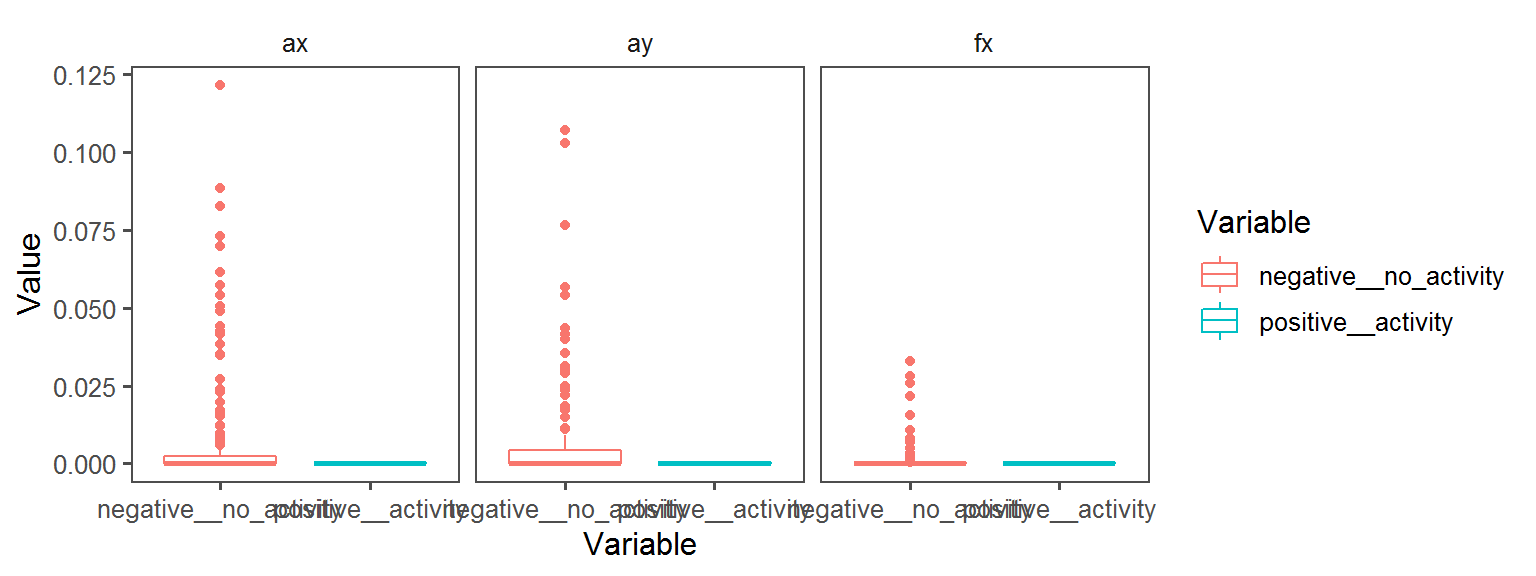
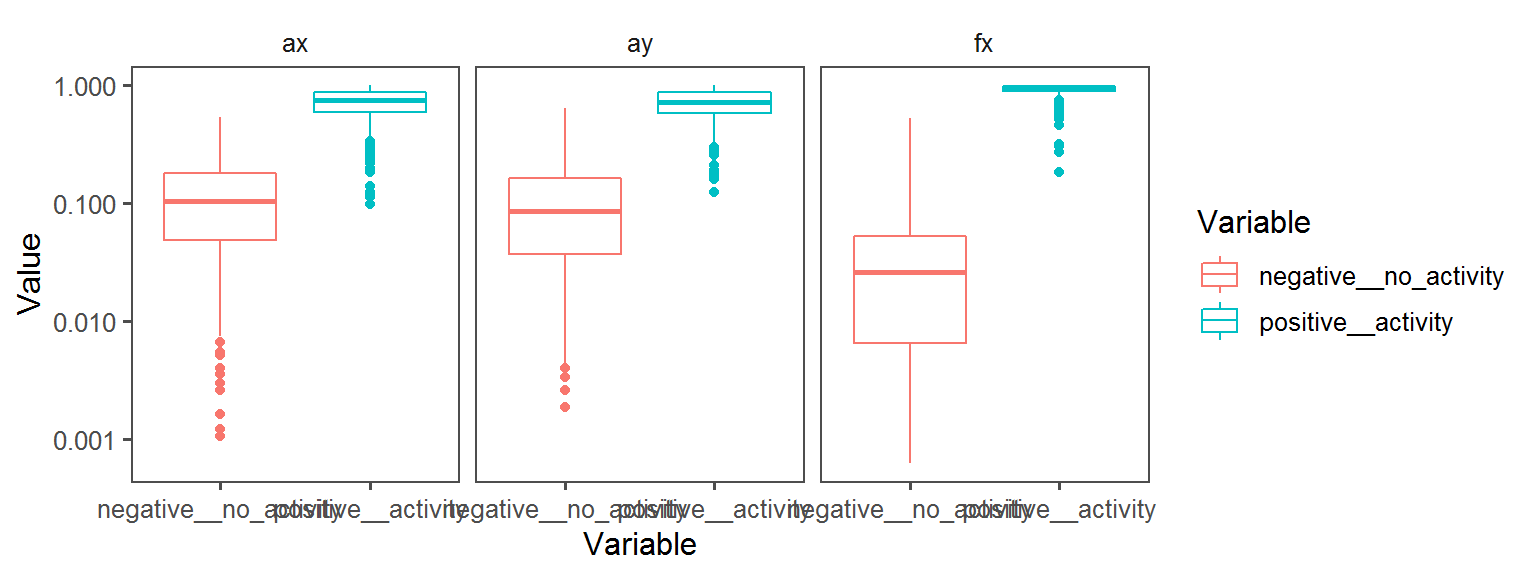
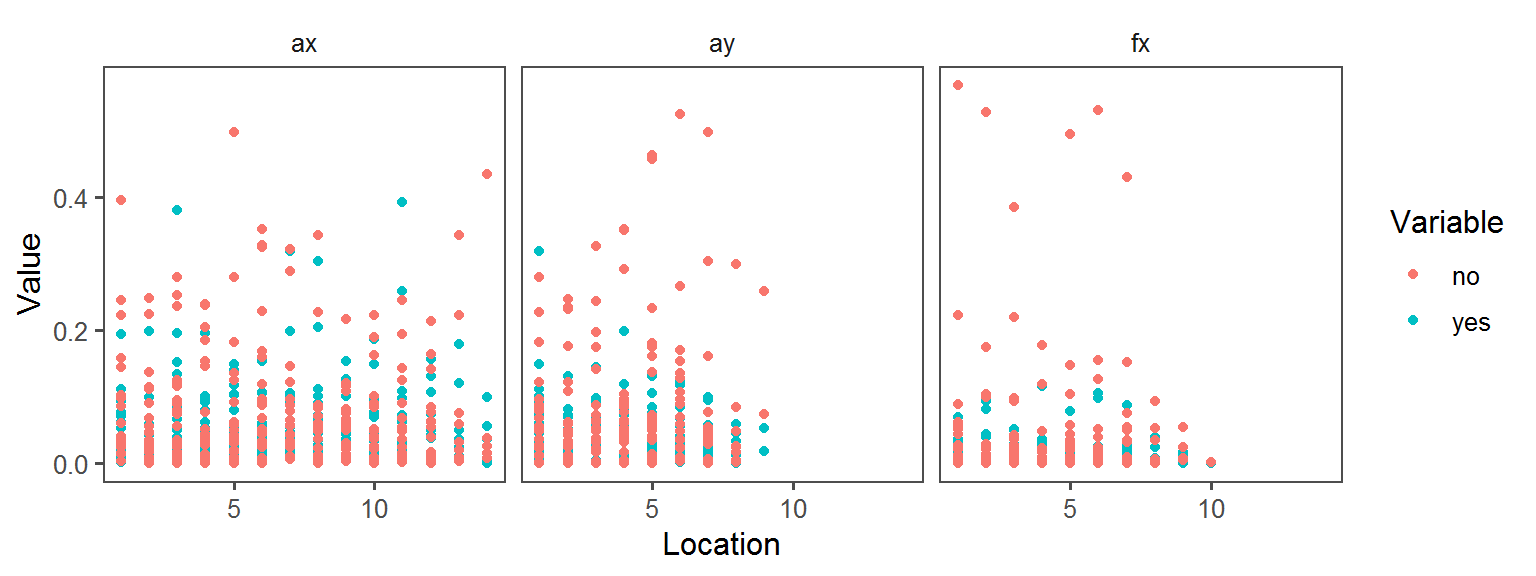
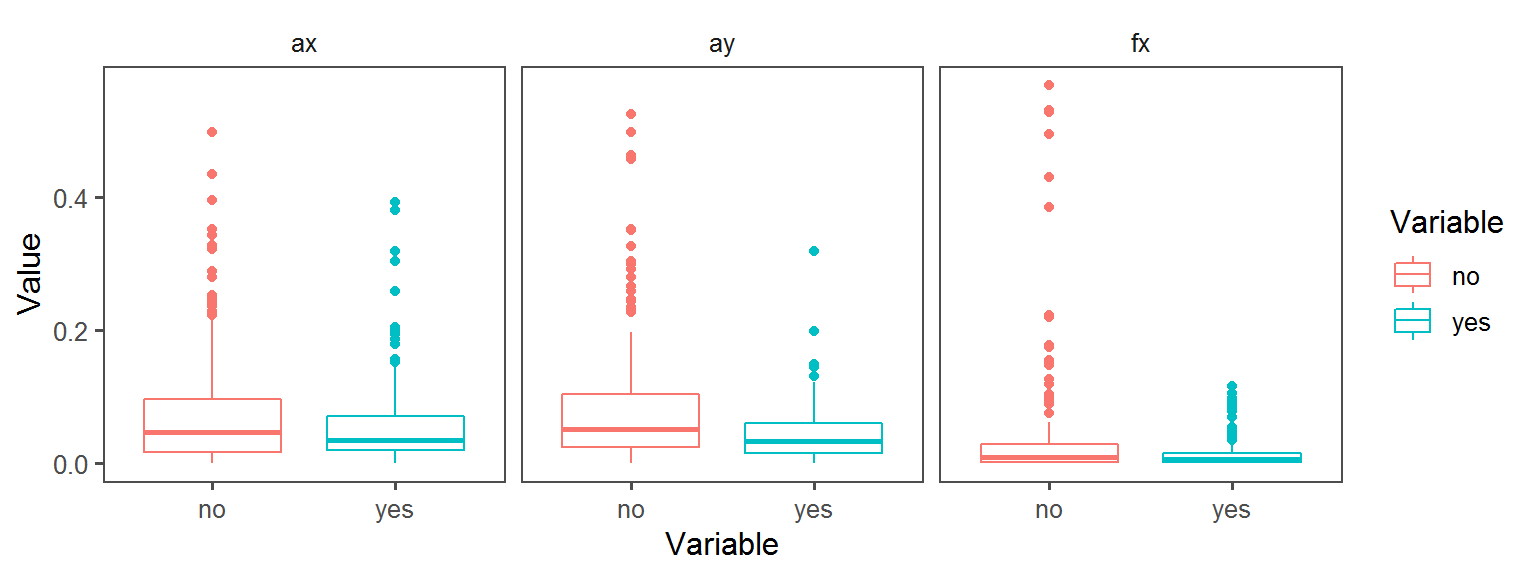
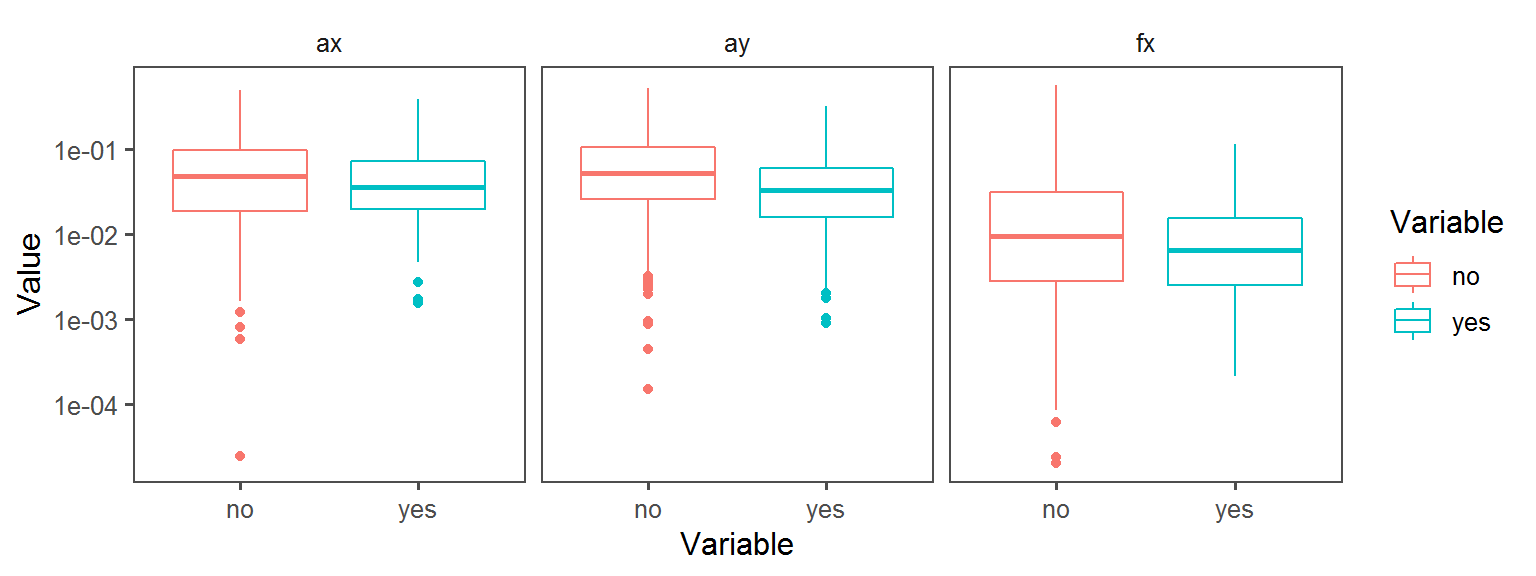
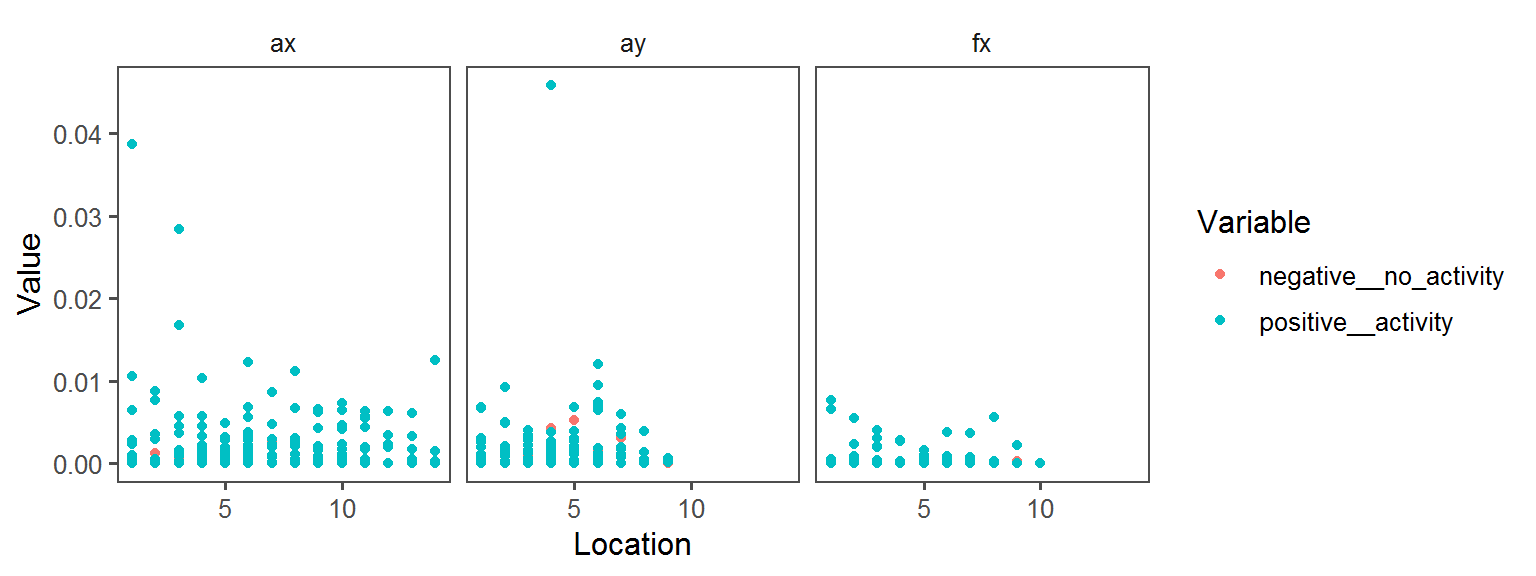
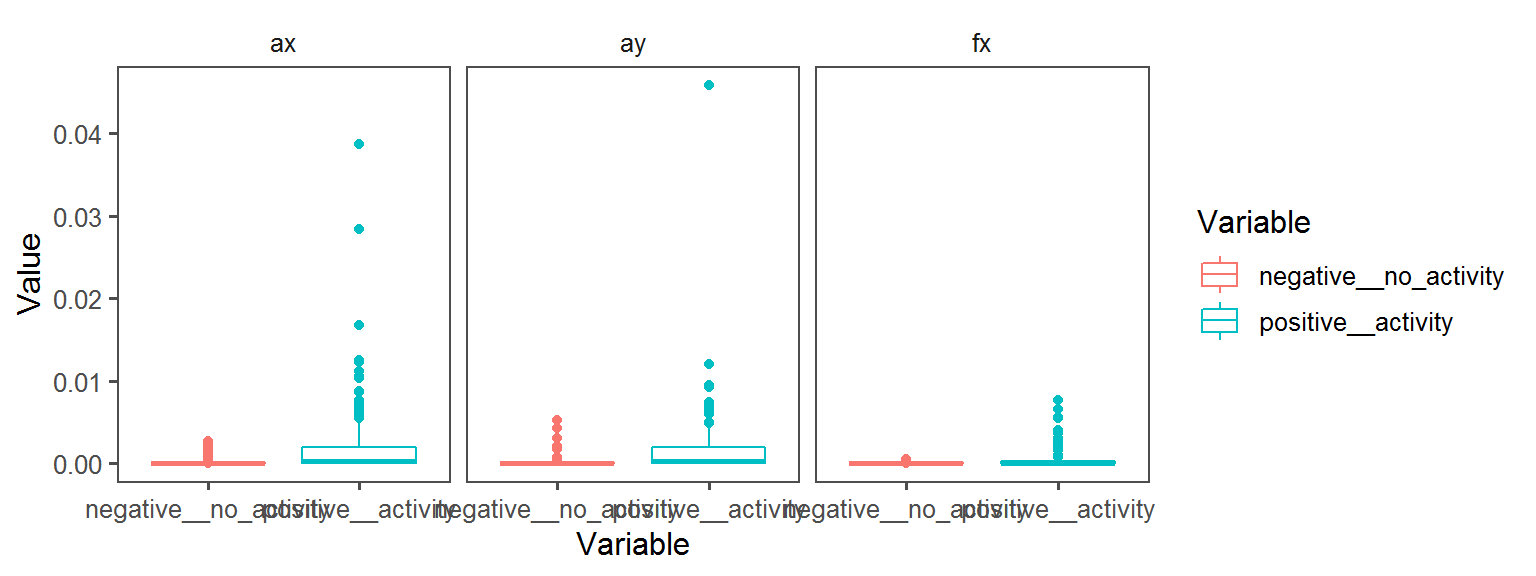
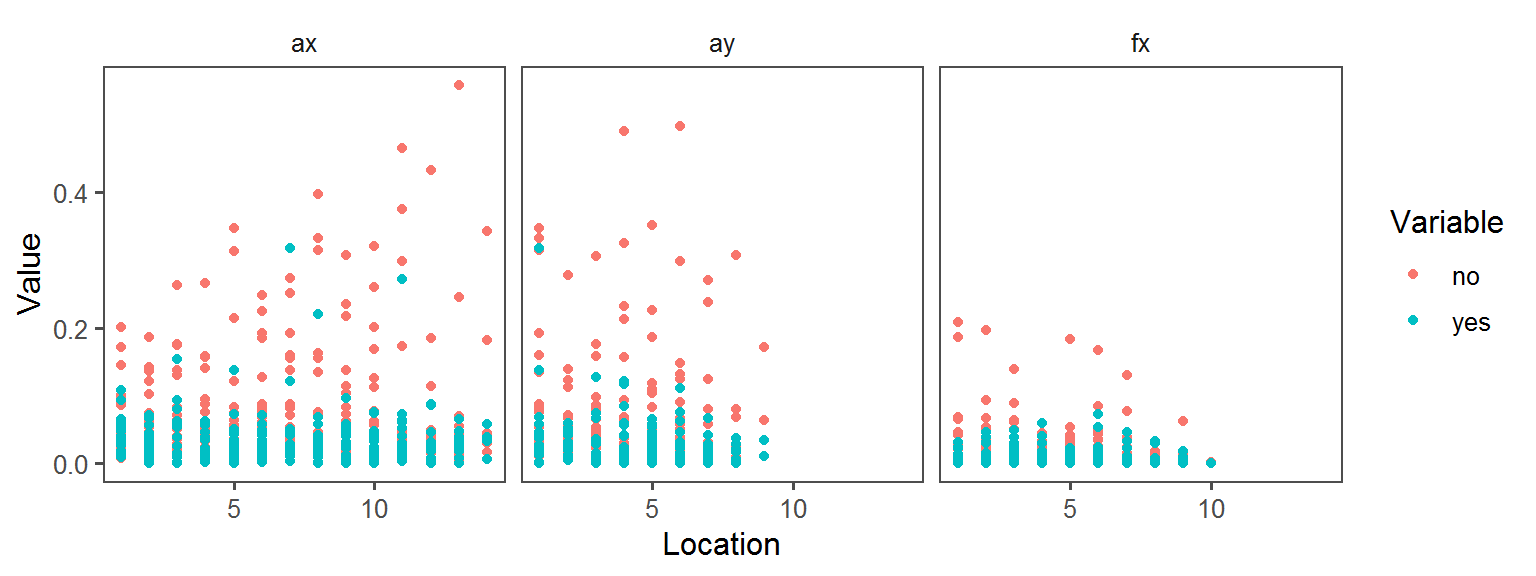
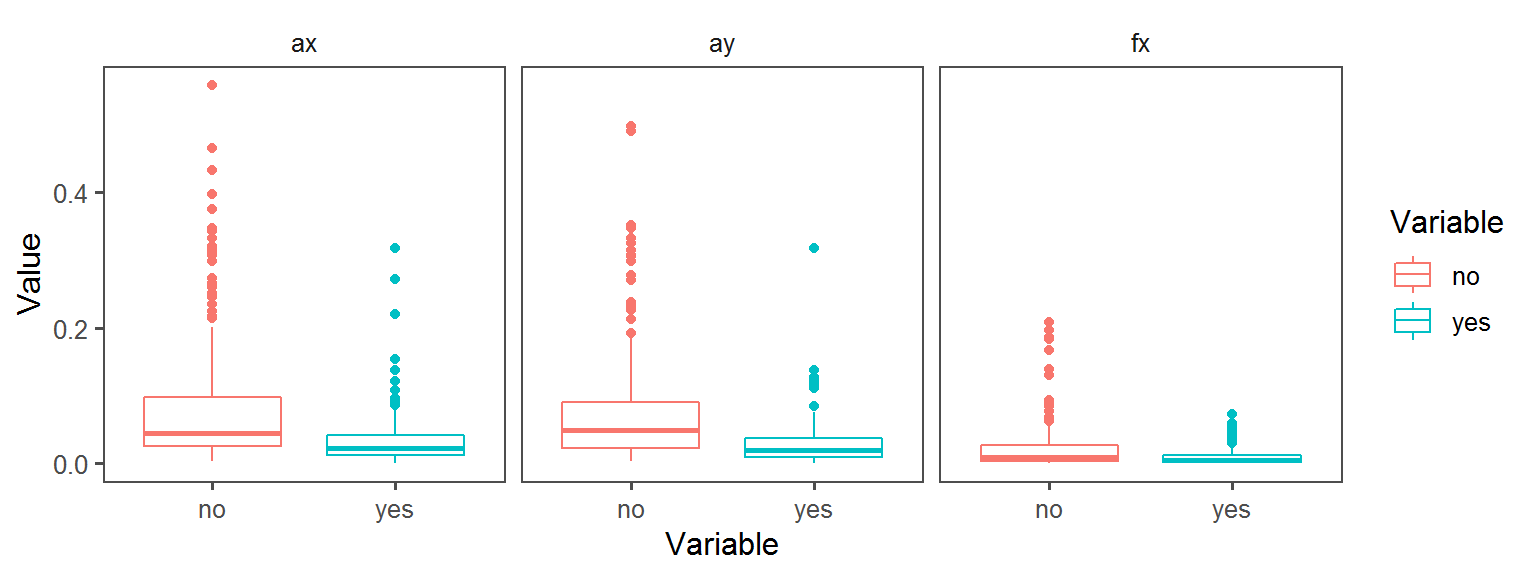
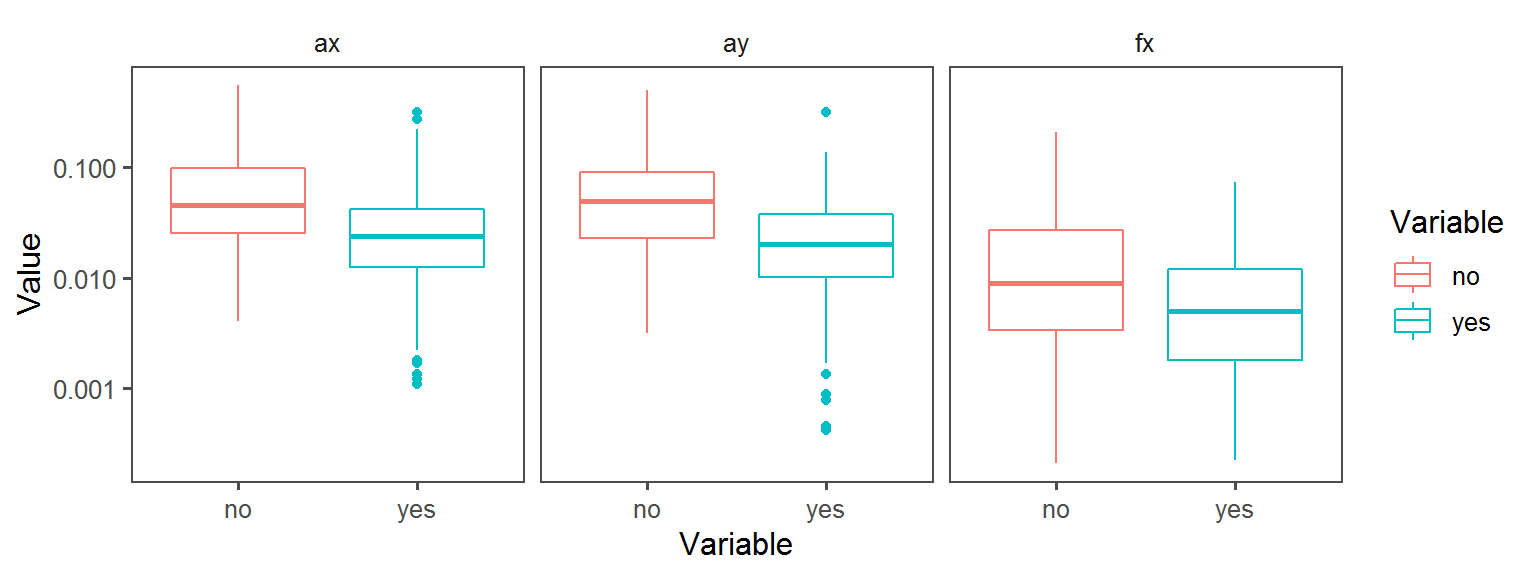
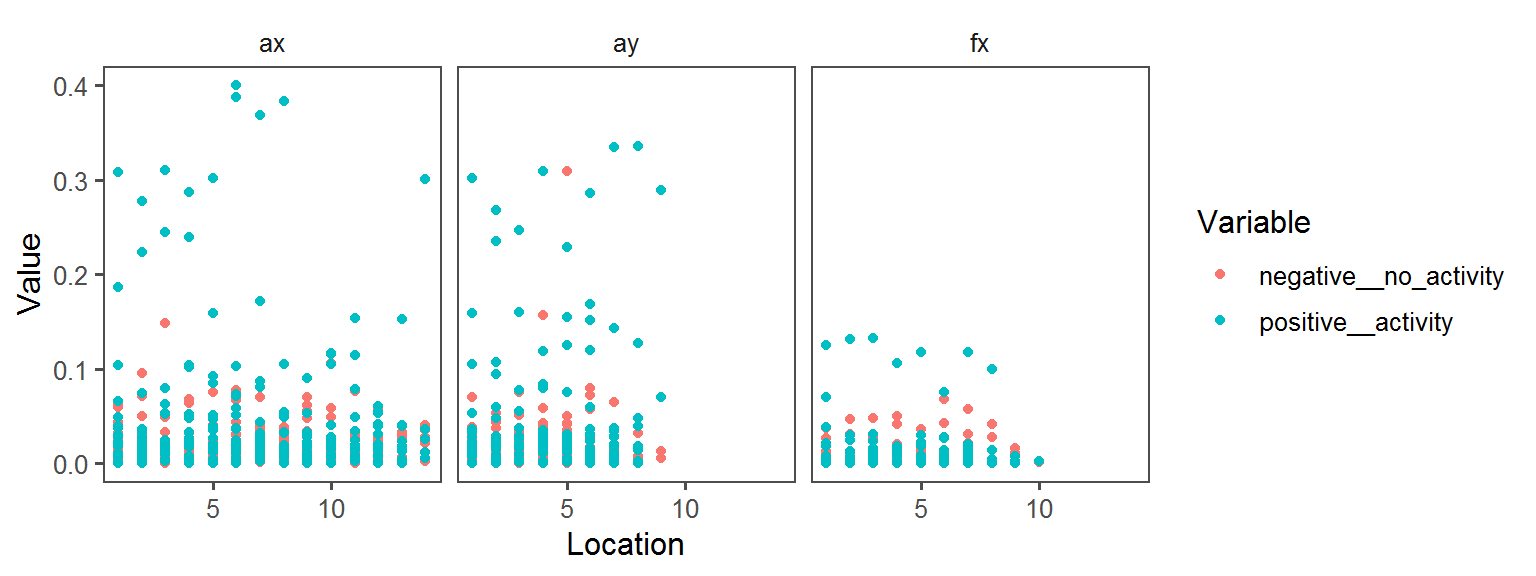
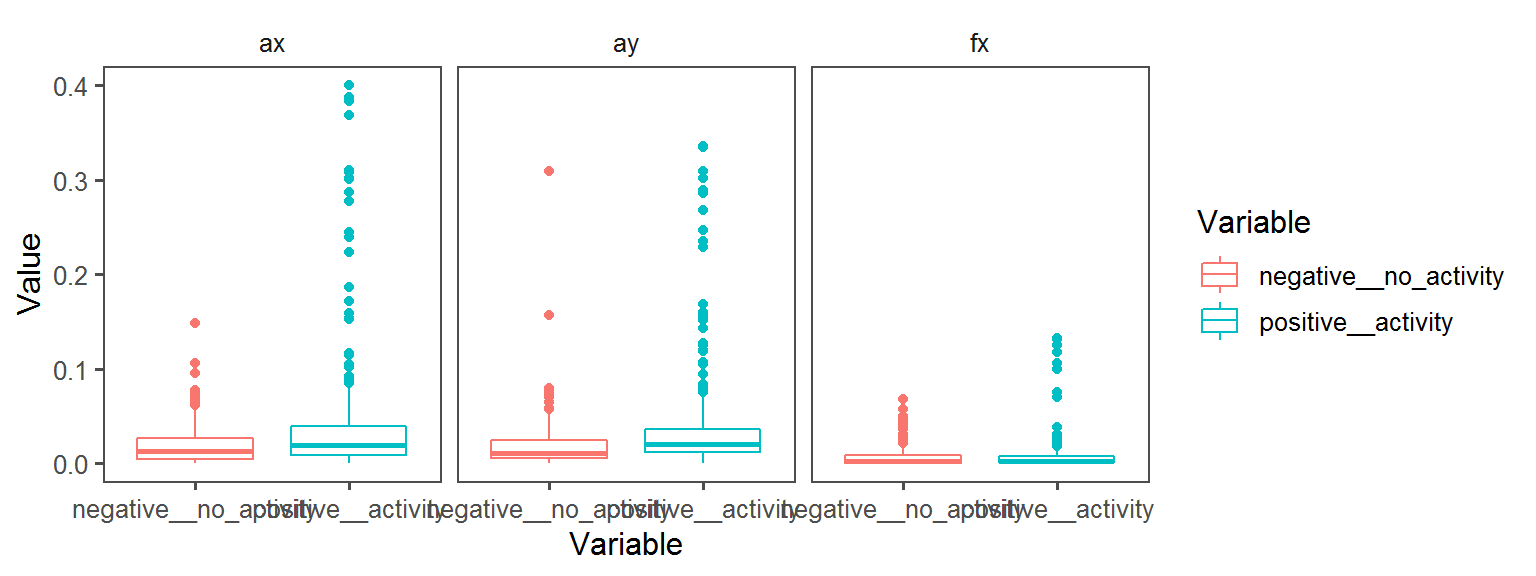
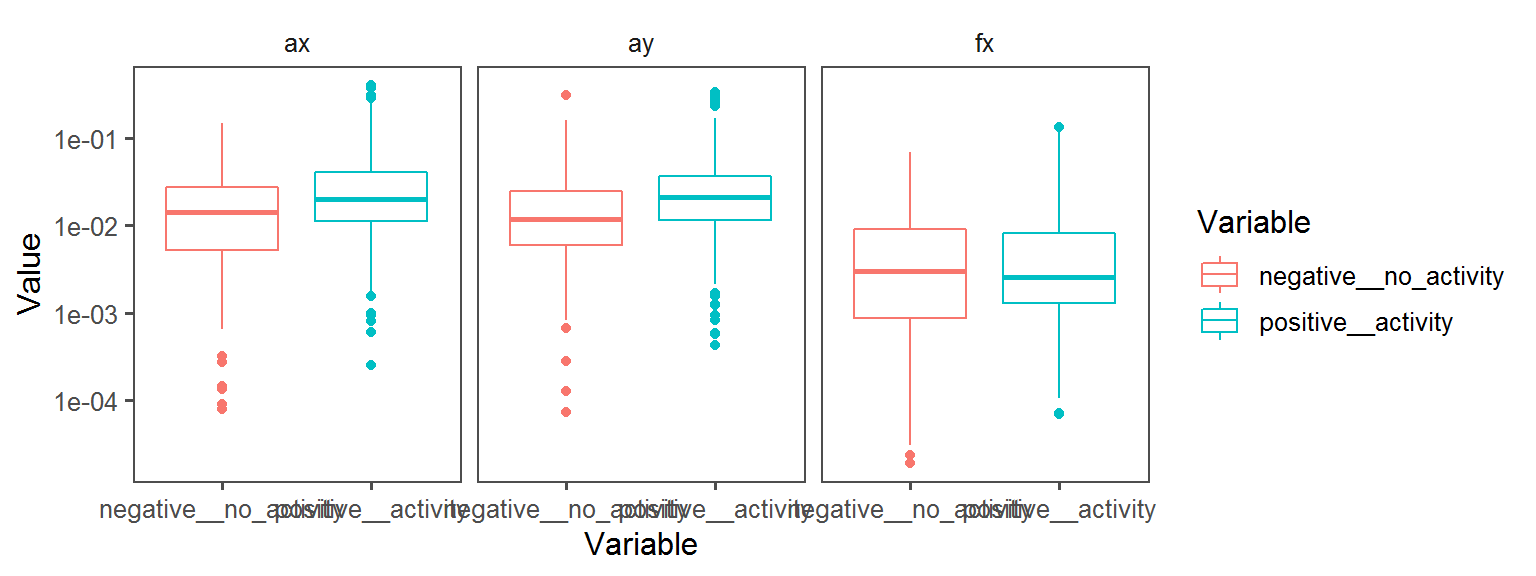
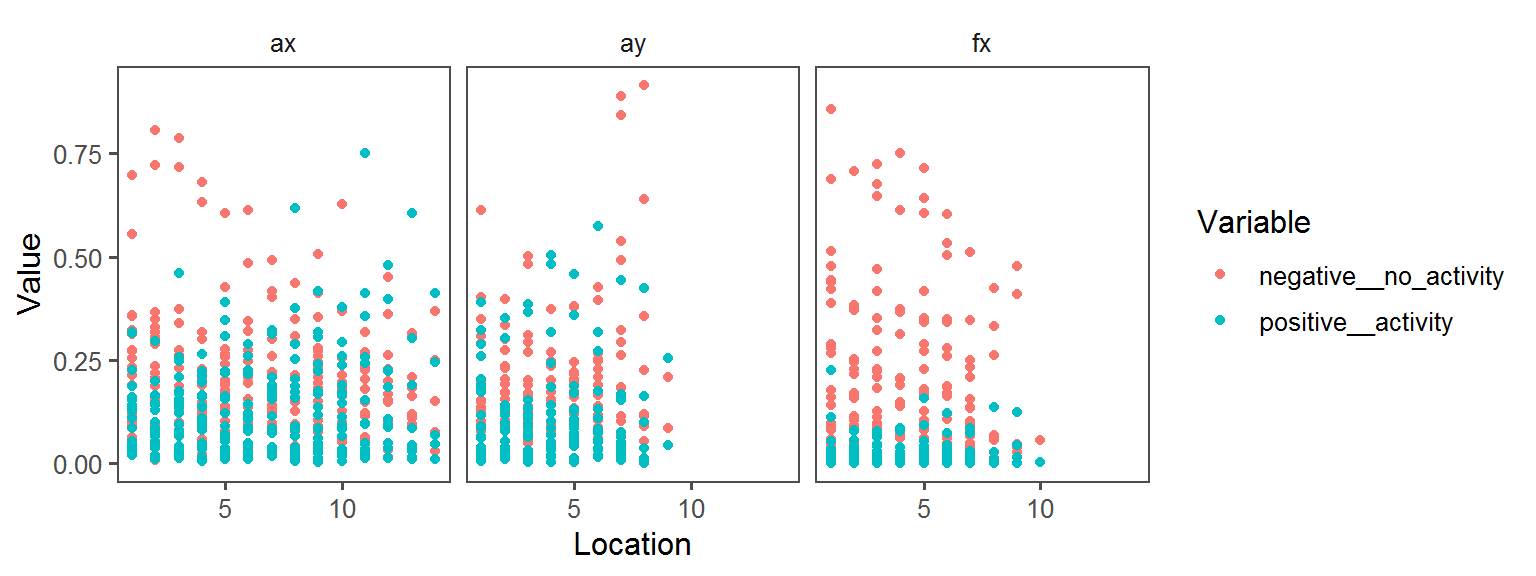
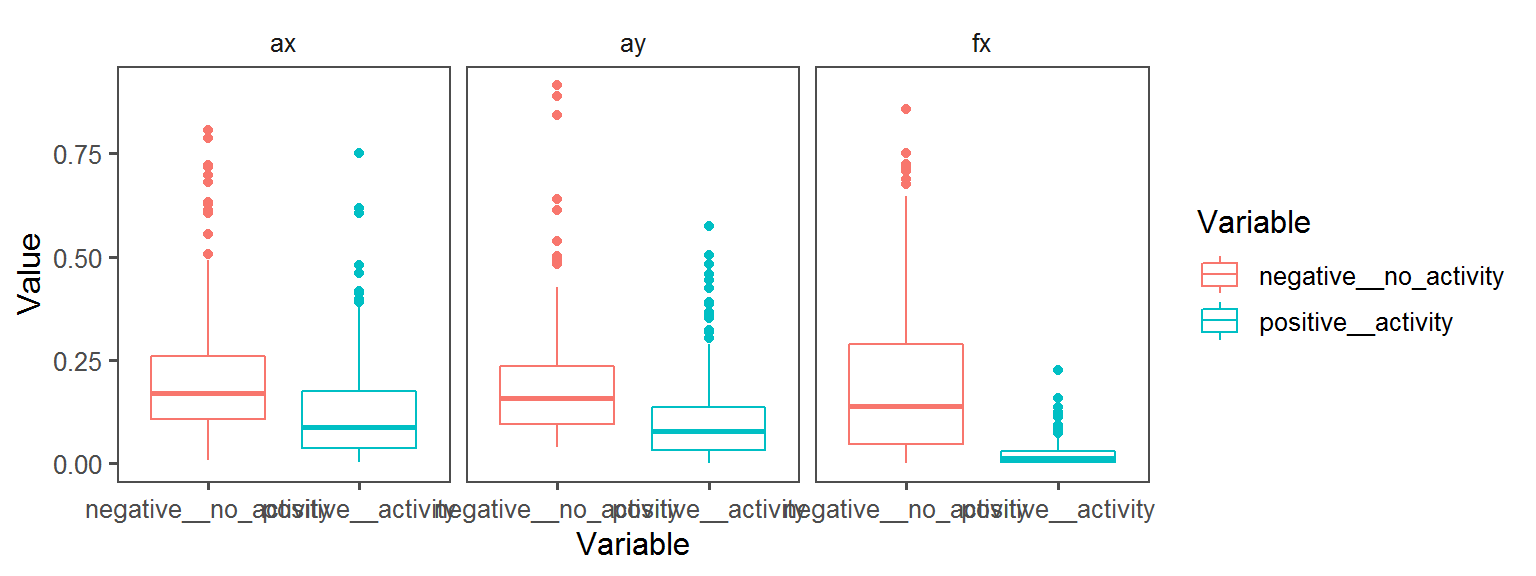
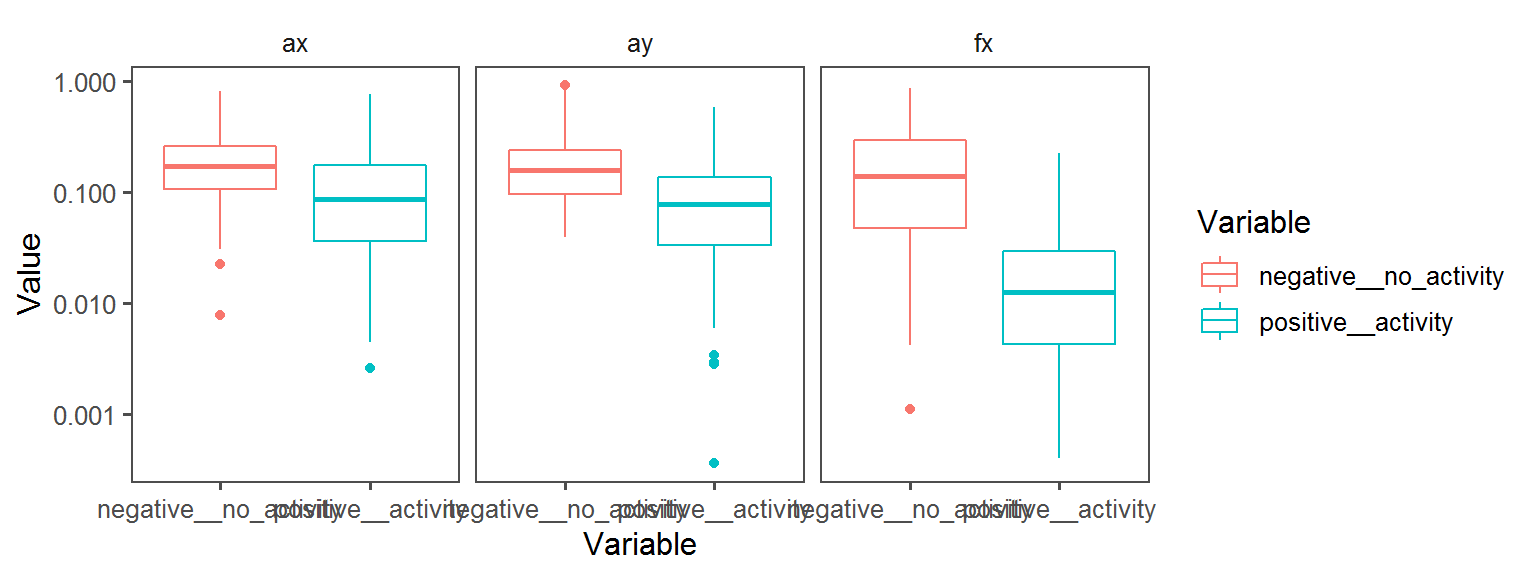
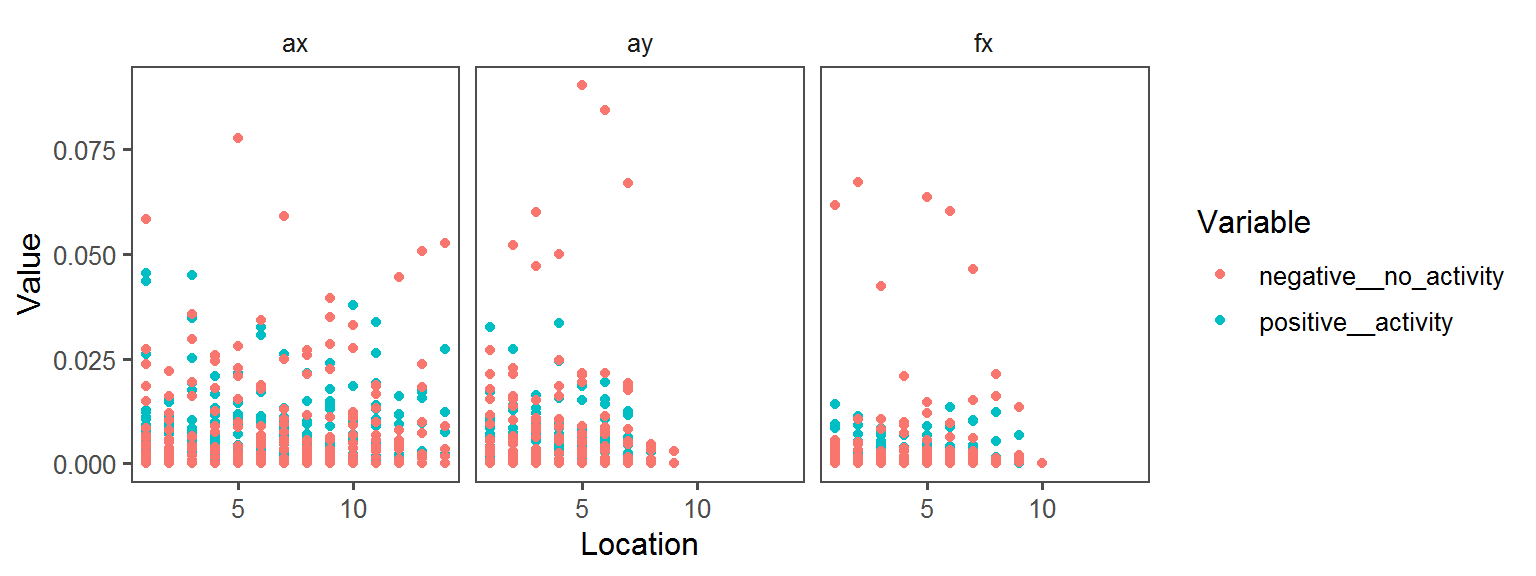
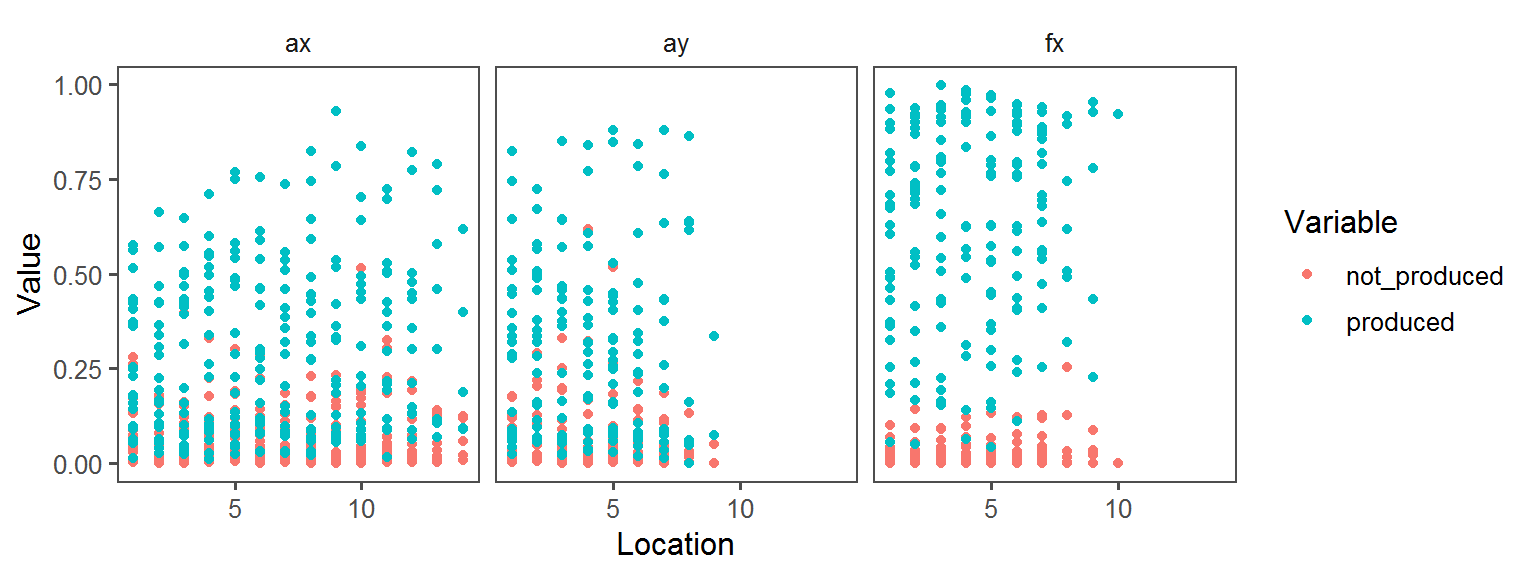
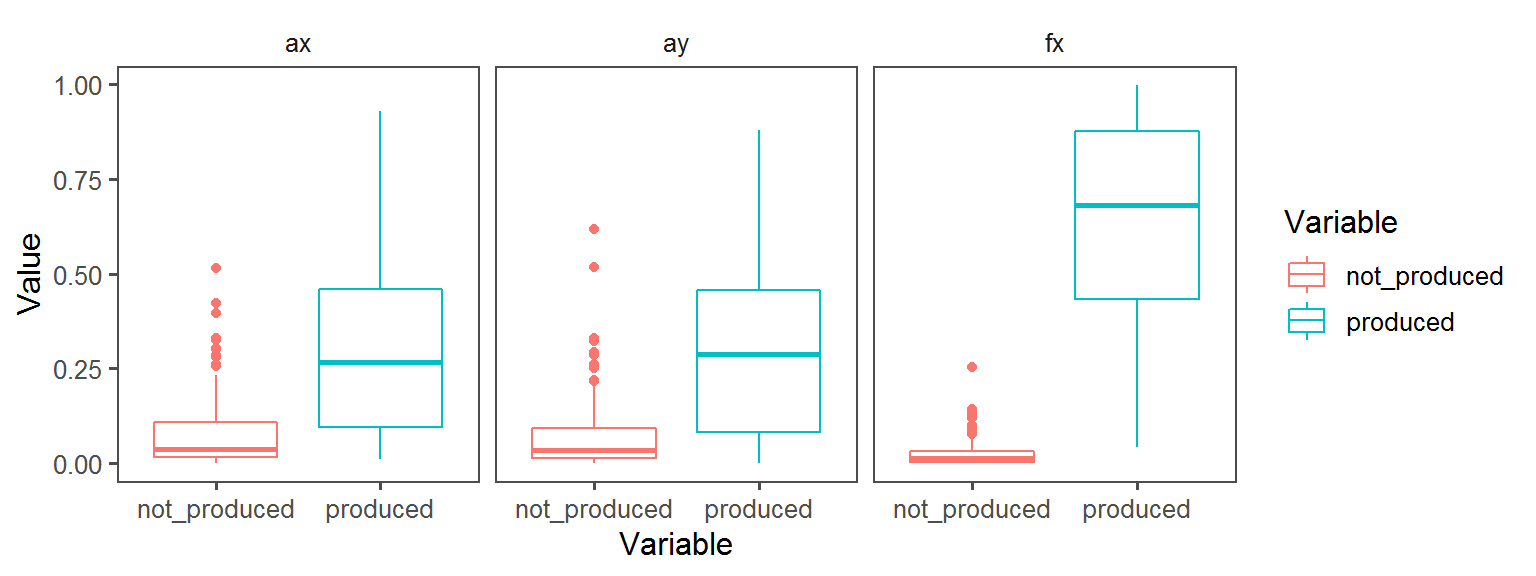
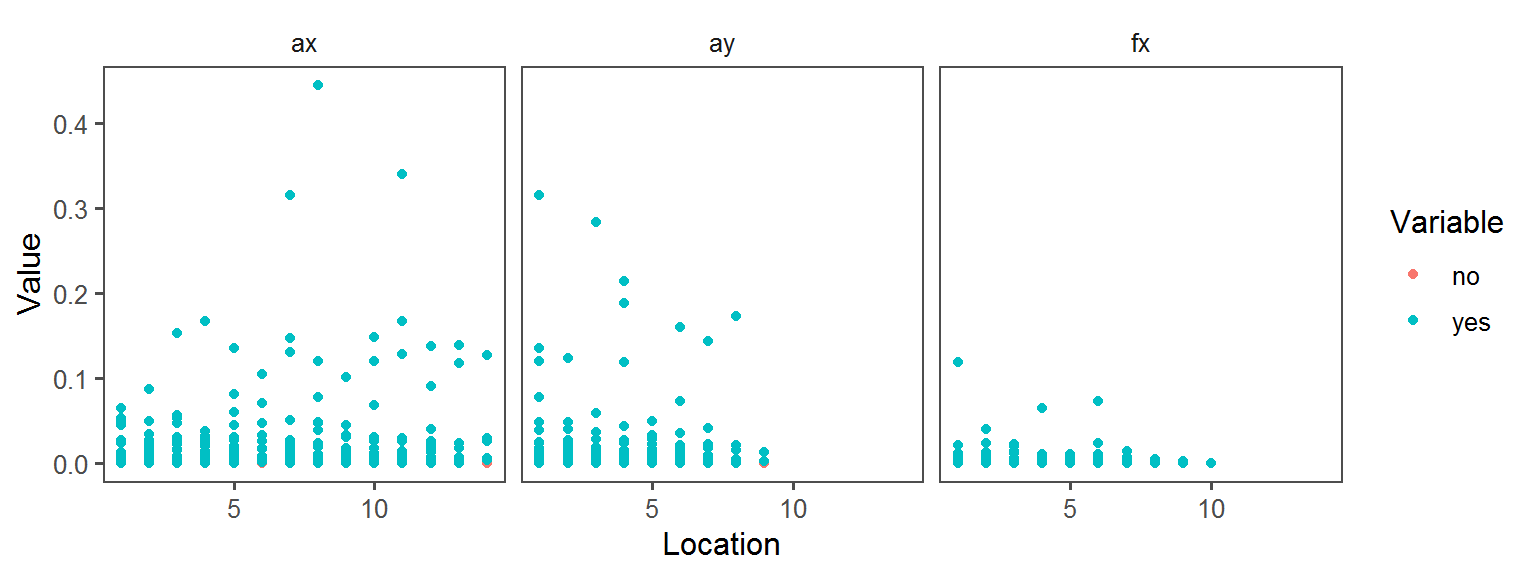
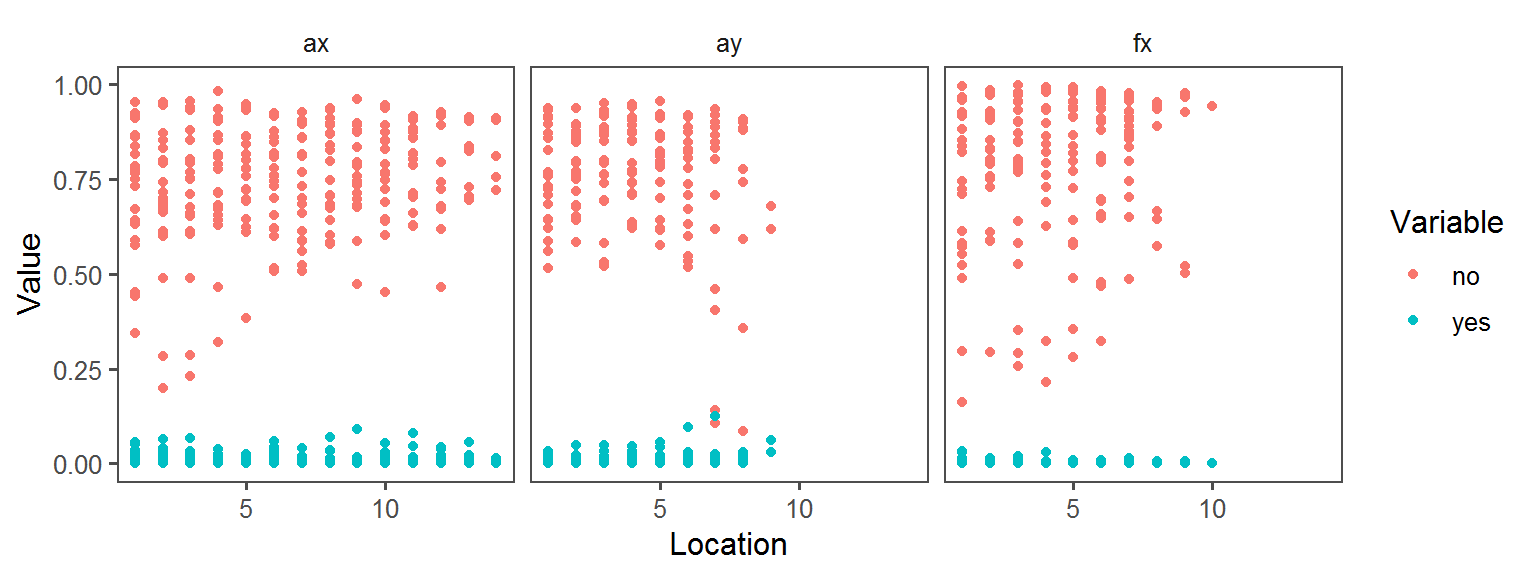
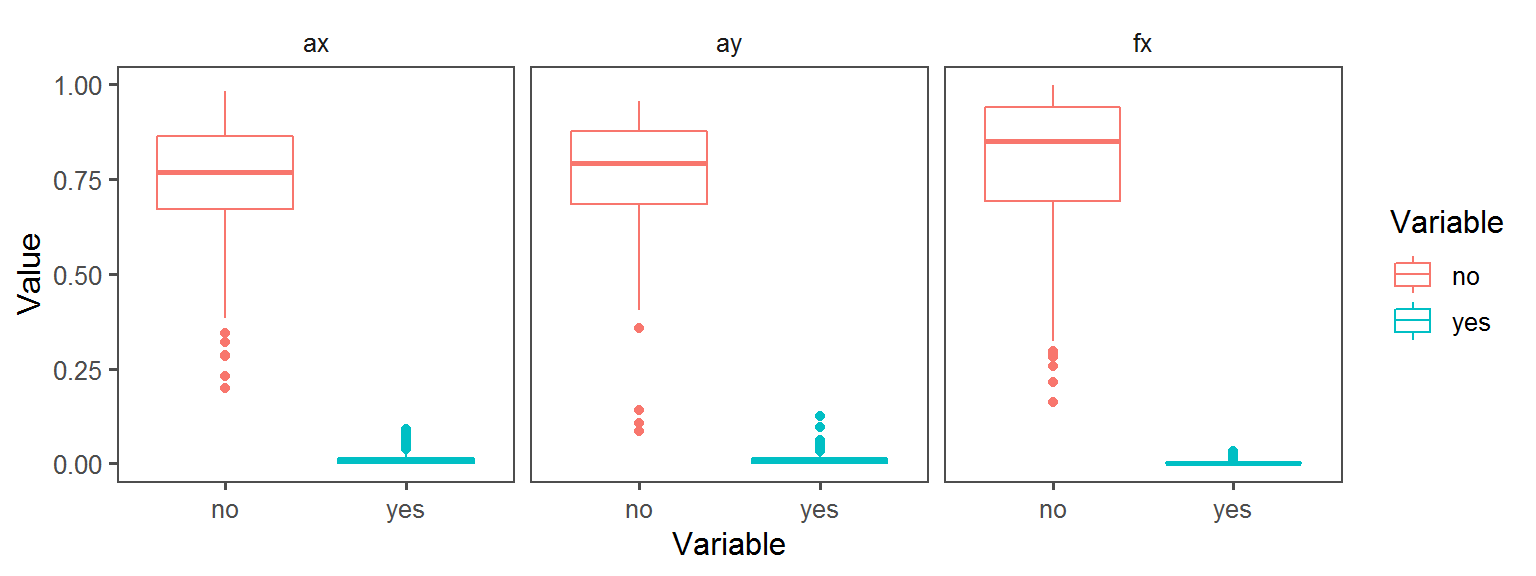
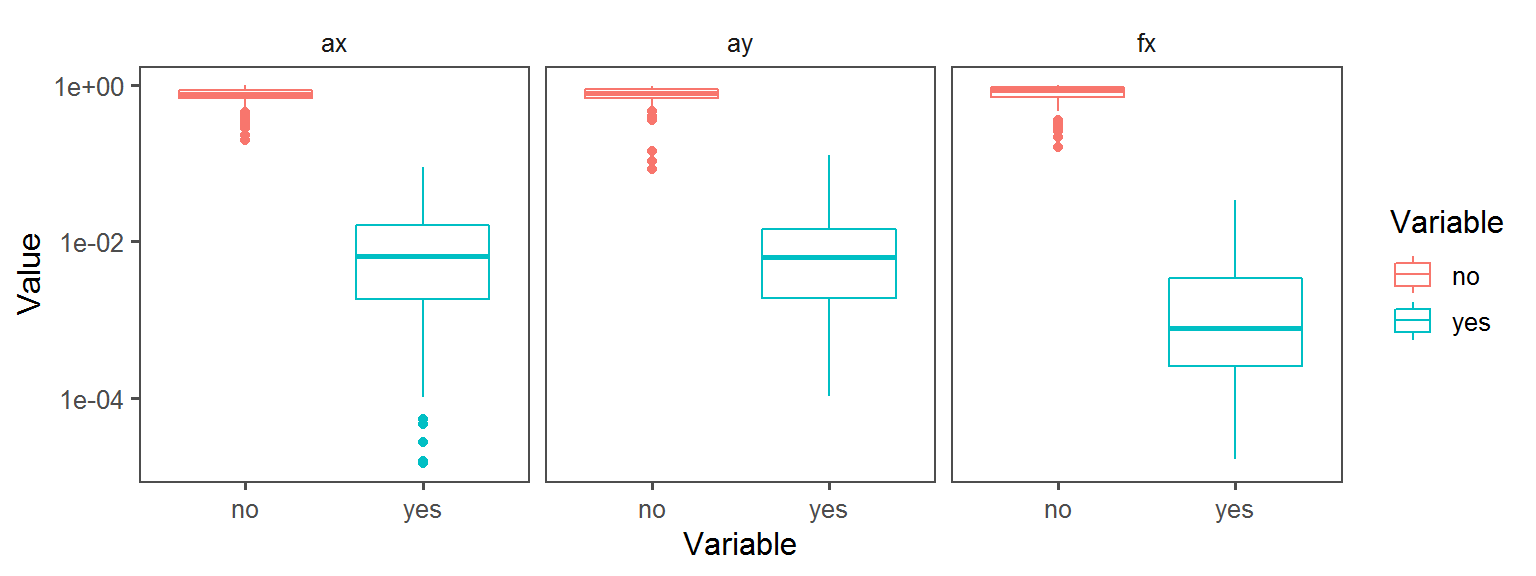
Below, a whole bunch of plots of the different traits across the different locations across the different transects:
traits <- levels(trait.dataframe$Trait)require(ggthemes)
for(t in traits){
cat(paste0("### ", t, "\r\r"))
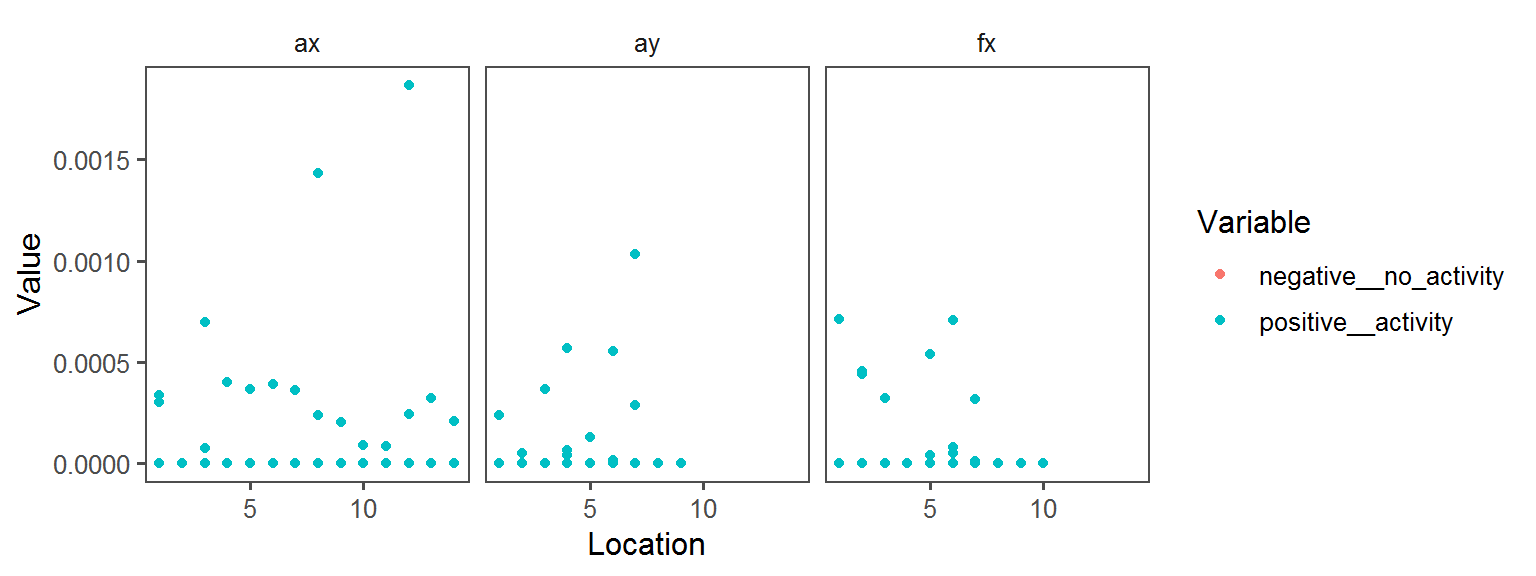
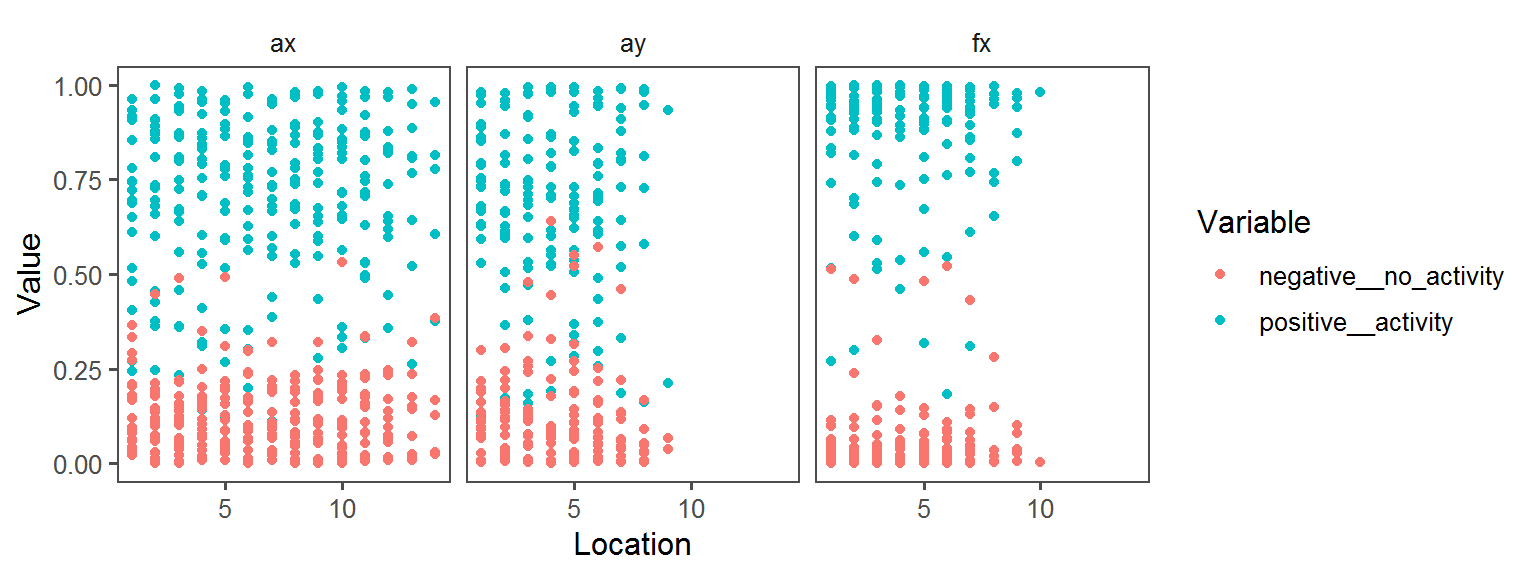
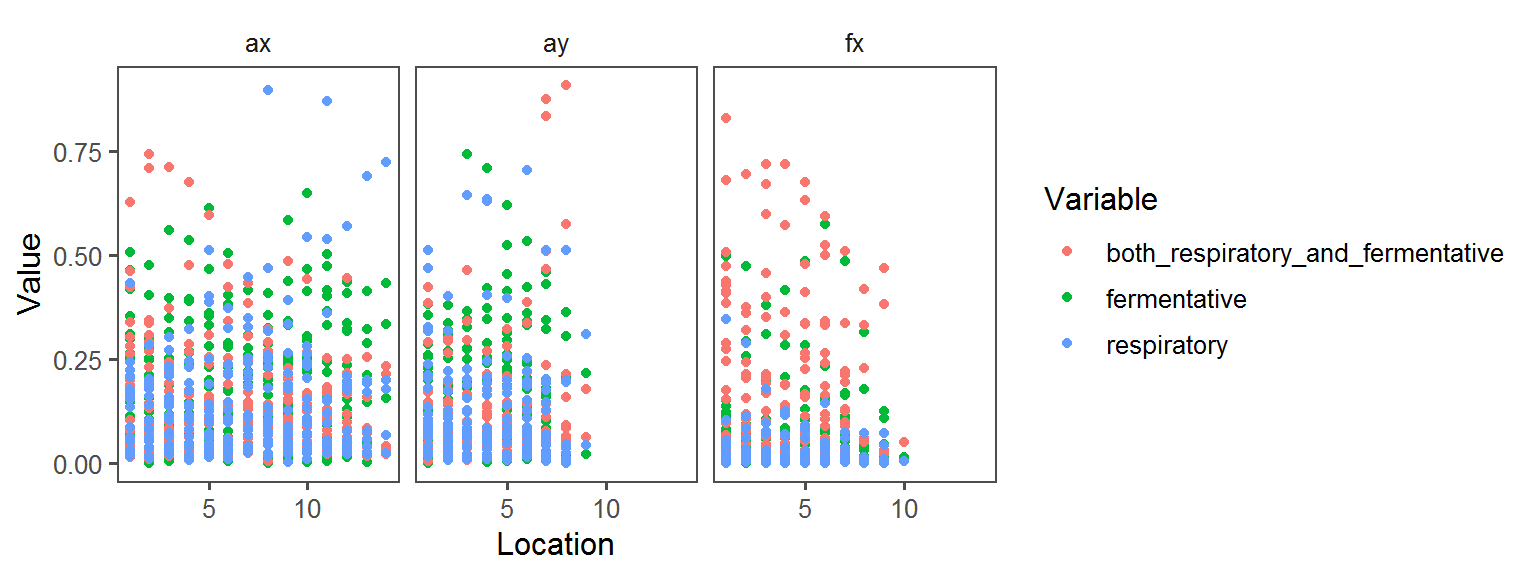
p1 <- ggplot(trait.dataframe %>% subset(Trait == t),
aes(Location, Value, col = Variable)) + facet_wrap(.~Transect) + geom_point() + theme_few()
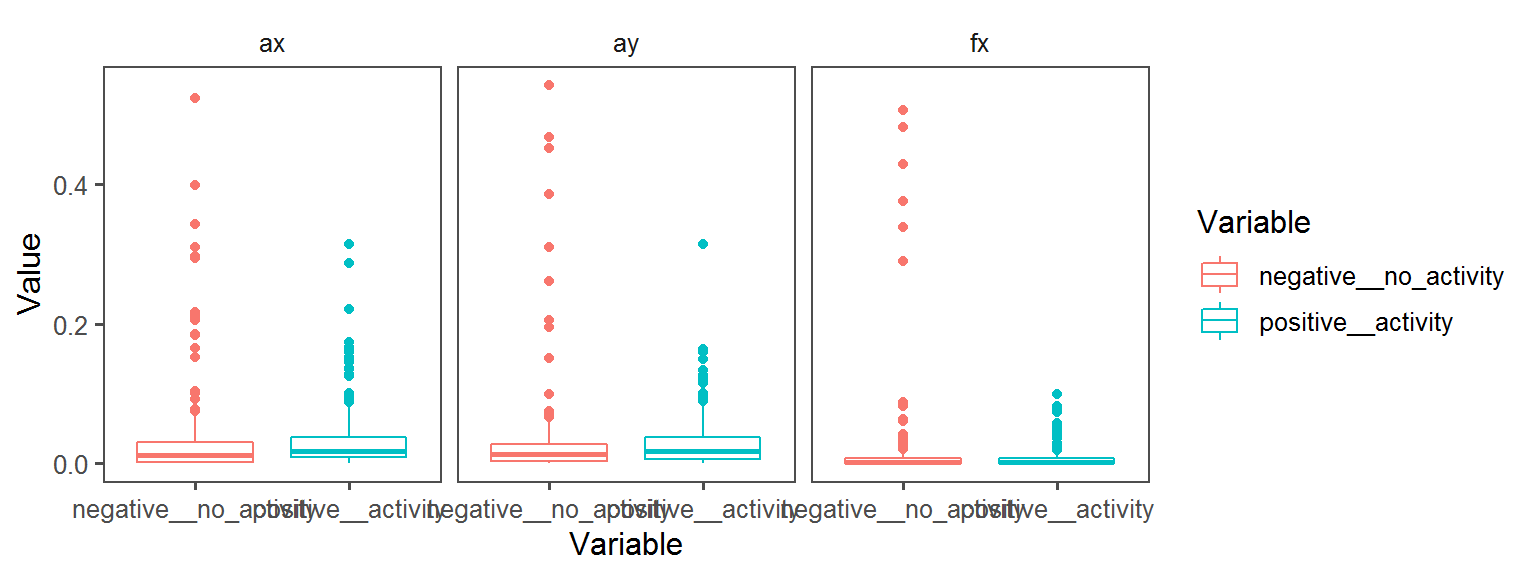
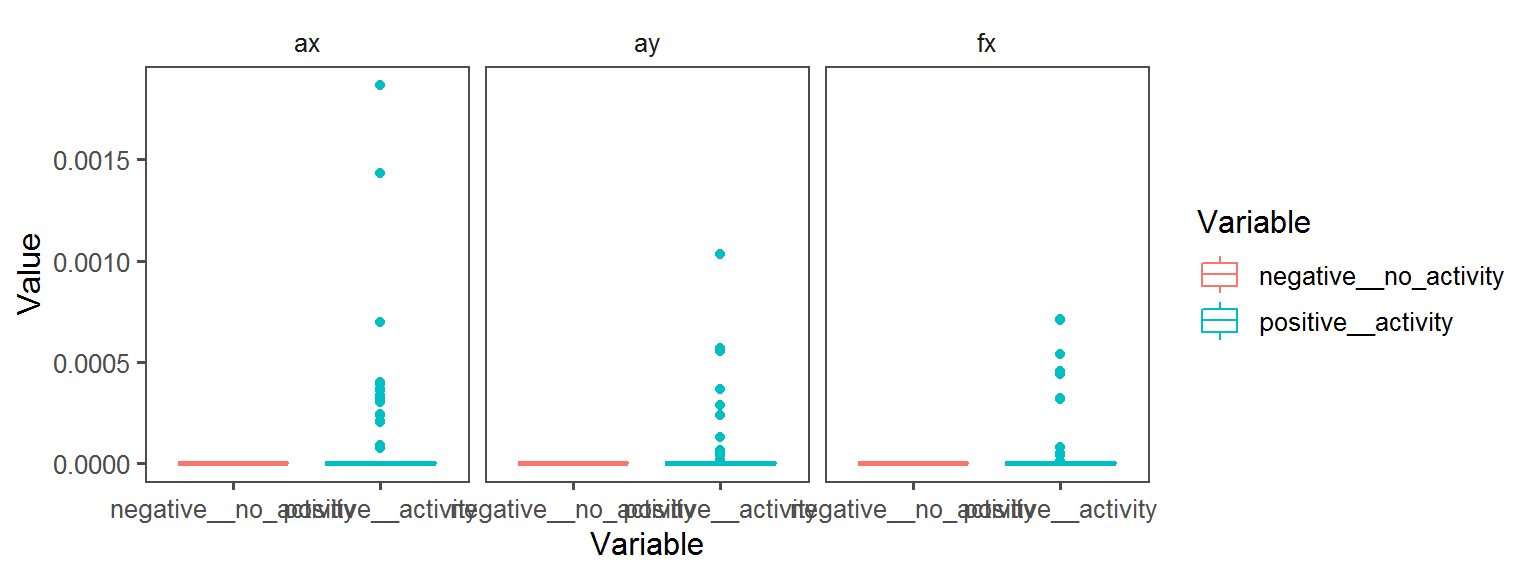
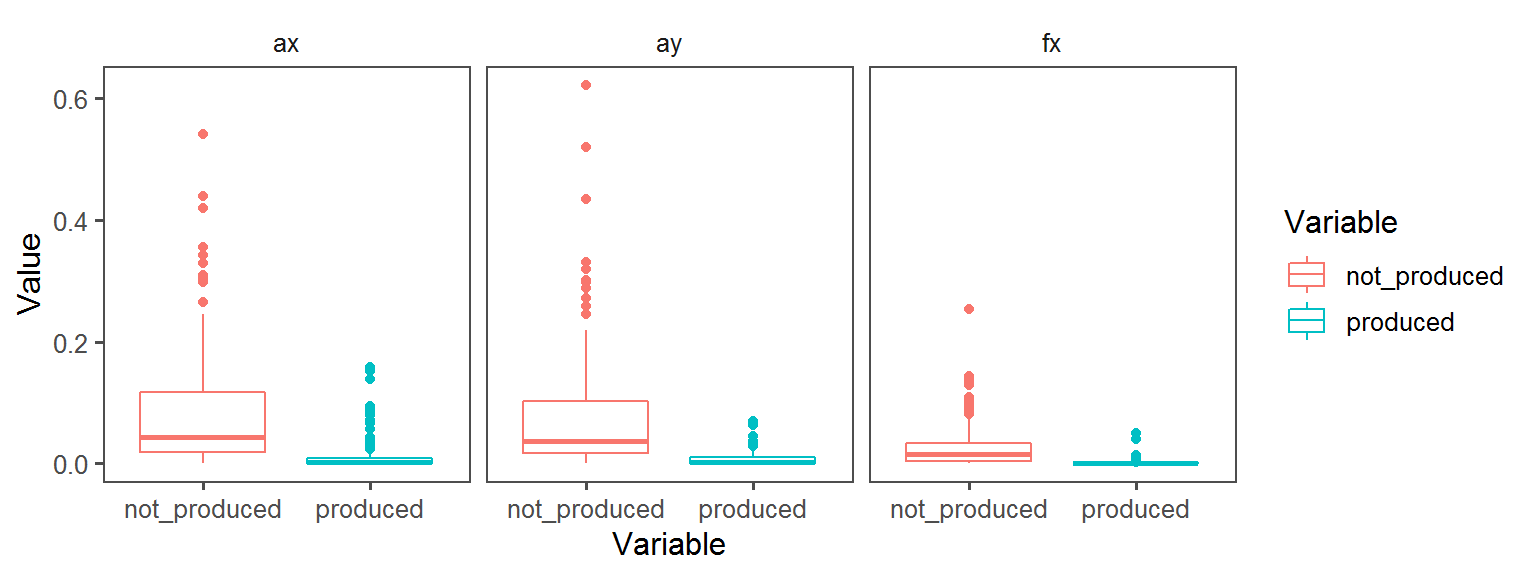
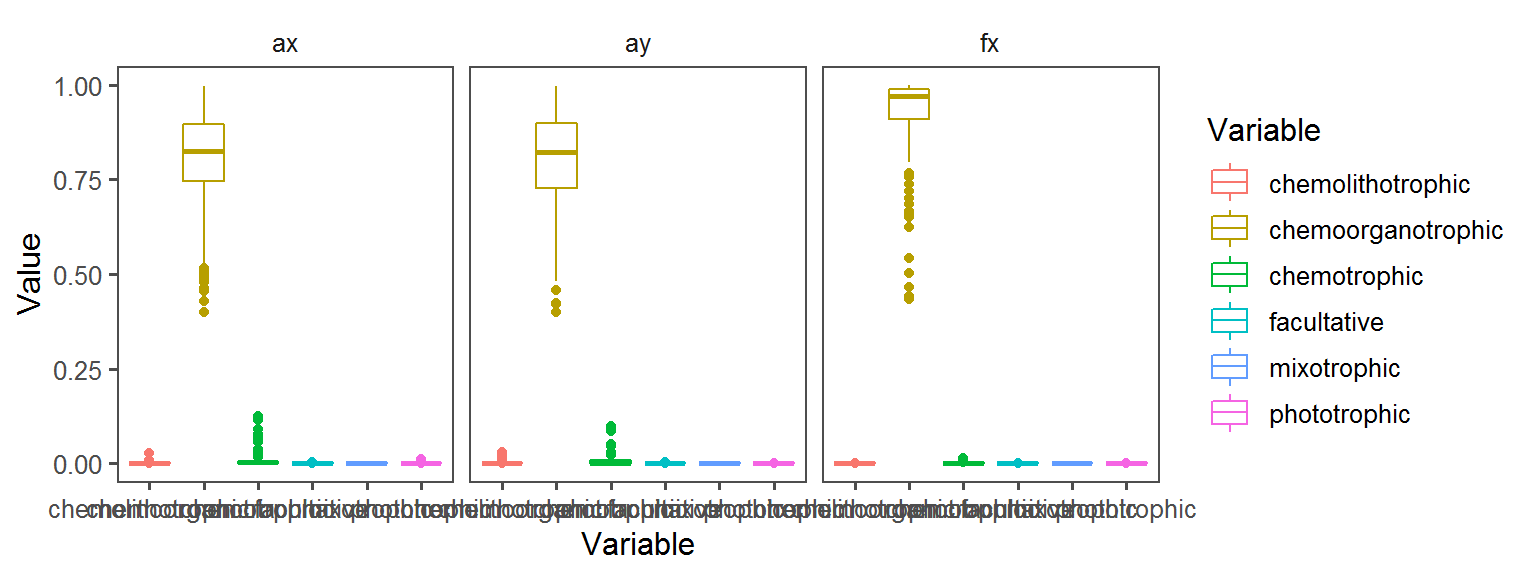
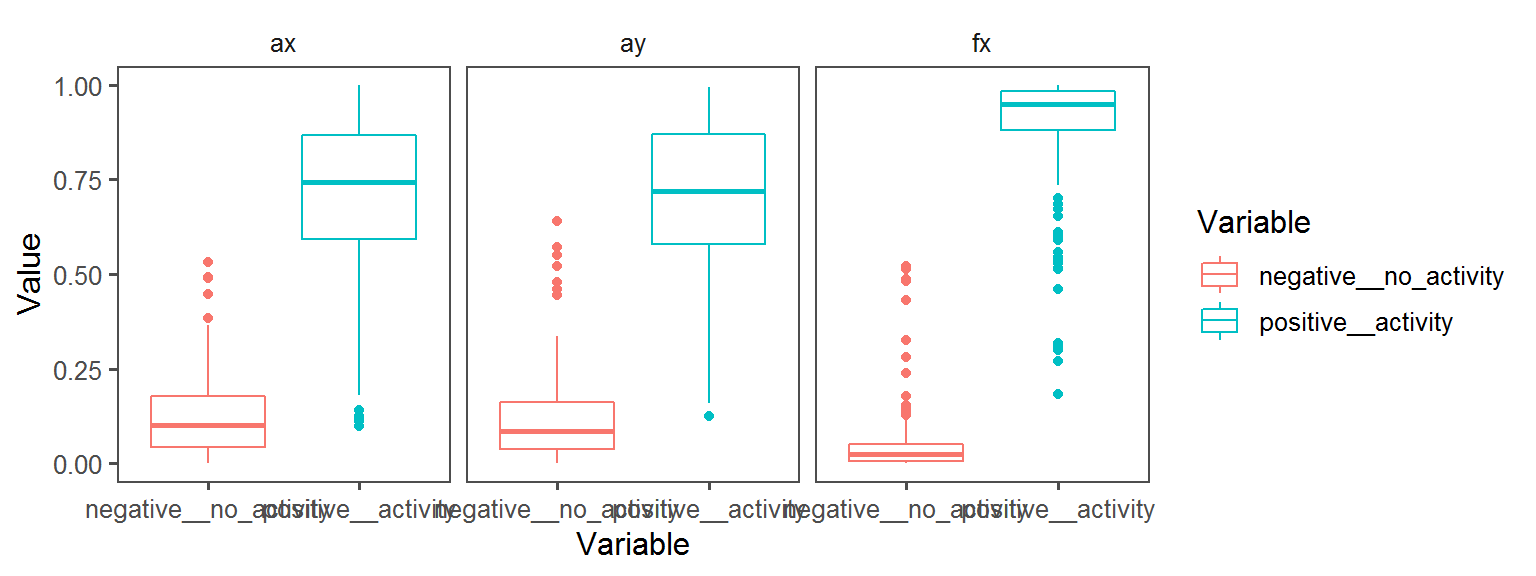
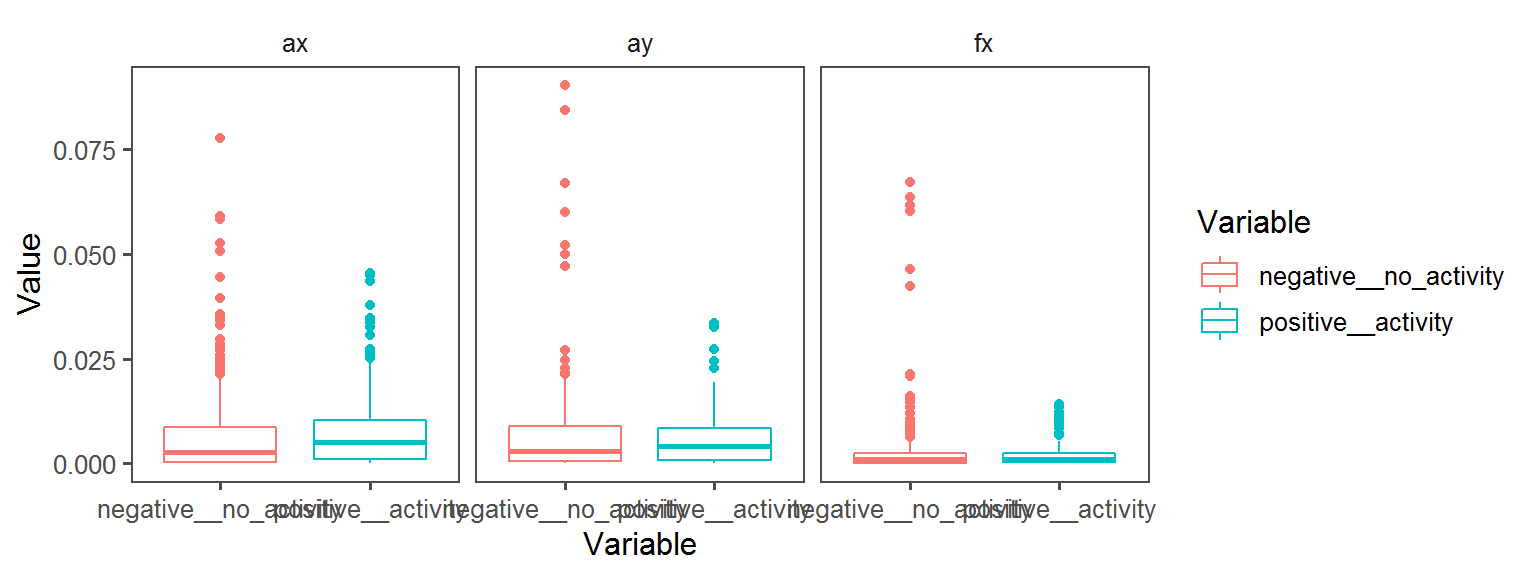
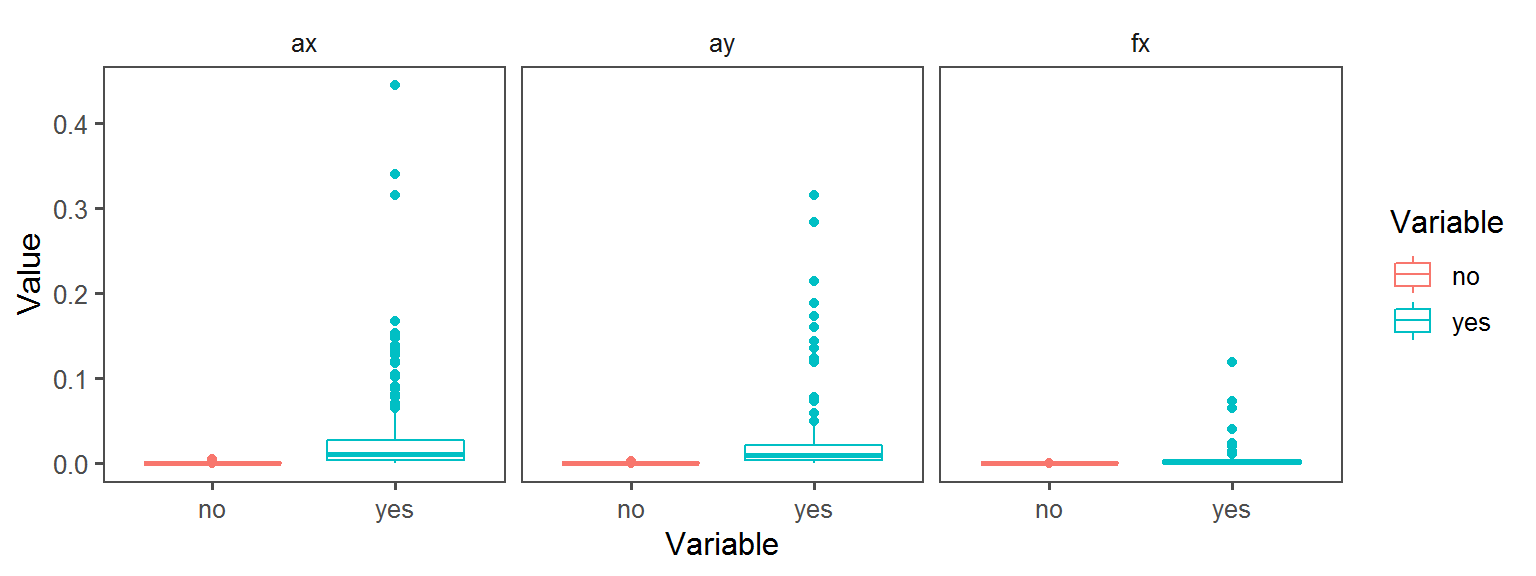
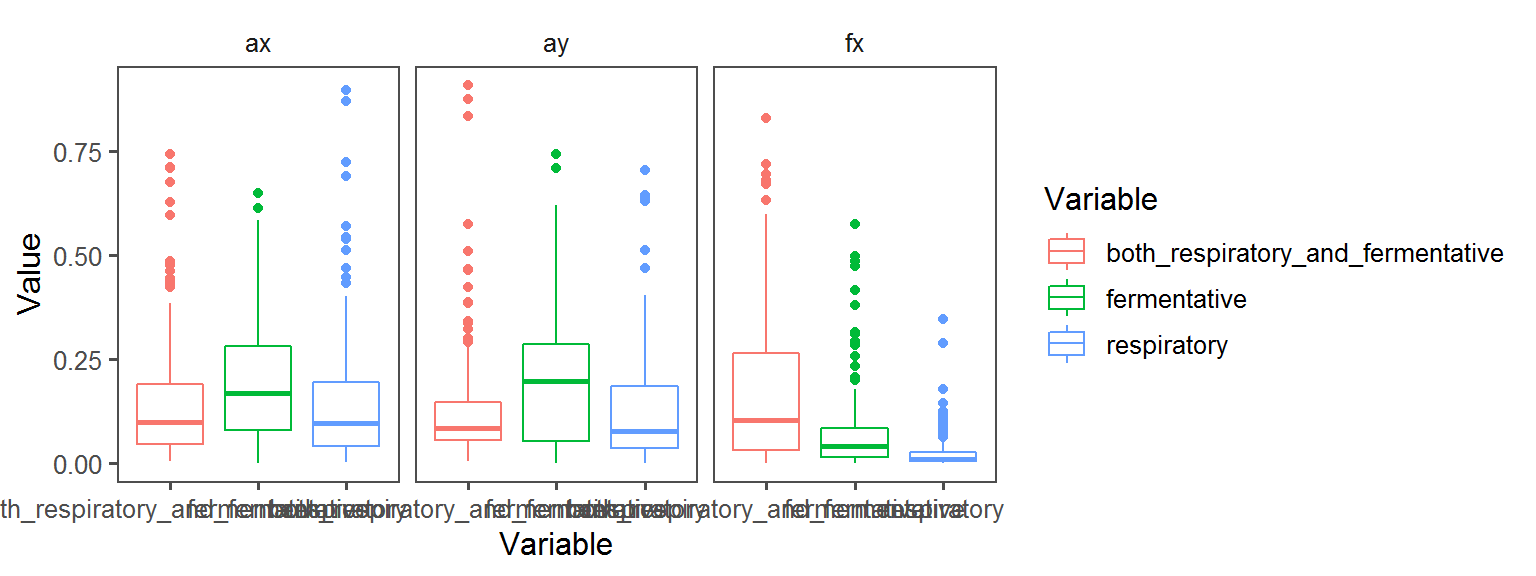
p2 <- ggplot(trait.dataframe %>% subset(Trait == t),
aes(Variable, Value, col = Variable)) + facet_wrap(.~Transect) + geom_boxplot() + theme_few()
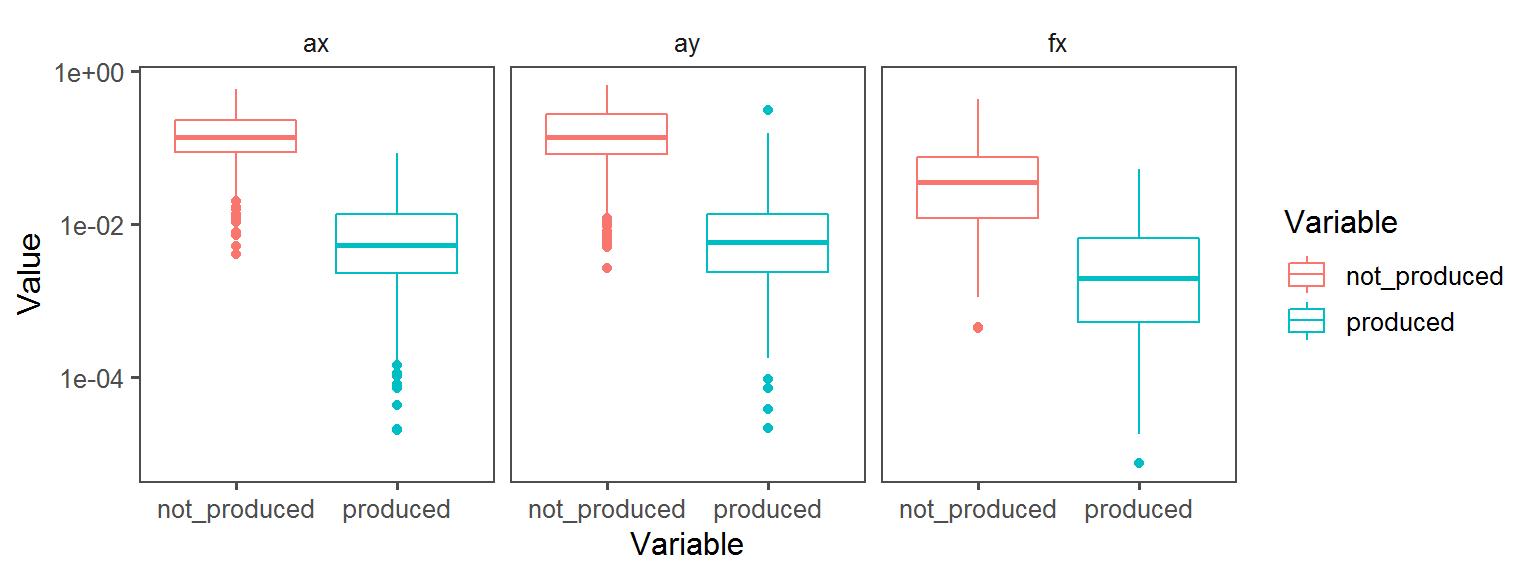
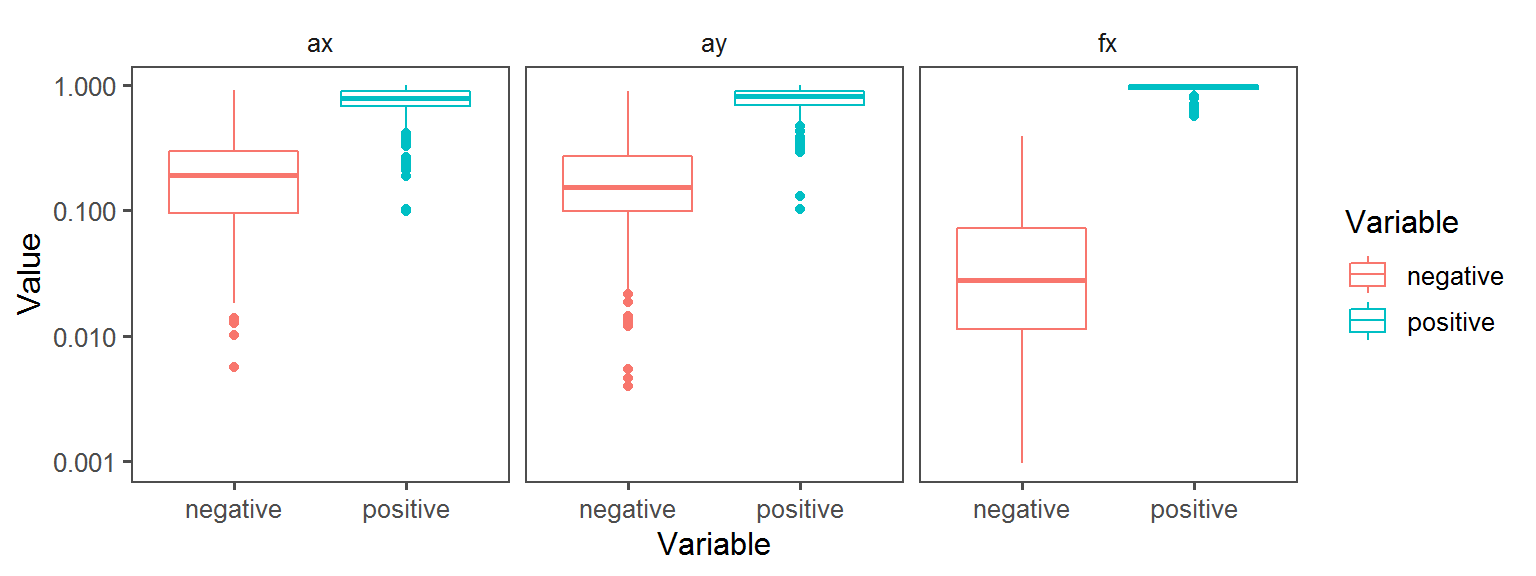
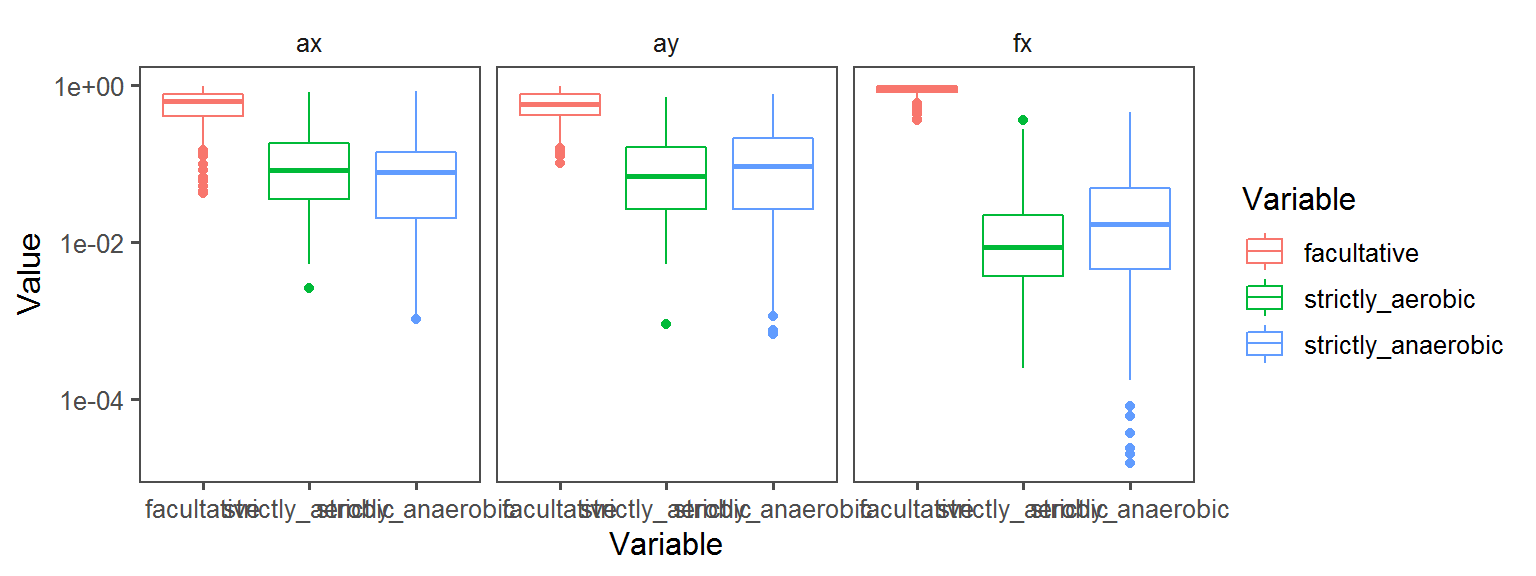
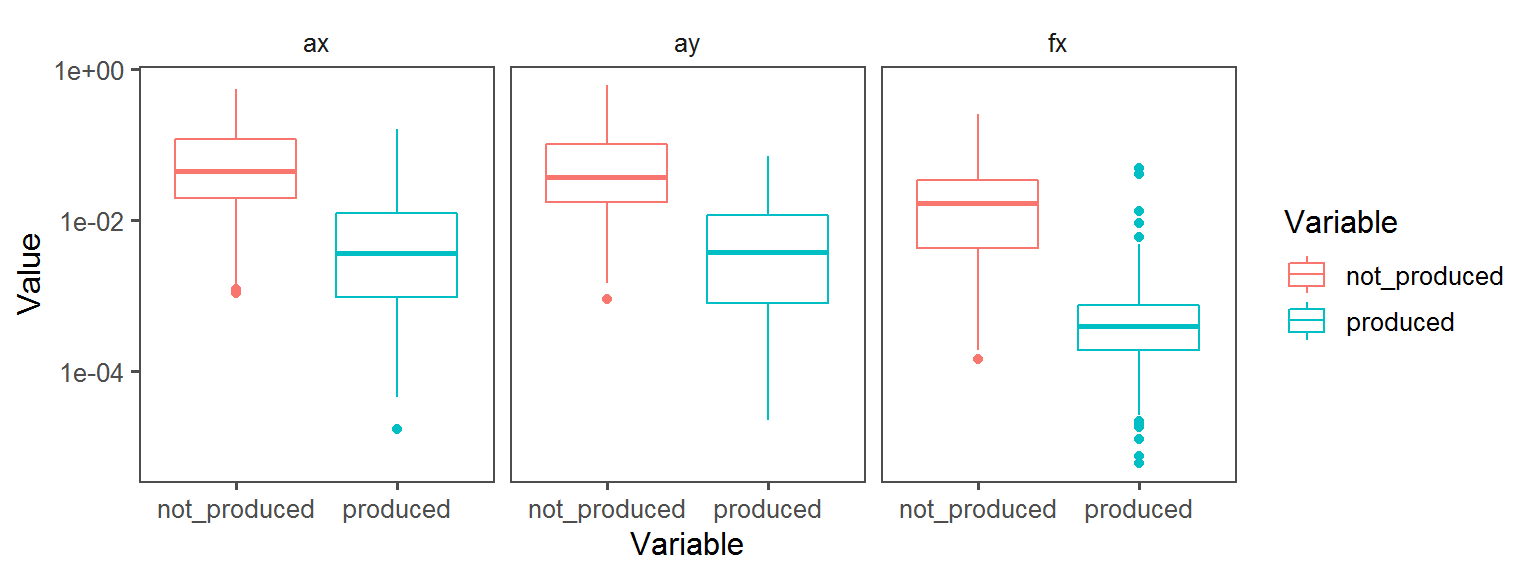
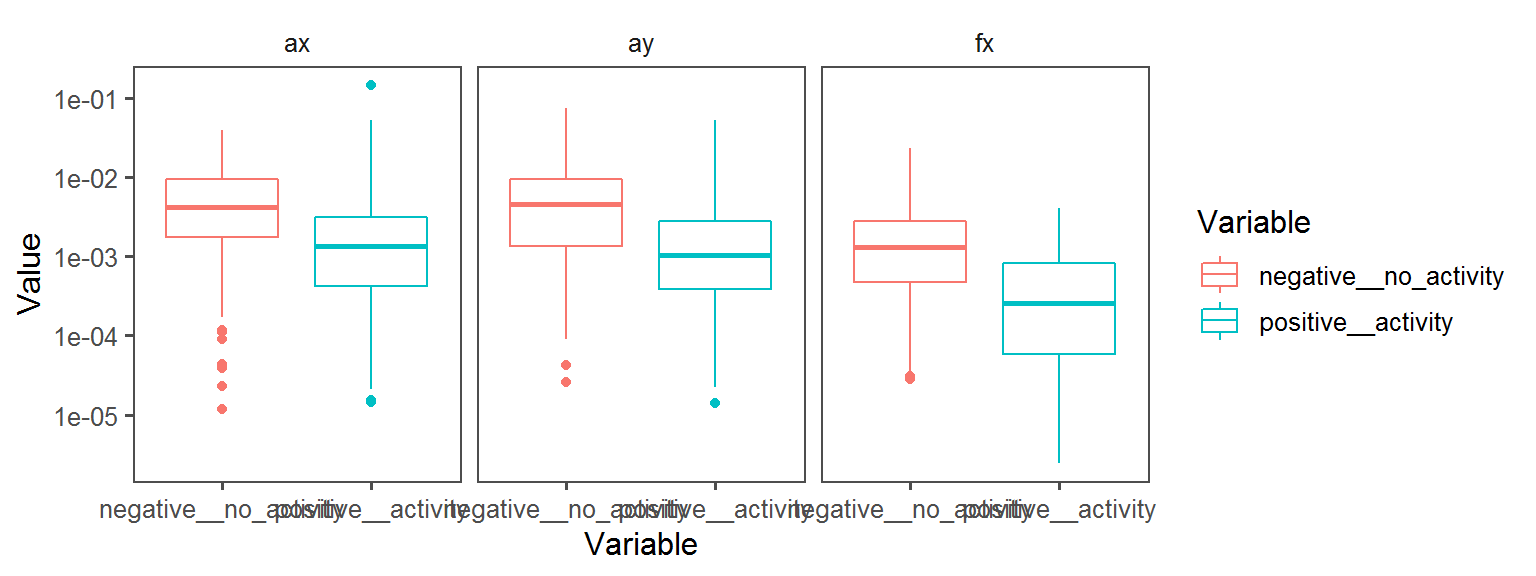
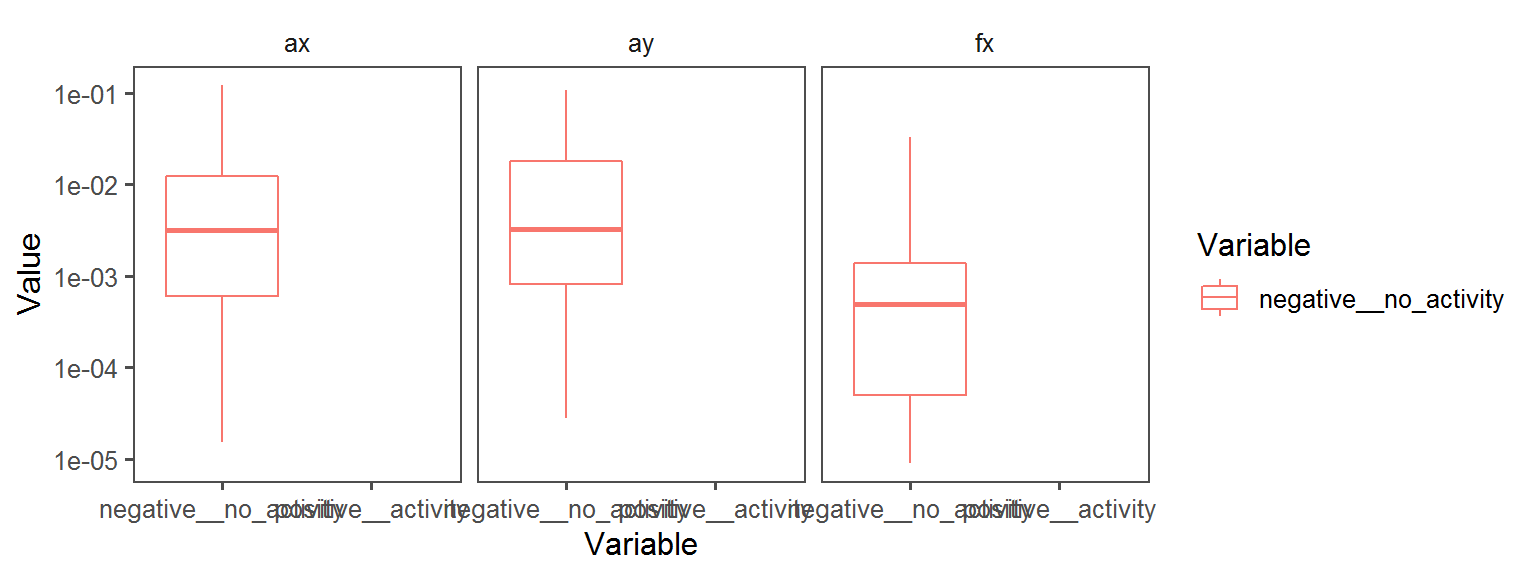
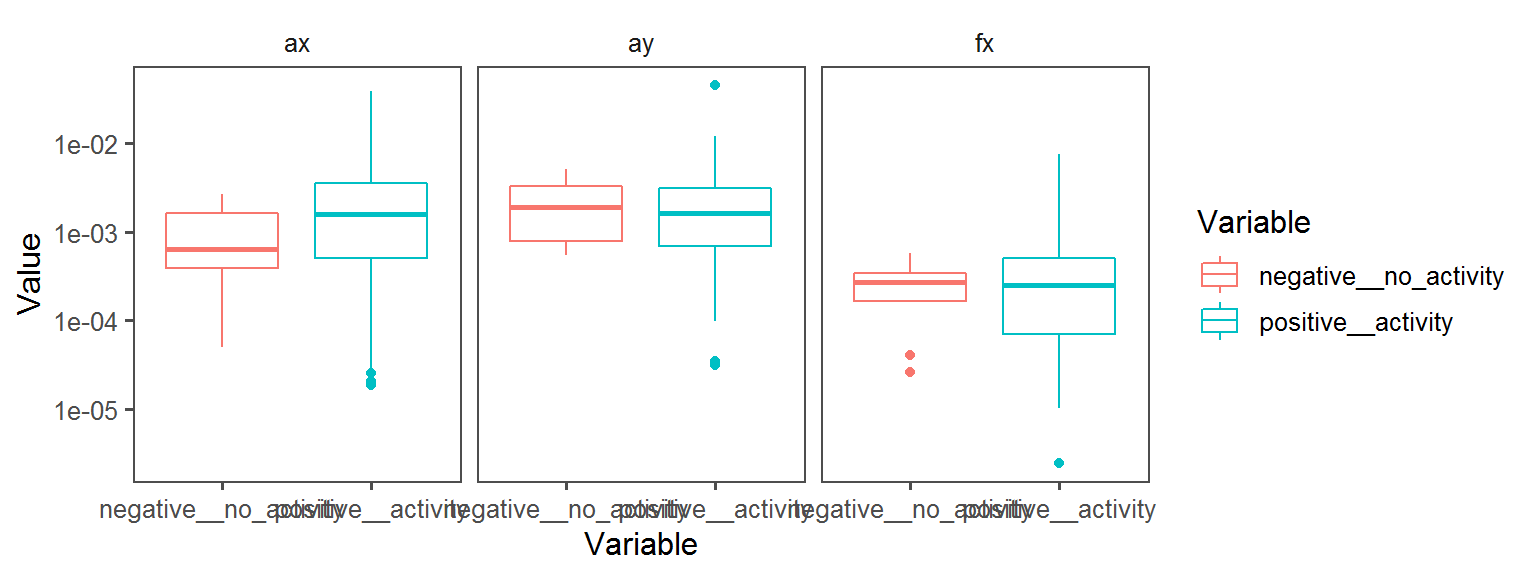
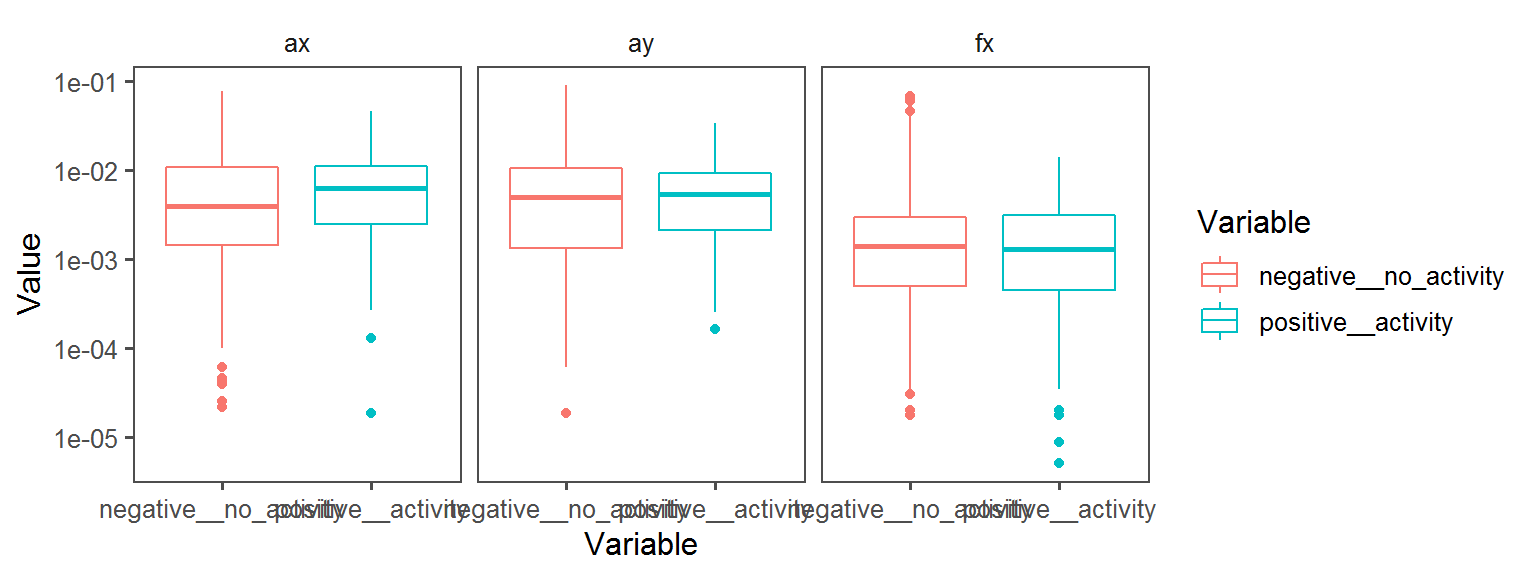
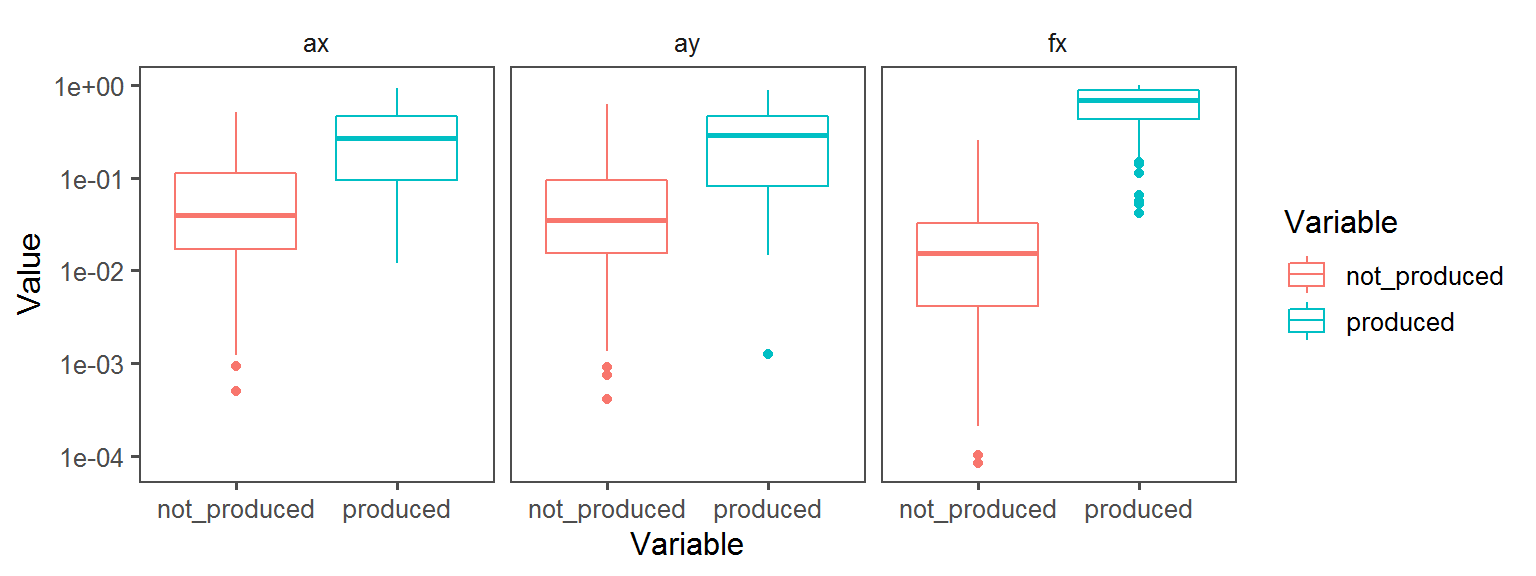
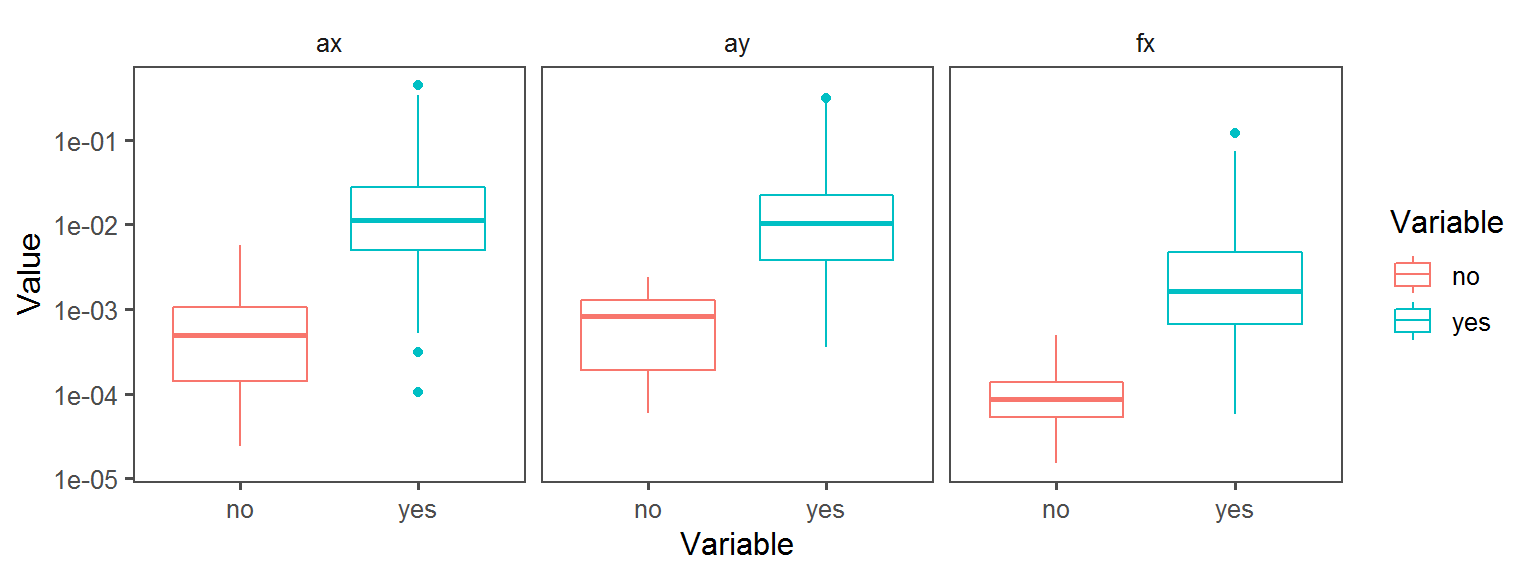
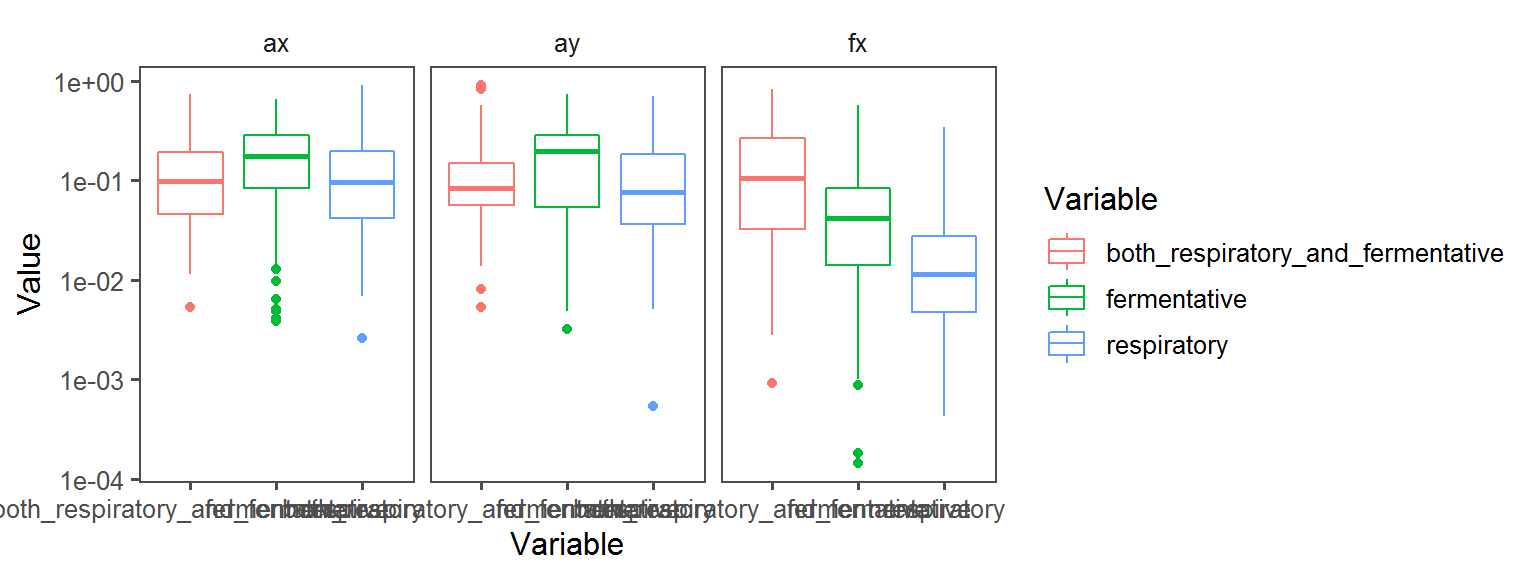
p3 <- ggplot(trait.dataframe %>% subset(Trait == t),
aes(Variable, Value, col = Variable)) + facet_wrap(.~Transect) + geom_boxplot() + theme_few() + scale_y_continuous(trans='log10')
print(p1)
print(p2)
print(p3)
cat("\r\r")
}Carbon_Source_General
Enzyme_Assays_alpha-galactosidase
Enzyme_Assays_trypsin
Volatile Gas_Production_indole
Gram_Status
Enzyme_Assays_gelatinase
Motility
Volatile Gas_Production_methane
Oxygen_Preference
Enzyme_Assays_pyrazinamidase
Enzyme_Assays_urease
Volatile Gas_Production_ammonia_NH3
Enzyme_Assays_beta-galactosidase
Energy_Source_General
General_Motility
Volatile Gas_Production_hydrogen_sulfide_H2S
Enzyme_Assays_arylsulfatase
Enzyme_Assays_catalase
Nitrogen_Cycle_nitrate_reduced_to_nitrite_nitrate_reduction
Enzyme_Assays_acid_phosphatase
Pigment_Production
Enzyme_Assays_esculin aesculin_hydrolysis
Enzyme_Assays_oxidase
Enzyme_Assays_alkaline_phosphatase
Volatile Gas_Production_isovaleric_acid
Nitrogen_Cycle_nitrogen_fixation
Metabolism_General
Spore Endospore_Formation
Nitrogen_Cycle_denitrification