|
|
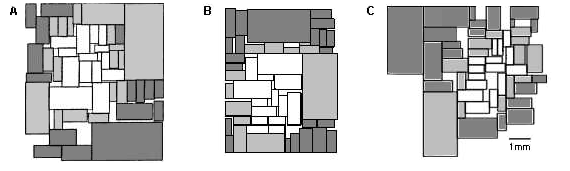
Fig. S7 . Integrated circuit networks for calibration of optimality analysis: AMI49 microchip, the largest of the MCNC set of benchmark circuits, with 49 modules.(6) (A) Esbensen and Kuh layout; cost to be minimized is a function of layout area and maximum path delay.(7) (B) Hong et al layout; cost to be minimized is a function of area and total wirelength.(8) (C) Lin and Chang layout; cost to be minimized is total wirelength.(9) In each case, the central 15 blocks (white), along with the surrounding edge-zone of immediately contiguous blocks (light gray), was analyzed. Again, placement of the interconnected areas is evaluated for how well total interconnection costs--adjacency rule violations--are minimized. Core and edge areas for Lin and Chang layout are listed in Table S4 connection matrix below.
Table S4. Combined connection and adjacency matrix for Lin and Chang layout of AMI49 microchip. The series of 15 core blocks shown above in Fig. S7C is listed (M014 - M020), in the order in which the areas are successively added to the analysis. They are followed by the set of 14 edge blocks for the total core (M030 - M032). (There are 103 connections among the core blocks and with the edge blocks.) A cell with 0 indicates no connection between the area of that row and of that column; 1 - 14 indicates connection density between the two areas. Cell values in bold designate topological contiguity of the two areas on the chip, as in Fig. S7C.
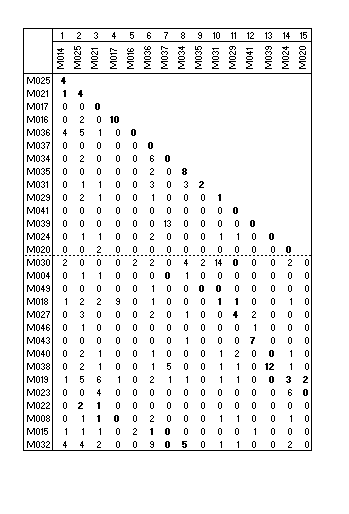

Fig. S8. Size Law for three layouts of AMI49 chip. In each case, the system of components is 15 contiguous central blocks as in Fig. S7; connections and adjacencies for Lin and Chang are as in Table S4. Optimality-measure is conformance of the system to the adjacency rule, with a layout scored in terms of number of violations of the "all or nothing" adjacency rule. A series of nested compact subsets of the set of blocks was generated, each consisting of from 4 to the full 15 areas. (For the Lin and Chang layout, order of successive elements added is as in Table S4.) Each subset of the actual layout was compared with all possible alternative layouts of that subset for adjacency-rule optimality (14 and 15-element sets were each compared only with random samples of 109 alternative layouts).
The curve for the Lin and Chang layout (C) shows the same Size Law pattern as the cortex networks earlier, although somewhat weaker; the full 15-component subset only attains an optimality-rank of 1.5 x 10⁻³. Both Esbensen and Kuh (A), and Hong et al (B), layouts do not show a Size Law pattern, nor does either attain significant optimality. So, for these calibration networks, adjacency rule conformance seems capable of distinguishing wirelength minimization from some other related cost-measures. Note that the analysis includes only 15 of the total system of 49 modules. (See also Fig. S1 above.)
Copyright Christopher Cherniak (2002)
Last Modified 11/19/2002