|
|
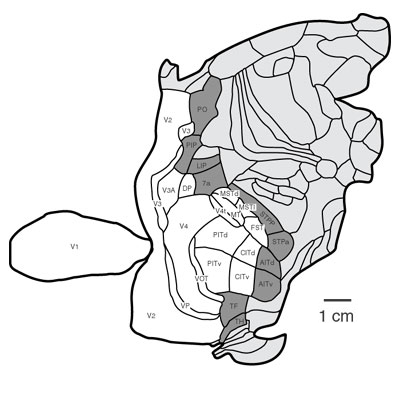
Fig. S2 . Parcellation of cerebral cortex of macaque. Connection-cost optimization analysis of layout of 17 core areas of the visual cortex (white), along with 10 immediately contiguous "edge" areas (dark gray): Placement of the interconnected functional areas is evaluated for how well total interconnection costs are minimized. 120 connections are reported among the core areas and with the edge areas. Core and edge areas are listed in Table S1 connection matrix below. Rostral is to right.(2)
Table S1 . Combined connection and adjacency matrix for macaque visual cortex. The series of 17 core visual areas shown above in Fig. S2 is listed (V1 - CITv), in the order in which the areas successively added to the analysis. They are followed by the set of 10 edge areas for the total core (PO - TH). Connections of an area to itself are excluded. A cell with 0 indicates no known connection between the area of that row and of that column; 1 indicates connection in one direction between the two areas; 2 indicates two-way connection. Cell values in bold designate topological contiguity of the two areas on the cortex sheet, as in Fig. S2.(3)
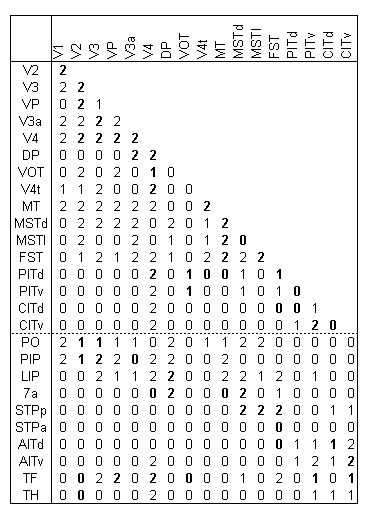
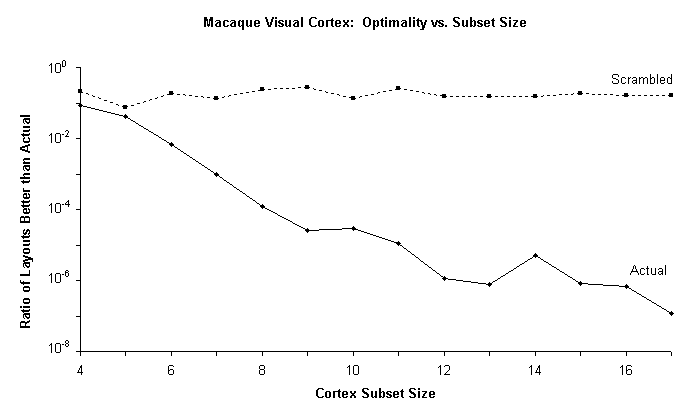
Fig. S3. Size Law for macaque visual cortex areas. The Size Law: If a set of connected components is optimally placed, then, the smaller a subset of that total layout, the less optimized it will tend to be. The system of components here is 17 contiguous macaque visual cortical areas as in Fig. S2, with connections and adjacencies as in Table S1. Optimality-measure is conformance of the system to the adjacency rule: If two components are connected, then they are adjacent to each other.(1) A layout is scored in terms of its number of violations of this "all or nothing" adjacency rule. A series of nested compact subsets of the set of cortical areas was generated, each consisting of from 4 to the full 17 areas. (Order of successive elements added is as in Table S1.) Each subset of the actual layout was compared with all possible alternative layouts of that subset for adjacency-rule optimality (16 and 17-element sets were each compared only with random samples of 109 alternative layouts).
The "Actual layout" curve shows that smaller subsets rank approximately in the middle of their group of alternative layouts. But, as subset size increases, optimality-ranking of the actual layout consistently improves (with two exceptions, p < 0.02). Fewer than one in a million of all alternative layouts conform to the adjacency rule better than the actual layout of the complete 17-component set. For comparison, the "Scrambled layout" broken-line curve shows the corresponding analysis for a layout of the 17 visual areas with their adjacencies randomly shuffled; no Size Law trend toward improving optimality is now evident. Note that this analysis includes only 17 of the total 73 cortical areas.
Copyright Christopher Cherniak (2002)
Last Modified 11/19/2002