|
|
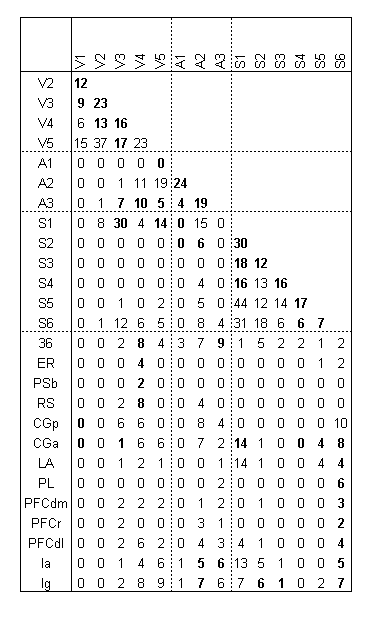
Table S3 . Combined connection and adjacency matrix for "metamodules" composed from areas of cat visual, auditory, and somatosensory cortex. The series of 14 metamodules, each constructed from the areas in Fig. S4 above, with connections and adjacencies from Table S2, is listed in the order in which the areas are successively added to the analysis. They are followed by the set of 13 edge areas for the total core. A cell with 0 indicates no known connection between the metamodule of that row and of that column; 1 - 44 indicates connection between the two metamodules. (Afferent and efferent connection weights of all areas in the two metamodules have been summed. A total 134 connections are included. Cell values in bold designate topological contiguity of the two metamodules on the cortex sheet, as in Fig. S4.
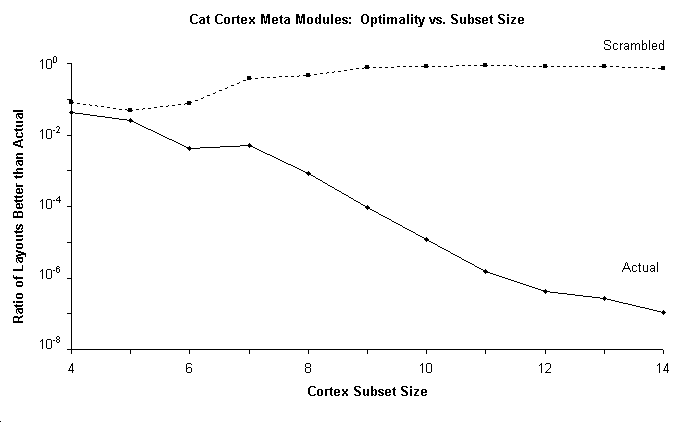
Fig. S6. Size Law for cat cortex "metamodules". If a set of connected components is optimally placed, then a set of metamodules each consisting of a subset of those components in the same positions will also be optimally placed. 40 Brodmann areas of the visual, auditory, and somatosensory regions of the cat cortex are grouped into 14 such modules, with connections and adjacencies as in Table S3. A series of nested subsets of those metamodules was then generated. The same Size Law trend of optimality improvement of the actual metamodule layout with increasing subset size is evident as for the actual layout of individual areas of the cat visual cortex: As subset size increases, optimality-ranking of actual layout consistently improves (with one exception, p < 0.02). (Exhaustive searches of all alternative layouts were performed.)
However, since 40 individual areas are now incorporated in these 14 metamodules, the Size Law furthermore implies that such a larger subset of the total 57-area cortical system should show better optimization than the 15-area visual subset. Such improvement is evident here: For example, by a subset size of 11 metamodules (consisting of 31 cortical areas), the actual layout's top ~10-6 rank exceeds the full 15-area visual system's rank; the full 14-metamodule actual layout ranks in the top 1.09 x 10⁻⁷ of all 14! possible alternative layouts--almost 100 times better than the full 15-area visual system. "Scrambled layout" broken-line curve shows corresponding analysis for a randomly shuffled layout of the meta-modules; no Size Law trend is evident.
Copyright Christopher Cherniak (2002)
Last Modified 11/19/2002