(click here for pdf versions of lectures)
Statistics is not physics …
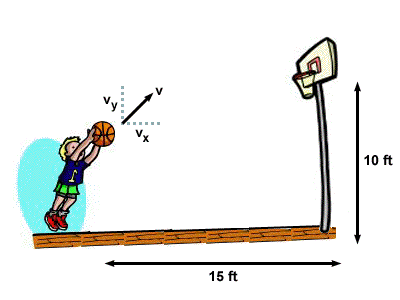
In physics, we take information and make predictions: 
With speed \(V\) and angle \(\theta\) and distance \(d\) and height \(h\), we can say “exactly” where the ball will go.
But that’s an easy problem!
The world is incredibly complex…
- There are very very few things in the world that we can describe with certainty,
- There are even fewer things that we can predict with certainty.
Real world problems …
- How do we describe the weather today?
- How do we describe the climate tomorrow / next year?
- How many polar bears are there today?
- How many will there be next year (given how the climate might change next year)?
- Does drug X cure disease Y?
- How will a government policy (e.g.~regarding drug X) affect society / the economy?
- What side will a flipped coin land on?
What about a coin flip?

what do you need to know to predict how a coin will land?
- angle
- strength
- speed
- fluctuations in air movement
- notches/kinks on the coin
- landing surface
- more …?


(from: Stochastic Modeling of Scientific Data, P. Guttorp and V. N. Minin)
Is it feasible to “predict” exactly?
No.
Is it feasible to ``predict’’ probabilistically?
Easy! 50% chance Heads - 50% chance Tails
This “random” result weirdly tells us just about everything we need to know about the very complex problem of the coin-flip.
Probability Theory is the science of understanding mathematical “randomness”.
Complex or Random?
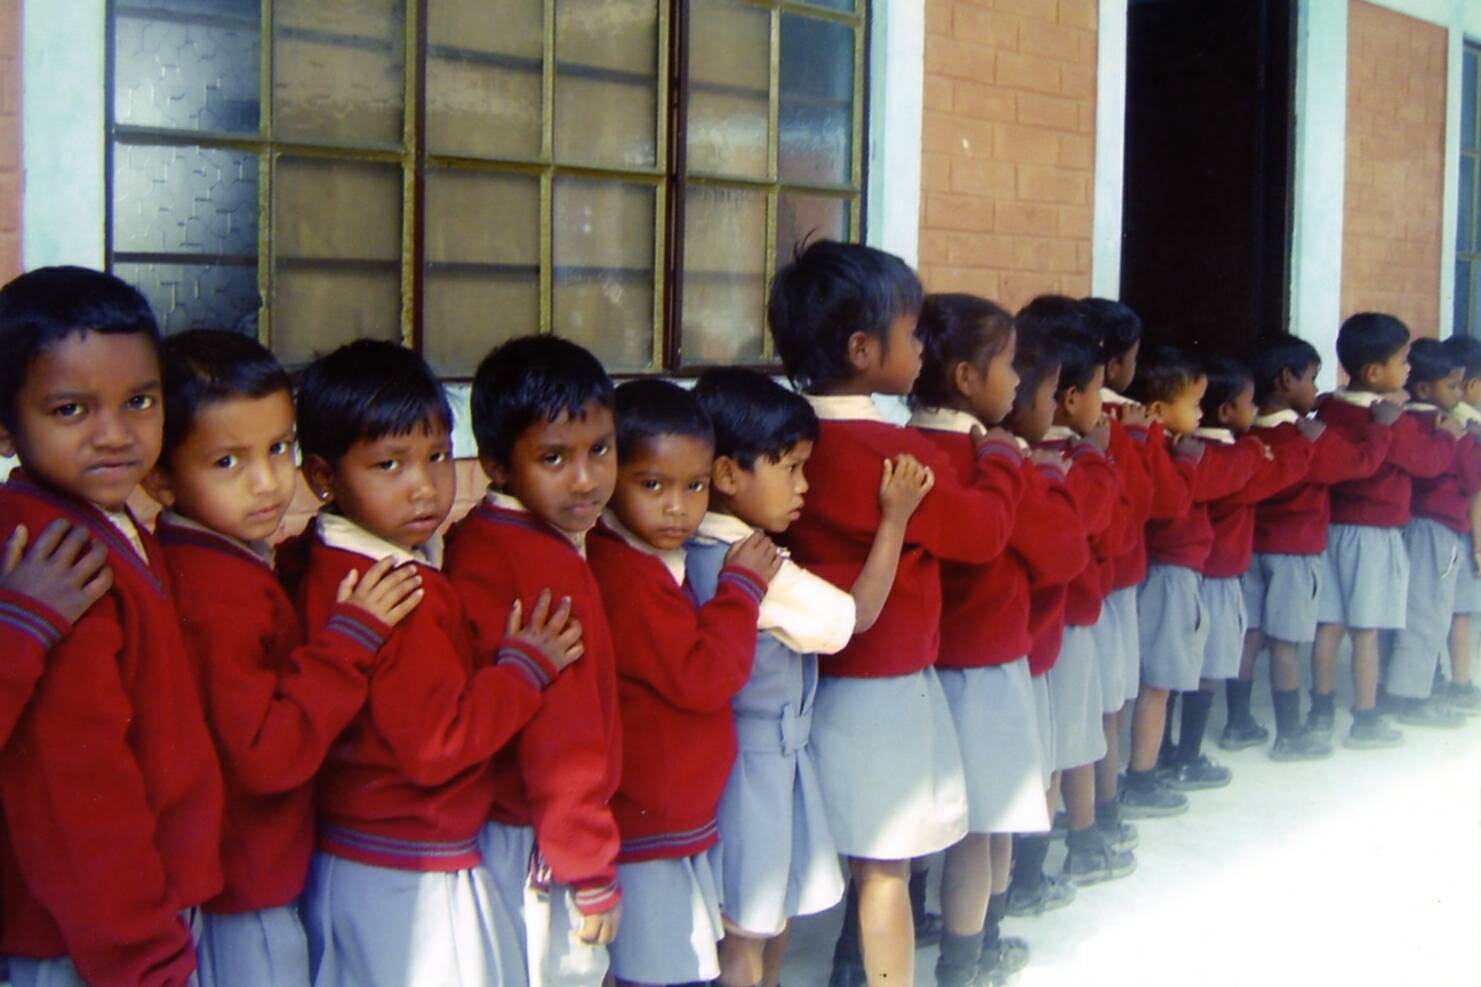
Pupils at Anshu Academy Nepal

Visualization
Distributions:

Relationships:

Relationships with factors:

Definitions
Proposed definition of statistics:
Statistics is the art of sweeping complexity under the rug of ** randomness** (not because we’re lazy, but because its not practical)
((ok, sometimes it’s because we’re lazy)).
Components of analysis
- The research question.
- A population is the collection of all possible individuals of interest.
- A sample is a subset of the population.
- An individual (or experimental unit) is an object on which observations are made.
- A variable is any quantity that can be measured on an individual. – A dependent or response variable the focus of our research question, or very closely linked to it — An independent variable or covariate or explanatory factor is an additional factor we consider for explaining the response
Example: Assessing health/growth of children
A question: How big are 2nd graders at Anshu County School in Nepal? - Population: The 2nd graders in Anshu County School. - Sample: The 2nd graders in Anshu County School. - Individual: A 2nd grader in Anshu County School. - Variable: Height, weight, - Covariate: Sex, age, etc…
More Definitions
Descriptive statistics are used to describe a population that had been completely sampled. Sample = Population
Example of inference
Question: What factors impact health of children in ``general’’?
- Population: All pupils in class? school? town? region? country? world?
- Sample: The pupils in the class.
- Individual: A child
- Variable: Height, weight,
- ** Covariate**: Age, income level, diet, size of family, …
This is a complex question! How do we best collect data? What’s the most we can learn from these data? How do we tease apart confounding effects in the variables? How do we even define some of these variables?
Inference:
is when you use knowledge gained about a to extrapolate (infer) something about a larger . \ Statistics that allow us to infer about greater populations are referred to as ** inference statistics}.\
Sample < Population
Broad outline of what we’ll learn in this course
- Descriptive statistics: visualizations and statistical summaries
- Probability theory: random processes and distributions
- Inference statistics: hypothesis testing, modeling, prediction
A statistical model:
\[Y = f(X | \theta)\]
- \(Y\) - response variable(s)
- \(X\) - explanatory variable(s)
- \(\theta\) - parameter(s)
- \(f(\cdot)\) - a (probabilistic) function
Inference
Specifying a model:
- What should \(f(\cdot)\) be?
Parameterizing / model-fitting}:
- Given \(Y_i\) and \(X_i\) (data), what is our best guess for \(\theta\)? (called \(\widehat{\theta}\))
Model selection:
- Which of available \(X\) do we need?
- Or, which of several possible \(f(\cdot)\) is best
For each these tasks, there are different more or less rigorous procedures - but in ALL cases - good judgement and reasoning are the MOST important step!
An important goal of this course is to learn how to apply “good judgement” and “good reasoning”. Statistics is NEVER just “plug and chug”!!
Prediction
Predictive statistics has a lot of overlap / equivalence with inference, but differs in its goals.
You DO NOT care about the model \(f(\cdot)\) - you DO NOT care about \(\widehat{\theta}\) - you ONLY care about the prediction: \[ \widehat{Y_j} = E(f(X_j, ...)) \] where \(f(\cdot)\) was obtained using a training subset \(X_i,Y_i\) and is predicted onto a validation subset \(X_j, Y_j\).
More specifically - you want to minimize: \[Y_j - \widehat{Y_j}\] using whatever algorithms you can - parameteric / non-parametric / supervised / unsupervised.
In practice (varieties of) REGRESSION are used most of all.