Prepping and Mapping the Data
Elie Gurarie
2017-03-24
Key packages
The important “in-house” packages from GitHub:
require(devtools)
install_github("EliGurarie/marcher")
install_github("ABoVE-AotM/above")
These require a bunch of other manipulation / visualization / spatial packages.
require(marcher)
require(above)
Processing data
There is some (rather extensive) moose data called moose, which was originally loaded from Movebank (with approprate permissions)
load("./data/Moose.rda")
is(Moose)
## [1] "MoveStack" ".MoveTrackStack"
## [3] ".MoveGeneral" ".OptionalMove"
## [5] ".MoveTrack" ".unUsedRecordsStack"
## [7] "SpatialPointsDataFrame" ".unUsedRecords"
## [9] "SpatialPoints" "Spatial"
## [11] "SpatialVector"This is a MoveStack object (from the move package). We prefer working with somewhat simplified data frames, for which there is a useful function in our “above” package. Here, we also obtain the daily mean of all the moose.
Moose.df <- processMovedata(Moose, dailymean = TRUE)head(Moose.df)## id day day.date time lon lat
## 1 209894749 294 2011-10-22 12:00:00 2011-10-22 20:10:42 -147.7037 64.61922
## 2 209894749 295 2011-10-23 12:00:00 2011-10-23 11:20:40 -147.7047 64.61502
## 3 209894749 296 2011-10-24 12:00:00 2011-10-24 11:10:52 -147.6916 64.62130
## 4 209894749 297 2011-10-25 12:00:00 2011-10-25 11:00:51 -147.6855 64.62865
## 5 209894749 298 2011-10-26 12:00:00 2011-10-26 12:41:06 -147.6885 64.62742
## 6 209894749 299 2011-10-27 12:00:00 2011-10-27 12:30:57 -147.6922 64.62773
## x y
## 1 -2198775 3652365
## 2 -2199136 3652071
## 3 -2198210 3652122
## 4 -2197431 3652488
## 5 -2197627 3652493
## 6 -2197728 3652643This is a simplified data frame of class “track”, with some additional metadata information, which is outputted by the summary method that gives basic useful information on each track. Because the ID’s are long and awkward, we also use the assignNicknames which just gives an easy code to the ID’s:
Moose.df <- assignNicknames(Moose.df, "M")
summary(Moose.df)
## study: NA
## projection: +proj=lcc +lat_1=50 +lat_2=70 +lat_0=40 +lon_0=-96 +x_0=0 +y_0=0 +ellps=GRS80 +datum=NAD83 +units=m +no_defs
## dateDownloaded: 2017-02-23 00:48:13
## citation: NA
## license: NA
## dailymean: TRUE## id n start duration dt.median
## 1 209894749 1471 2011-10-22 20:10:42 1714 days 27.99 hours
## 2 209894767 1429 2011-10-22 20:33:01 1721 days 28.92 hours
## 3 209894771 1401 2011-10-21 09:24:40 1723 days 29.53 hours
## 4 209894775 1357 2011-10-20 22:40:45 1723 days 30.50 hours
## 5 209894779 1387 2011-10-19 13:50:52 1724 days 29.85 hours
## 6 209894783 1290 2011-10-20 21:51:22 1716 days 31.95 hours
## 7 209894787 1482 2011-10-19 12:00:58 1719 days 27.86 hours
## 8 209894791 1098 2011-10-19 12:00:45 1440 days 31.50 hours
## 9 209894795 1597 2011-10-19 13:50:37 1724 days 25.92 hours
## 10 209894799 1583 2011-10-22 09:35:28 1720 days 26.09 hours
## 11 209894803 1094 2011-10-19 12:00:35 1722 days 37.80 hours
## 12 209894807 1544 2011-10-19 15:40:47 1724 days 26.81 hours
## 13 209894811 1335 2011-10-22 08:47:26 1721 days 30.97 hours
## 14 209894815 1464 2011-10-21 23:35:53 1722 days 28.25 hours
## 15 209894819 1467 2011-10-21 21:58:44 1721 days 28.18 hours
## 16 209894823 1614 2011-10-22 08:11:10 1722 days 25.62 hours
## 17 209894828 1409 2011-10-21 23:04:43 1715 days 29.23 hours
## 18 209894836 1445 2011-10-22 09:09:45 1720 days 28.59 hours
## 19 209894844 110 2011-10-21 21:42:33 109 days 23.91 hours
## 20 209894852 1084 2011-10-21 20:51:04 1705 days 37.77 hours
## 21 209894861 594 2011-10-21 21:12:55 593 days 23.98 hours
## 22 209894873 1568 2011-10-19 13:50:50 1723 days 26.39 hours
## 23 209894884 1489 2011-10-22 19:05:10 1721 days 27.75 hours
## 24 209894892 1365 2011-10-21 09:59:40 1717 days 30.21 hours
## 25 209894903 1465 2011-10-20 23:28:29 1721 days 28.22 hours
## 26 209894916 1514 2011-10-19 12:00:48 1722 days 27.31 hours
## 27 209894928 1464 2011-10-19 12:00:51 1725 days 28.29 hours
## 28 209894944 1532 2011-10-21 11:40:49 1722 days 26.99 hours
## 29 209894956 386 2011-10-21 09:39:46 385 days 24.01 hours
## 30 209894964 1287 2011-10-19 13:51:02 1723 days 32.15 hours
## 31 209894972 1247 2011-10-21 11:40:51 1710 days 32.94 hours
## 32 209894983 1231 2011-10-21 09:34:08 1722 days 33.59 hours
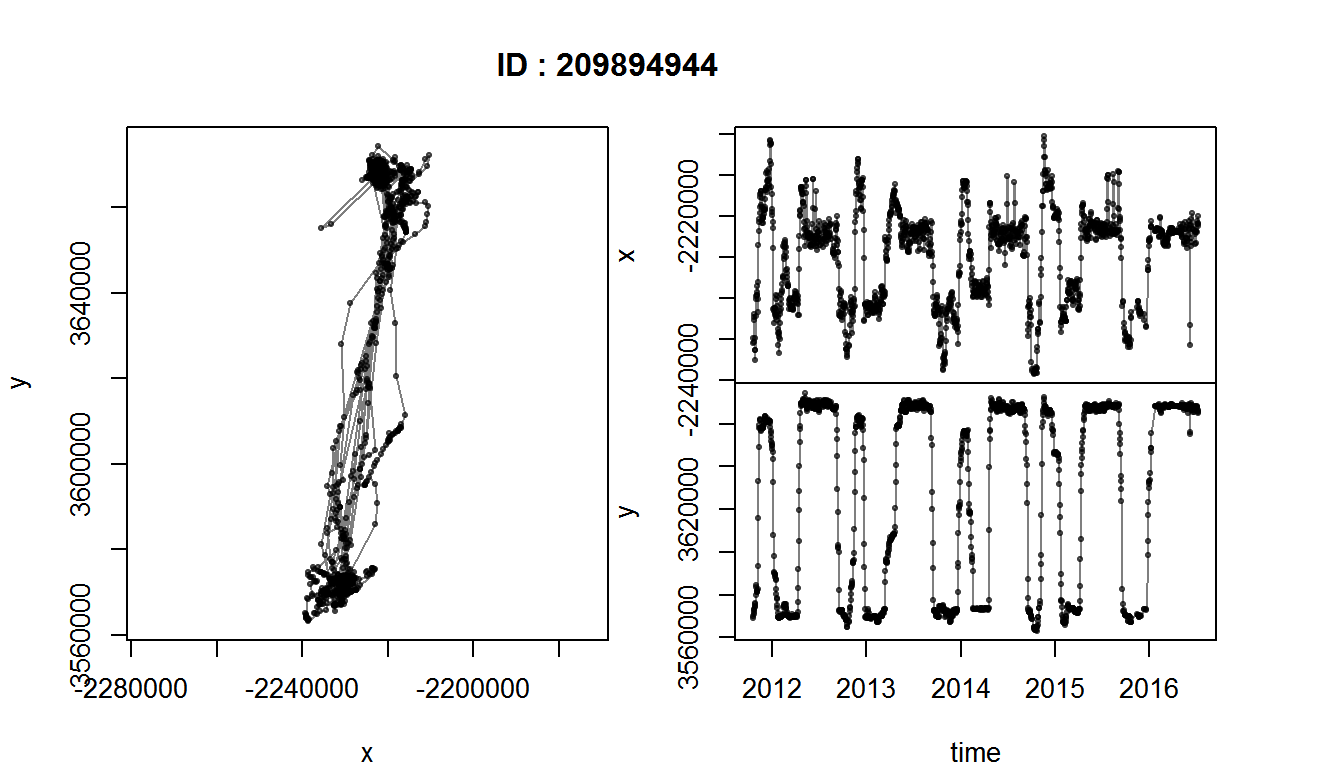
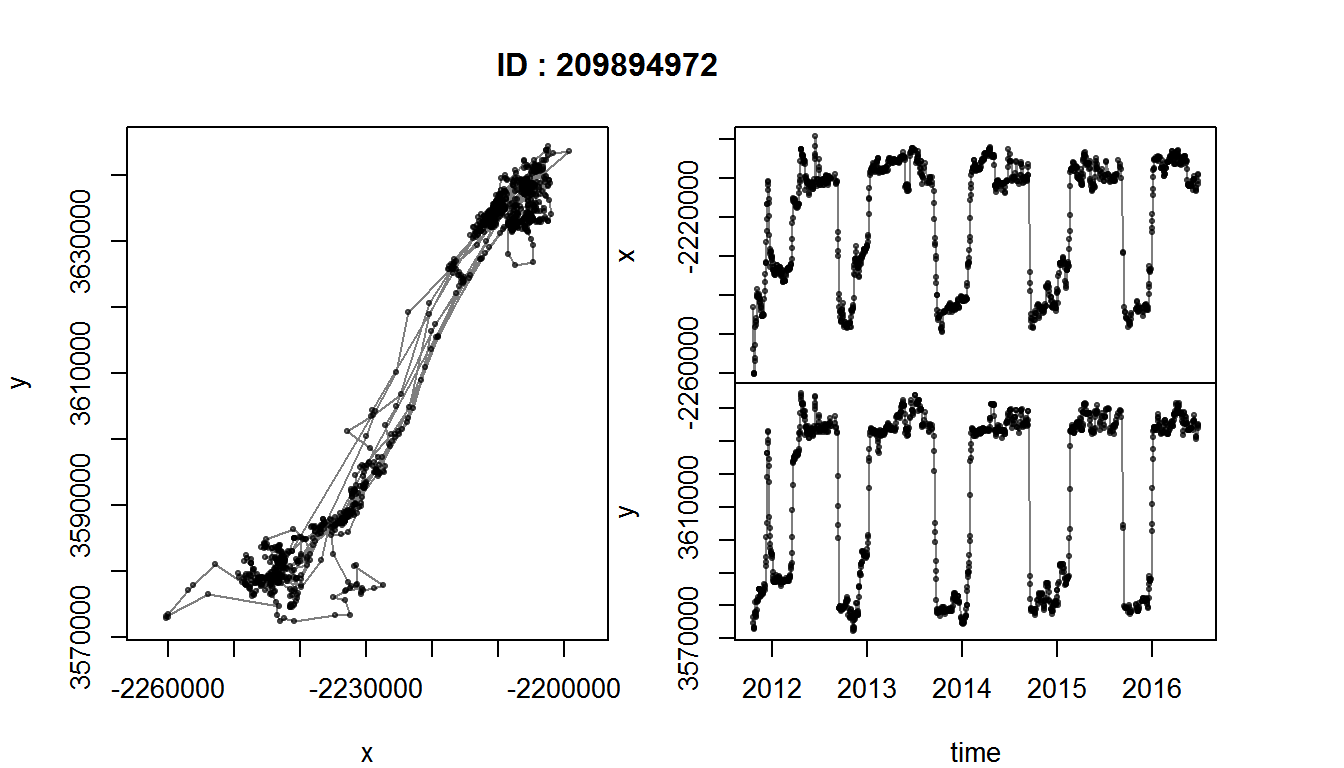
## 33 209894988 392 2011-10-21 08:28:14 391 days 24.01 hoursPlotting some migrants
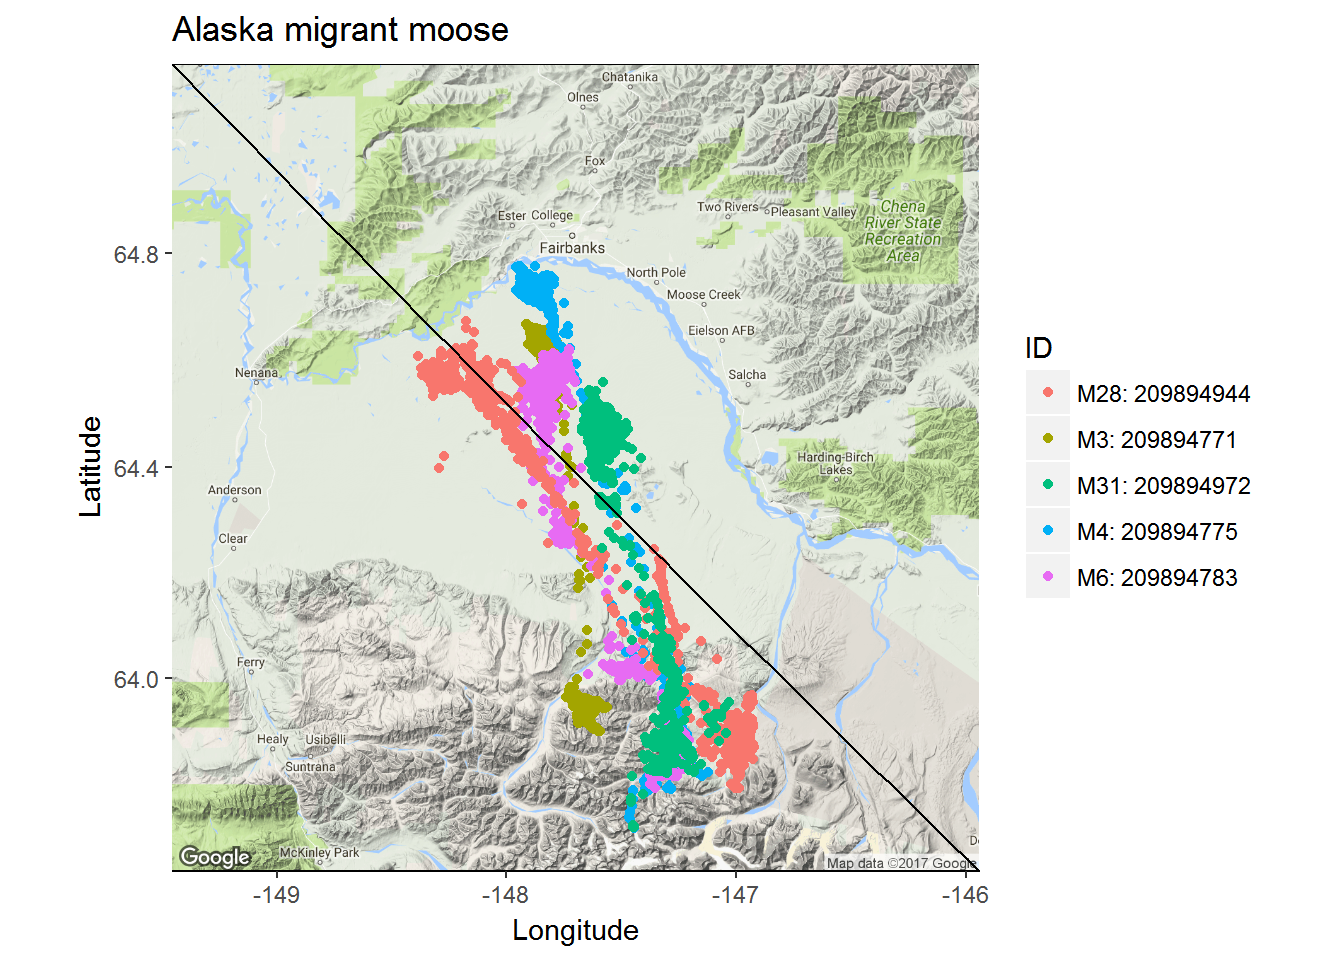
Five of these moose are good migrants, we focus on them:
Moose.migrants <- subset(Moose.df, nickname %in% c("M3","M4","M6","M28","M31"))Here are their plots:
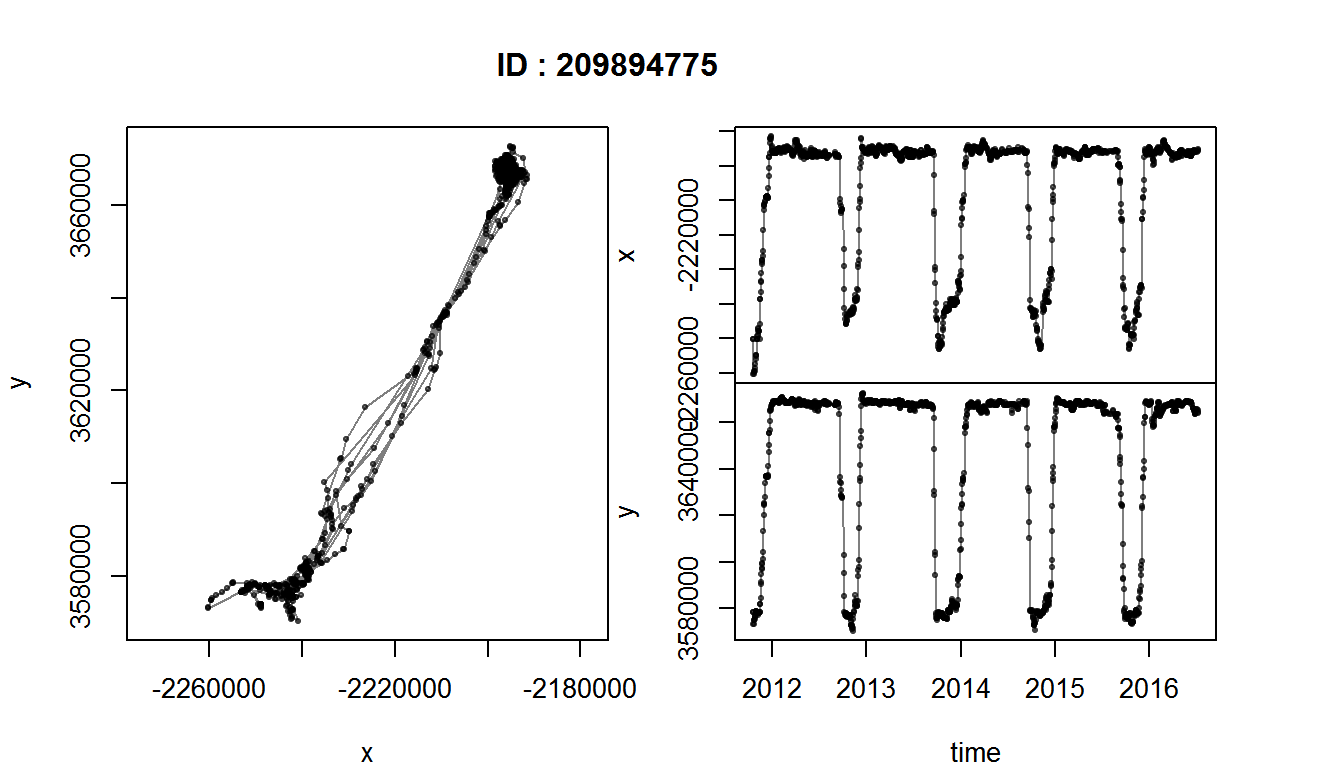
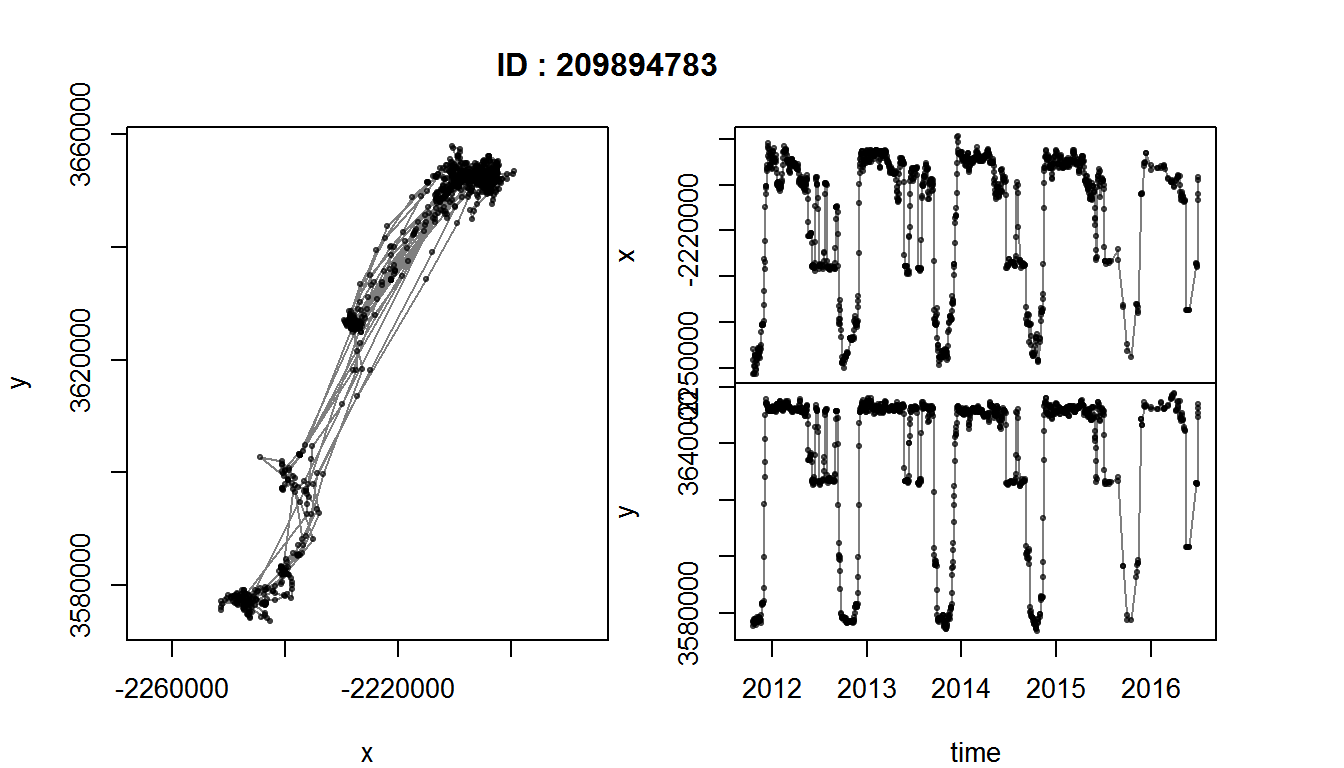
for(nn in unique(Moose.migrants$nickname))
  plot(subset(Moose.migrants, nickname == nn))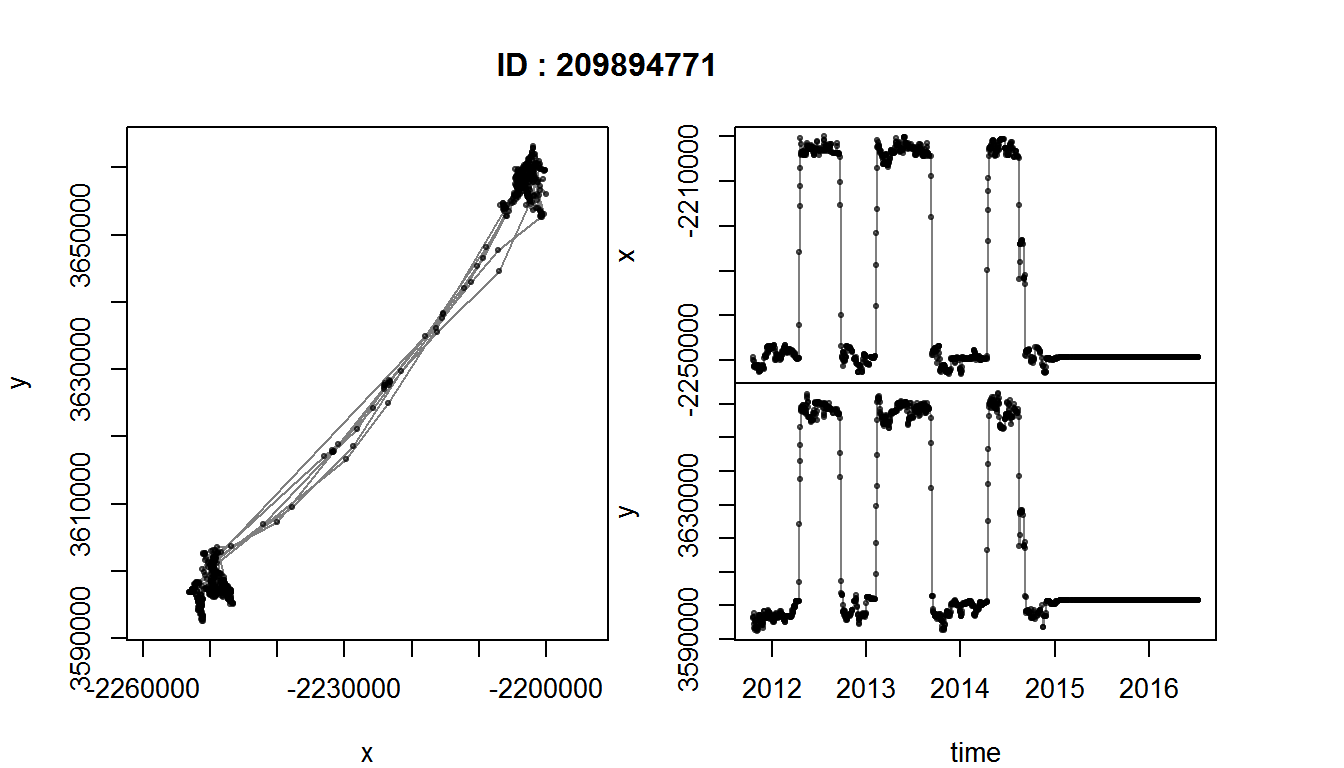
And a map of their location:
basemap <- get_map(location = c(-147.7, 64.4),
                      maptype = "terrain", source="google", zoom = 8)
## Map from URL : http://maps.googleapis.com/maps/api/staticmap?center=64.4,-147.7&zoom=8&size=640x640&scale=2&maptype=terrain&language=en-EN&sensor=false## the actual mapping command -
ggmap(basemap) +
geom_point(data = Moose.migrants,
mapping = aes(x = lon, y = lat, col=paste(nickname, id, sep = ": "))) +
geom_path() + coord_map() + labs(x = "Longitude", y = "Latitude", color = "ID", title = "Alaska migrant moose")