The spectroscopic analysis of mixtures, when the spectra of the
components overlap considerably, can be performed using special
calibration methods based on a type of linear least-squares called multiple
linear regression. This method is widely used in
multi-wavelength instruments such as diode-array, Fourier transform,
and digitally-controlled scanning spectrometers (because perfect
wavelength reproducibility is a key requirement). To understand the
required math, it's helpful to do a little basic matrix
algebra (a.k.a., linear algebra), which is just a shorthand
notation for dealing with signals expressed as equations with one
term for each point. Because that area of math may not be a part of
everyone's math background, I'll actually do some elementary matrix
math derivations in this section, a departure from my usual
orientation.
Definitions:
n = number of distinct chemical components in the mixture
s = number of samples
s1, s2 = sample 1, sample 2, etc.
c = molar concentration
c1, c2 = component 1, component 2, etc.
w = number of wavelengths at which signal is measured
w1, w2 = wavelength 1, wavelength 2, etc.
Ɛ = analytical
sensitivity (slope of a plot of A vs c)
A = analytical signal
MT = matrix
transpose of matrix M (rows and columns switched).
M-1 = matrix
inverse of matrix M.
Assumptions:
The analytical signal, A (such as
absorbance in absorption spectroscopy, fluorescence intensity
in fluorescence spectroscopy, and reflectance in reflectance
spectroscopy) is directly proportional to concentration, c. The
proportionality constant, which is the slope of a plot of A vs
c, is Ɛ.
A = Ɛc
The total signal is the sum of the signals for
each component in a mixture:
Atotal
= Ac1 +
Ac2 +
... for all n components.
Classical
Least Squares (CLS) calibration, also called the "K-matrix"
method.
This method is applicable
to the quantitative analysis of a mixture of components when the
spectra of the individual components
are known and where total
signal of the mixture is the sum of the signals for each
component in the mixture. Measurement of the spectra of
known concentrations of the separate components
allows their analytical sensitivity Ɛ
at each wavelength to be determined. Then it follows that:
Aw1=Ɛc1,w1 cc1 + Ɛc2,w1 cc2 + Ɛc3,w1cc3 + ... for all n components.
Aw2=Ɛc1,w2cc1 + Ɛc2,w2cc2 + Ɛc3,w2cc3+ ...
and so on for all
wavelengths - w3, w4, etc.
It's messy to write out all these individual terms, especially
because there may be hundreds of wavelengths in modern
array-detector spectrometers. But despite the mass of raw data,
these are just really nothing more than linear equations and so
the calculations required here are actually pretty simple and
certainly very easy for a computer to do. So we really need
a correspondingly simple notation that's more compact. To
do this, we use bold-face letters to represent a vector
(like a column or row of numbers in a spreadsheet) or a matrix
(like a block of numbers in a spreadsheet). For example, A
could represent the list of absorbances at each wavelength in
a absorption spectrum. So this big set of linear
equations can be written:
A = ƐC
where A
is the w-length vector of measured signals (i.e. the
signal spectrum) of the mixture, Ɛis the n x w rectangular matrix of
the known Ɛ-values
for each of the ncomponents at each of the w wavelengths,
and C is the n-length vector of concentrations of
all the components.
ƐC
means that Ɛ"pre-multiplies"
C; that is, each column of Ɛis
multiplied point-by-point by the vector C.
If you have a sample solution containing unknown amounts of components those n
components, you measure its spectrum A and seek to
calculate the concentration vector of concentrations C. In
order to solve the above matrix equation for C, the number
of wavelengths w must be equal to or greater than the
number of components
n.
If w = n, then we have a system of n
equations in n unknowns which can be solved by
pre-multiplying both sides of the equation by Ɛ-1,
the matrix
inverse of Ɛ,
and using the property that any matrix times its inverse is unity:
C = Ɛ-1A
Because real
experimental spectra are subject to random noise (e.g. photon
noise and detector noise), the solution will be more precise if
the signals at a larger number of wavelengths are used, i.e. if w > n. This is easily done with no
increase in labor by using a modern array-detector
spectrophotometer. But then the equation can not be solved by
simple matrix inversion, because theƐ
matrix is a w x n matrix and a matrix
inverse exists only for square matrices. However, a solution can be obtained in this
case by pre-multiplying both sides of the equation by the
expression (ƐTƐ)-1ƐT:
(ƐTƐ)-1ƐTA = (ƐTƐ)-1ƐTƐC
= (ƐTƐ)-1(ƐTƐ)C
where ƐT is the
transpose of Ɛ
(rows and columns switched). But the quantity (ƐTƐ)-1(ƐTƐ) is a matrix times its
inverse and is therefore unity. Thus:
C= (ƐTƐ)-1ƐTA
This is called the "normal
equation". In this expression, ƐTƐ is a square matrix of order
n, the number of components.
In most practical applications, n is relatively small, typically only
2 to 5. That is not a very big matrix to invert, no matter how
many wavelengths are used. In general, the more wavelengths are
used, the more effectively the random noise will be averaged out
(although it won't help to use wavelengths in spectral regions
where none of the components produce analytical signals). The
determination of the optimum wavelength region must usually be
determined empirically. All components that contribute to the
spectrum must be accounted for and included in the Ɛmatrix.
Three extensions
of the CLS method are commonly made:
(a) If you
have s multiple unknown samples to measure, you can
compute them all at once using the same notation as above, by
combining their spectra into a wx s matrixA, which will
result in an n x
s matrix C. (This is applied
in Appendix
AD: "Spectroscopy
and chromatography combined: time-resolved Classical Least
Squares").
(b) In order to account
for flat baseline shift caused by drift, background, and light
scattering, a column of 1s is added to the Ɛ matrix. This has the effect
of introducing into the solution an additional component with a
flat spectrum; this is referred to as "background correction".
(c) In order to account
for the fact that the precision of measurement may vary with
wavelength, it is common to perform a weighted least squares solution that
de-emphasizes wavelength regions where precision is poor:
C= (ƐTƐ-1Ɛ)-1ƐTV-1 A
where V is a wxw
diagonal matrix of variances at each wavelength. In
absorption spectroscopy, where the precision of measurement is
poor in spectral regions where the absorbance is very high (and
the light level and signal-to-noise ratio therefore low), it is
common to use the transmittance T or its square T2 as
weighting factors.
The method is in principle applicable to any number of overlapping
components. Its accuracy is limited by how accurately the spectra of
the individual components are known, the amount of noise in the
signal, the extent of overlap of the spectra, and the linearity of
the analytical curves of each component (the extent to which the
signal amplitudes are proportional to concentration). In
practice, the method does not work well with old-style instruments
with manual wavelength control, because of insufficient wavelength
reproducibility. Specifically, many measurements are made on the sides
of spectral bands, where even small failures in the
reproducibility of wavelength settings between measurements would
result in large intensity changes. But it works well with
automated computer-controlled scanning instruments, and is perfectly
suited to diode-array
and Fourier transform instruments, which have extremely good wavelength
reproducibility. The method also depends on the
linearity of analytical signal with respect to concentration. The
well-known deviations
from analytical curve linearity in absorption
spectrophotometry set a limit to the performance to this method (and
which can be avoided by applying curve
fitting and Fourier convolution
to the transmission spectra. That idea will be developed later in
this essay). Inverse Least Squares (ILS)
calibration.
ILS is a method that can
be used to measure the concentration of an analyte in samples in
which the spectrum of the analyte in the sample is not known
beforehand. Whereas the classical least squares method models the
signal at each wavelength as the sum of the concentrations of the
analyte times the analytical sensitivity, the inverse least
squares methods use the reverse approach and models the analyte
concentration c in each sample as the sum of the signals A at each
wavelength times calibration coefficients m that express how the
concentration of that component is
related to the signal at each wavelength:
cs1 = mw1As1,w1 + mw2As1,w2+ mw3As1,w3+ ... for all w wavelengths.
cs2 = mw1As2,w1 + mw2As2,w2 + mw3As2,w3 + ...
and so on for all s samples. In matrix
form
C = AM
where C is the s-length
vector of concentrations of the analyte in the s samples,
A is the w x s
matrix of measured signals at the w wavelengths in the s
samples, and M is the w-length vector of
calibration coefficients.
Now, suppose that you have a set of standard samples that
are typical of the type of sample that you wish to be able to
measure and which contain a range of analyte concentrations that
span the range of concentrations expected to be found in other
samples of that type. This will serve as the calibration set. You
measure the spectrum of each of the samples in this calibration set
and put these data into a wxs matrix of
measured signals A. You then measure the analyte
concentrations in each of the samples by some reliable and
independent analytical method and put those data into a s-length
vector of concentrations C. Together these data allow you
to calculate the calibration vector M by solving the above
equation. If the number of samples in the calibration set is greater
than the number of wavelengths, the least-squares solution is:
M = (ATA)-1ATC
(Note that ATA is a square matrix of size
w, the number of
wavelengths, which must be less than s). This calibration vector can be used to
compute the analyte concentrations of other samples, which are
similar to but not in the calibration set, from the measured
spectra of the samples:
C = AM
Clearly this will work well only if the analytical samples are
similar to the calibration set. The advantage of this method is that
the spectrum of an unknown sample can be measured much more quickly
and cheaply than the more laborious standard reference methods that
are used to measure the calibration set, but as long as the unknowns
are similar enough to the calibration set, the concentrations
calculated by the above equation will be accurate enough for many
purposes.
Spreadsheets
Most modern spreadsheets have basic matrix manipulation capabilities
and can be used for multicomponent calibration, for example Excel
and OpenOffice
Calc. The spreadsheets RegressionDemo.xlsandRegressionDemo.ods(for Excel and Calc, respectively) demonstrate the classical least squares
procedure for a simulated spectrum of a 5-component mixture
measured at 100 wavelengths. A screen shot is shown below. The
matrix calculations described above that solves for the
concentration of the components on the unknown mixture:
C= (ƐTƐ)-1ƐTA
are performed in these spreadsheets by
the TRANSPOSE (matrix transpose), MMULT (matrix multiplication),
and MINVERSE (matrix inverse) array functions, laid out
step-by-step in rows 123 to
158 of this spreadsheet. Alternatively, all these array
operations may be combined into one big scary cell equation:
C= MMULT (MMULT (MINVERSE (MMULT
(TRANSPOSE (E);E)); TRANSPOSE (E));A)
where C is the vector of the 5
concentrations of all the components in the mixture, E is the 5 x
100 rectangular matrix of the known sensitivities (e.g.
absorptivities) for each of the 5 components at
each of the 100 wavelengths, and A is the vector of measured
signals at each of the 100 wavelengths (i.e. the signal
spectrum) of the unknown mixture.
(Note: spreadsheet array functions like this must be entered
by typing Ctrl-Shift-Enter,
not just Enter as
usual, See "Guidelines
and examples of array formulas".
. OpenOffice Calc spreadsheet
demonstrating the CLS procedure for the measurement of a 5-component
unknown mixture at 100 wavelengths
Alternatively, you can skip over all the details above and use the
built-in LINEST function, in both Excel
or OpenOffice
Calc, which performs this type of calculation in a single
function statement.
This is illustrated in RegressionTemplate.xls, in cell Q23. (A
slight modification of the function syntax, shown in cell Q32,
performs a baseline corrected calculation). A significant
advantage of the LINEST function is that it can automatically
compute the standard errors of the coefficients and the R2
value in the same operation; using Matlab or Octave, that would
require some extra work. (LINEST is also an array function that must
also be entered by typing Ctrl-Shift-Enter, not just Enter).
Note that this is the same LINEST function that was
previously used for polynomial
least-squares; the difference is that in polynomial
least-squares, the multiple columns of x values are computed,
for example by taking the powers (squares, cubes, etc) of the x's,
whereas in the multicomponent CLS method, the multiple columns of x
values are experimental spectra of the different standard
solutions. The math is the same, but the origin of the
x data is very different.
A template for performing a 5-component analysis on your own data,
with step-by-step instructions, in available as RegressionTemplate.xls and RegressionTemplate.ods (Graphic with example data from
the demo above). Paste you own data into columns B - G. You must
adjust the formulas if your number of data points or of components
is different from this example. The easiest way to add more
wavelengths is to select an entire row anywhere between row 40 and
the end, right-click on the row number on the left and select Insert.
That will insert a new blank row and will automatically adjust all
the cell formulas (including the LINEST function) and the graph to
include the new row. Repeat that as many times as
needed. Finally, select the entire row just before the
insertion (that is, the last non-blank row) and drag-copy in down to
fill in all the new blank rows. Changing the number of components is
more difficult: it involves inserting or deleting columns between C
and G and between H and L, and also adjusting the formulas in rows
15 and 16 and also in Q29-U29.
Spreadsheets of this type, though easy to use once constructed, must
be carefully modified for different applications that have different
numbers of components or wavelengths, which is inconvenient and can
be error-prone. However, it is possible to construct these
spreadsheets in such a way that they automatically adjust
to any number of components or wavelengths. This is done by using
two new functions: (a) the COUNT
function in cells B18 and F18, which counts the number of
wavelengths in column A and the number of components in row Q22-U22,
respectively, and (b) the INDIRECT
function in cell Q23 and in row 12 and 13, which allows the
address of a cell or range of cells to be calculated within the
spreadsheet (based on the number of wavelengths and components
just counted) rather than using a fixed address range. This
technique is used in RegressionTemplate2.xls
and in two examples showing the same template with data
entered for different numbers of wavelengths and for mixtures of 5
components at 100 wavelengths (RegressionTemplate2Example.xls)
and for 2 components at 59 wavelengths (RegressionTemplate3Example.xls).
You'll still have to adjust the graph, however, to cover the desired
x-axis range.
Excel template applied to the measurement of a
5-component unknown mixture at 100 wavelengths.
Matlab and Octave are really the natural computer
approaches to multicomponent analysis because they handle all types
of matrix math so easily, compactly, and quickly. In these
languages, the notation is very compact: the transpose
of matrix A is A', the inverse of A is inv(A), and matrix
multiplication is designated by an asterisk (*). Thus the solution
to the classical least squares method above is written in
Matlab/Octave notation as
C = inv(E'*E)*E'*A
where E is the rectangular matrix of sensitivities at each
wavelength for each component and A is the observed spectrum of the
mixture. Note that the Matlab/Octave notation is not only shorter
than the spreadsheet notation, it's also closer to the
traditional mathematical notation. Even more compactly, you can
write C = A/E, using the Matlab forward
slash or "right divide" operator, which yields the same
results but is in principle more accurate with respect to the
numerical precision of the computer (usually negligible compared to
the noise in the signal; see CaseStudies.html#Numerical).
The script RegressionDemo.m
(for Matlab or Octave) demonstrates the classical least squares
procedure for a simulated absorption spectrum of a 5-component
mixture at 100 wavelengths, illustrated above. Most of this script
is just signal generation and plotting; the actual least-squares
regression is performed on one line:
MeasuredAmp = ObservedSpectrum*A'*inv(A*A')
where different symbols are used for the variables: "A" is a matrix
containing the spectrum of each of the components in each of its
rows and "ObservedSprectum" is the observed spectrum of the
unknown mixture. In this example the dots represent the observed
spectrum of the mixture (with noise) and the five colored bands
represent the five components in the mixture, whose spectra are
known but whose concentrations in the mixture are unknown. The black
line represents the "best fit" to the observed spectrum calculated
by the program. In this example the concentrations of the five
components are measured to an accuracy of about 1% relative (limited
by the noise in the observed spectrum). Comparing RegressionDemo.m
to its spreadsheet equivalent, RegressionDemo.ods,
both running the same computer, you can see that the
Matlab/Octave code computes and plots the results quicker than the
spreadsheet, although both take no more than a fraction of a
second for this example.
Extensions:
(a) The extension to multiple unknown samples, each with its
own "ObservedSpectrum" is straightforward in Matlab/Octave. If you
have "s" samples, just assemble their observed spectra onto a matrix
with "s" rows and "w" columns ("w" is the number of
wavelengths), then use the same formulation as before:
(b) The extension to "background correction" is easily
accomplished in Matlab/Octave by adding a column of 1s to the
A matrix containing the
absorption spectrum of each of the components.:
background=ones(size(ObservedSpectrum));
A=[background A1 A2 A3];
where A1, A2, A3... are the absorption spectra of the individual
components.
(c)
Performing a T-weighted regression is also readily
performed:
The cls.m function:
Ordinarily, the calibration matrix M is assembled from the experimentally measured
signals (e.g. spectra) of the individual components of the
mixture, but it is also possible to fit a computer-generated model
of basic peak shapes (e.g. Gaussians, Lorentzians, etc) to a
signal to determine if that signal can be represented as the
weighted sum of overlapping basic peak shapes. The function cls.m computes such a model consisting of the
sum of any number of peaks of known shape, width, and position,
but of unknown height, and fit it to noisy x,y data sets.
The syntax is
heights=cls(x, y, NumPeaks, PeakShape, Positions, Widths, extra)
where x and y are the vectors of measured data (e.g. x might be
wavelength and y might be the absorbance at each wavelength),
'NumPeaks' is the number of peaks, 'PeakShape' is the peak shape
number (1=Gaussian, 2=Lorentzian, 3=logistic, 4=Pearson, 5=exponentially broadened Gaussian;
6=equal-width Gaussians; 7=Equal-width Lorentzians;
8=exponentially broadened equal-width Gaussian, 9=exponential
pulse, 10=sigmoid, 11=Fixed-width Gaussian, 12=Fixed-width
Lorentzian; 13=Gaussian/Lorentzian blend; 14=BiGaussian,
15=BiLorentzian), 'Positions' is the vector of peak positions on
the x axis (one entry per peak), 'Widths' is the vector of peak
widths in x units (one entry per peak), and 'extra' is the
additional shape parameter required by the exponentially
broadened, Pearson, Gaussian/Lorentzian blend, BiGaussain and
BiLorentzian shapes. Cls.m returns a vector of measured peak
heights for each peak.
The demonstration script
clsdemo.m
(Graphic) creates some noisy model data,
fits it with cls.m, computes the accuracy of the measured heights,
then repeats the calculation by iterative non-linear least
squares peak fitting (INLS, covered in the next section) using the
downloadable Matlab/Octave function peakfit.m, making use of
the known peak positions and widths only as starting guesses
("start"). You can see that CLS is faster and (usually) more
accurate, especially if the peaks are highly overlapped. (This script requires cls.m,
modelpeaks.m, and peakfit.m in the Matlab/Octave path).
Figure(1): Classical Least Squares (multilinear
regression) Elapsed time is 0.000937 seconds. Average peak height accuracy = 0.9145% Figure(2): Iterative non-linear peak fitting with peakfit.m Elapsed time is 0.171765 seconds. Average peak height accuracy = 1.6215%
On the other hand, INLS can be better than CLS
if there are unsuspected shifts in peak position and/or
peak width between calibration and measurement (for example caused
by drifting spectrometer calibration or by changing temperature,
pressure, or solution variables) because INLS can track and compensate for changes
in peak position and width. You can test this by changing the
variable "PeakShift" (line 16) to a non-zero value in clsdemo.m.
The cls2.m function is similar to cls.m, except that it also measures the
baseline (assumed to be flat), using extension to "background correction"
described above, and returns a vector containing the background B
and measured peak heights H for each peak , e.g. [B H1 H2 H3...].
Weighted linear regression: The downloadable Matlab/Octave function "tfit.m" simulates the measurement of the
absorption spectrum of a mixture of three components by weighted
linear regression (on line 61), demonstrates the effect of
the amount of noise in the signal, the extent of overlap of the
spectra, and the linearity of the analytical curves of each
component. This function also compares the results to a more advanced method described later
(line 66) that applies curve fitting to the transmission spectra
rather than to the absorbance spectra.
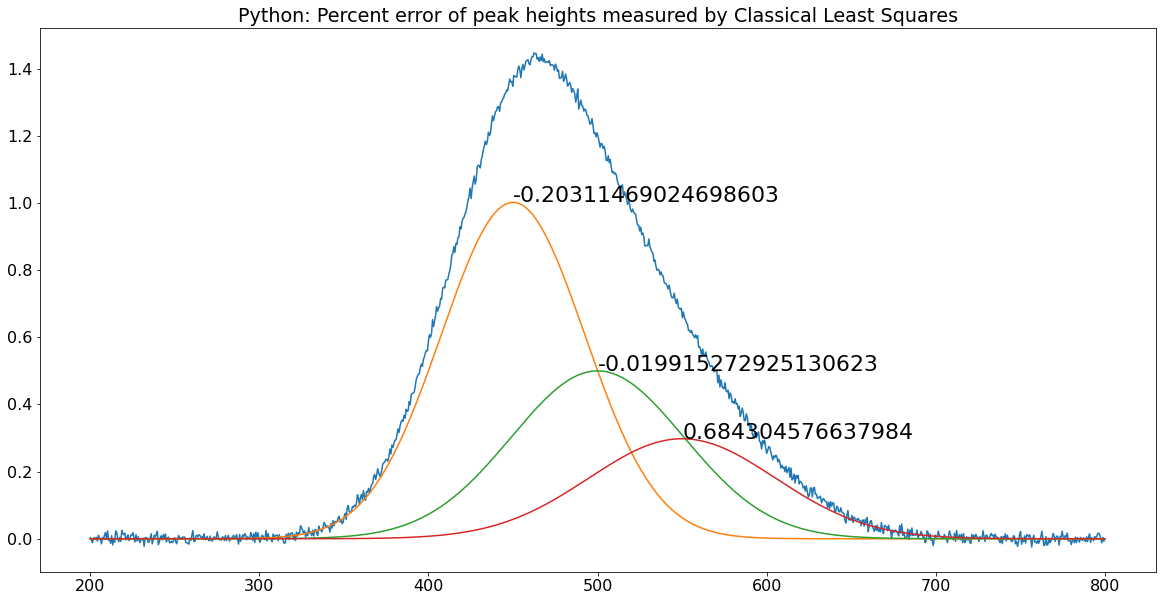
Classical Least Squares in Python
The equivalent expression in Python for
the "Normal Equation" is
C = inv(E.T.dot(E)).dot(E.T).dot(A)
where "inv()" means the matrix inverse,
"E.T"means the transpose of matrix E, and the expression
".dot" means the dot product. This is not so different
than the Matlab version.
C = inv(E'*E)*E'*A
Just remember that before doing this in
Python you must do the following imports:
numpy as np
from numpy.linalg import inv
The pair of matched scripts, NormalEquationDemo.py and NormalEquationDemo.m compare these aspects in Python
and in Matlab. Both scripts use the same sequence of
operations and the same variable names to create and plot
a noisy simulated signal vector A that is the sum
of three peaks of known shape but unknown amplitude, and then to
measure the amplitudes C in the noisy signal by
Classical Least Squares. The percent error between the true and
measured peak heights are printed next to each peak. The code
similarities are striking and the execution times are the same.
The Inverse Least Squares (ILS)
technique is demonstrated in Matlab by this
script and the graph above. The math, described
above, is similar to the Classical Least Squares method, and
can be done by any of the Matlab/Octave or spreadsheet methods
described in this section. This example is a real data set derived
from the near
infrared
(NIR) reflectance spectroscopy of agricultural wheat samples
analyzed for protein content. In this example there are 50
calibration samples measured at 6 wavelengths. These calibration
samples had already been analyzed for protein
content by a reliable, but laborious and time-consuming, reference
method. The purpose of this calibration is to establish
whether near-infrared reflectance spectroscopy, which can be
measured on wheat paste preparations much more quickly than wet
chemical methods, correlates to their protein content as
determined by the reference method. These results indicate that it
does, at least for this set of 50 wheat samples, and therefore is it
likely that near-infrared spectroscopy should do a pretty good job
of estimating the protein content of similar unknown samples. The key is that the unknown samples
must be similar to the calibration samples (except for the
protein content), but this is a very common analytical situation in
industrial and agricultural quality control, where large
numbers of samples of products of a similar predictable type must
often be tested quickly and cheaply.
Note: you
can right-click on any of the m-file links above and select Save Link As... to download them to
your computer for use within Matlab.
Revised August, 2021. This page is part of "A Pragmatic
Introduction to Signal Processing", created and
maintained by Prof. Tom
O'Haver , Department of Chemistry and Biochemistry, The
University of Maryland at College Park. Comments, suggestions and
questions should be directed to Prof. O'Haver at toh@umd.edu.
Unique visits since May 17, 2008:

 .
.
 The pair of matched scripts, NormalEquationDemo.py and NormalEquationDemo.m compare these aspects in Python
and in Matlab. Both scripts use the same sequence of
operations and the same variable names to create and plot
a noisy simulated signal vector A that is the sum
of three peaks of known shape but unknown amplitude, and then to
measure the amplitudes C in the noisy signal by
Classical Least Squares. The percent error between the true and
measured peak heights are printed next to each peak. The code
similarities are striking and the execution times are the same.
The pair of matched scripts, NormalEquationDemo.py and NormalEquationDemo.m compare these aspects in Python
and in Matlab. Both scripts use the same sequence of
operations and the same variable names to create and plot
a noisy simulated signal vector A that is the sum
of three peaks of known shape but unknown amplitude, and then to
measure the amplitudes C in the noisy signal by
Classical Least Squares. The percent error between the true and
measured peak heights are printed next to each peak. The code
similarities are striking and the execution times are the same.