PLEASE PRINT OUT THESE PAGES FIRST AND THEN KEEP THE PRINTED TEXT BESIDE
YOU AS A GUIDE WHEN YOU LOAD AND RUN "NEURON". THIS WILL SAVE YOU HAVING
TO JUGGLE BETWEEN NEURON AND NETSCAPE WINDOWS ONCE YOU HAVE THE SIMULATION
LOADED.
To begin working with this chapter you should have downloaded and installed
Neuron, as described in Chapter 1.
-
For this simulation, you will need to load a new
simulation that again shows the behavior of a patch of membrane under
current clamp conditions. This simulation allows you to observe currents
flowing through the voltage-dependent sodium and potassium channels as
well as to change the values of the various conductances and nernst potentials.
-
Once loaded, click on "Iclamp" in the bottom middle window to bring
up the stimulation parameters.
-
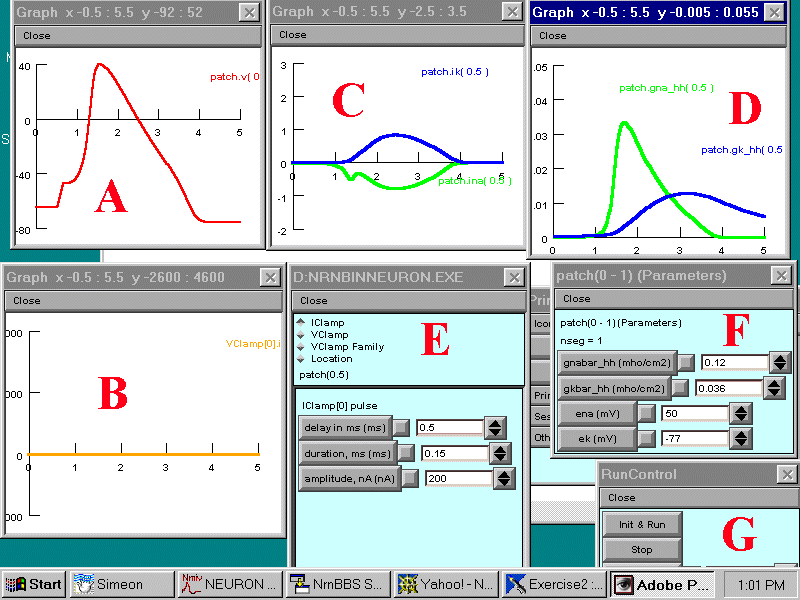
Click on "Init & Run" in the bottom right-hand box to test the program
- you should see an action potential appear in the uppermost left-hand
Graph Window. Click here to read a description
of the various Windows or check with Chapter
2. - use the Back command in your Browser to return to this page.
-
If you want to refresh your memory about the meaning of current clamp recording,
refer to the section in Chapter 3
- use the Back command in your Browser to return to this page.
-
Observe that the sodium conductance increase in graph E and current in
graph G comes slightly before the potassium conductance and current.
-
Test the hypotheses below, draw appropriate graphs (yes, you
have to decide this time what to plot against what to illustrate your report)
and answer the related questions: If you want an example
of how to write up your report, refer to
Chapter 4 - use the Back command in your Browser to return to this
page.
Hypotheses to be tested and related observations to be made
-
Test the hypothesis that the density of sodium channels determines the
rate of rise and amplitude of the action potential.
-
Test the hypothesis that the density of potassium channels determines the
rate at which the action potential falls.
-
Describe the effect of reducing the Nernst potential for sodium.
Now onto Exercise 3.
When you have loaded the simulation you should see Windows arranged
as below. Click on the following letters: A B
C D E F
G for a description of the function of each Window.

A. Graph of the membrane potential of the patch of neuronal membrane
(mV) vs. time (ms)
Return to letters
B. (Not needed for the current clamp simulation) Graph of the
total current (nA) passing through the voltage clamp circuit into the cell.
Equal to zero under current clamp conditions!
Return to letters
C. The sodium current (green) and potassium current (blue) per unit
membrane area (in nA/cm2) passing through the voltage-dependent
sodium and potassium channels. Inward current is down (NEGATIVE), outward
current is up (POSITIVE).
Return to letters
D. The sodium and potassium conductance arising from the activation
of the voltage-dependent channels (in mho/cm2).
Return to letters
E. Current clamp stimulation parameters - the amplitude etc. of the
current pulse delivered through the current electrode to excite the action
potential.
Return to letters
F. The parameters of the sodium and potassium conductances:
gnabar_hh = maximal value of potassium conductance (proportional
to the density of sodium channels)
gkbar_hh = maximal value of potassium conductance (proportional
to the density of sodium channels)
ena - Nernst potential for sodium
ek - Nernst potential for potassium
Return to letters
G. The Run/Control Box - click on Init & Run to run a simulation
Return to letters


