|
Making Statechart Diagram
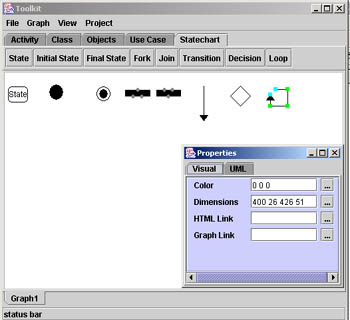
Open the toolkit as explained earlier and select the
state chart tab. Your window should look like this:
A statechart diagram has an initial state and a final
state and in between this, there will be a series of transitions between
different states representing the view of behavior modeling. The tool kit
has a tool bar which features all the elements that can be used to make a
statechart diagram.
Working with the Elements of Statechart Diagrams
Click on each tab in the tool bar to see all the symbols that the tool kit
supports.
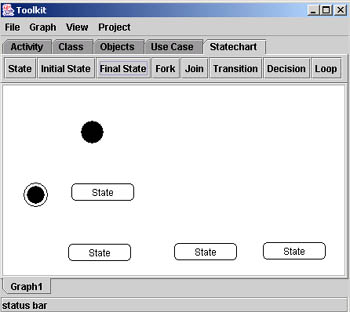
First click on the state tab and then click on
the white screen, You will notice a state element on the screen. Similarly
try clicking all the element on the tool bar and putting it on the screen.
Your screen should look like this:
Notice:
-
The properties applet changes for every element,
showing mainly the color, dimensions, HTML link and Graph link. The
States have more properties such as the name and border size.
-
The properties can be changed by changing the text in
the respective text areas. Notice the changes appearing on the screen.
Changing the Side of the Elements
In the picture above we see that the 'loop' element is
selected and its properties can be seen in the properties applet. Notice
the green boxes on the edges of the loop. Click on those boxes and
simultaneously drag the mouse to adjust its size according to your use.
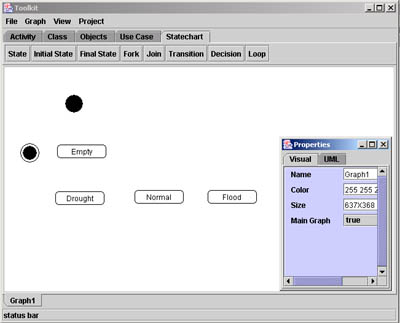
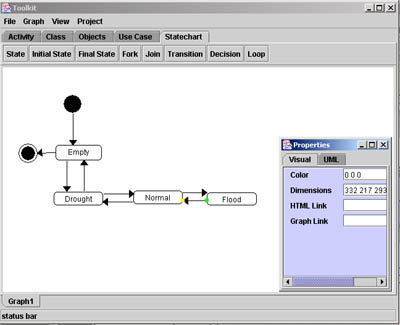
Example -- Hydroelectric Dam
The statechart represents the various levels of water storage
for a hydro-electric dam.
-
Start with the initial state. Click on
the initial state icon on the tool bar and then click on the screen
where you want the element to be placed.
-
Similarly, click on the final state and
follow the same procedure.
-
Now we know that we have 4 states. So
click on the state icon and the click on the screen. Repeat this
procedure another 3 times.
Your screen should look like this:
Arrange all the elements as shown in the above
diagram, by clicking on the element to select it and then drag it to
where you want to place it. you can change he size of the elements by
clicking on the green box created around the elements and dragging it.
You can also chose the property applet to change the dimensions of the
selected elements.
-
Now change the names of the states by
selecting the state first. Notice the property bar has a text area for
Text where 'state' is written. Delete or overwrite the name that you
want to enter and then press enter. Notice the changes on the screen.
-
Now we have show the transition between the states. So
click on the transition icon and then click on the screen where you
want to draw the transaction arrow.
-
Click and drag the green or the yellow box to change
the size of the arrow. You can also move the arrow by clicking in the
center of the arrow and moving it to the place you want to place the
arrow.
-
Notice that the yellow box represent the front edge of
the arrow and the green box represents the back of the arrow.
|