(1) create the simulated signal with two peaks and random noise,
(2) create a zero-centered convolution function of the same shape and with variable width,
(3) divide the Fourier transform of the simulated signal by the modified Fourier transform of a calculated convolution function of the same shape,
(4) add a constant to the numerator of that division to reduce noise spikes,
(5) compute the inverse transform that result, and
(6) apply low-pass filtering to reduce noise.
To demonstrate the performance of this method, several factors must be adjusted: the shape, width, sampling interval, and separation of the two peaks, the noise amplitude, the width of the deconvolution function, the denominator addition, and the filter cutoff frequency. To do this, you would have to edit the script, save it, and re-run it, potentially many times. In this appendix, we will develop two different alternative ways to code this deconvolution demo with a more modern graphical user interface (GUI) that uses sliders, drop-down menus, check boxes, etc., to control the adjustable variables, rather than editing the script itself.
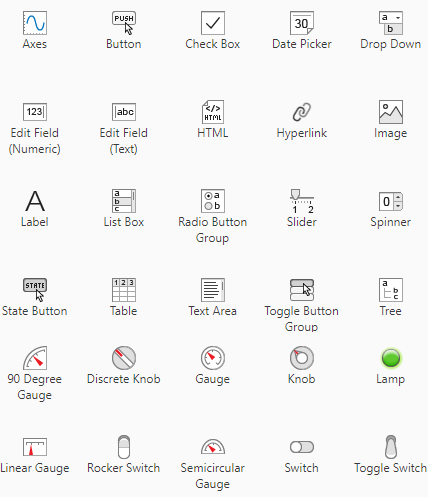
Matlab Live Scripts. A very easy alternative is to use Live Scripts (available starting in MATLAB R2016b), which are interactive documents that combines code, output, controllers, and formatted text in a single environment. To convert the plain script DenomAdditionDemo.m into a Live Script, click Editor, Save as, Save as type > Live Code files (.mlx). To add controllers for the assignment statements, (e.g. delta=0.64), select the value, click Control, and select the an appropriate control, for example a numeric slider or spinner for continuous variables. Then in the pop-up box, type in the min, max, and step values for that control. The editor adds a numeric slider like this:
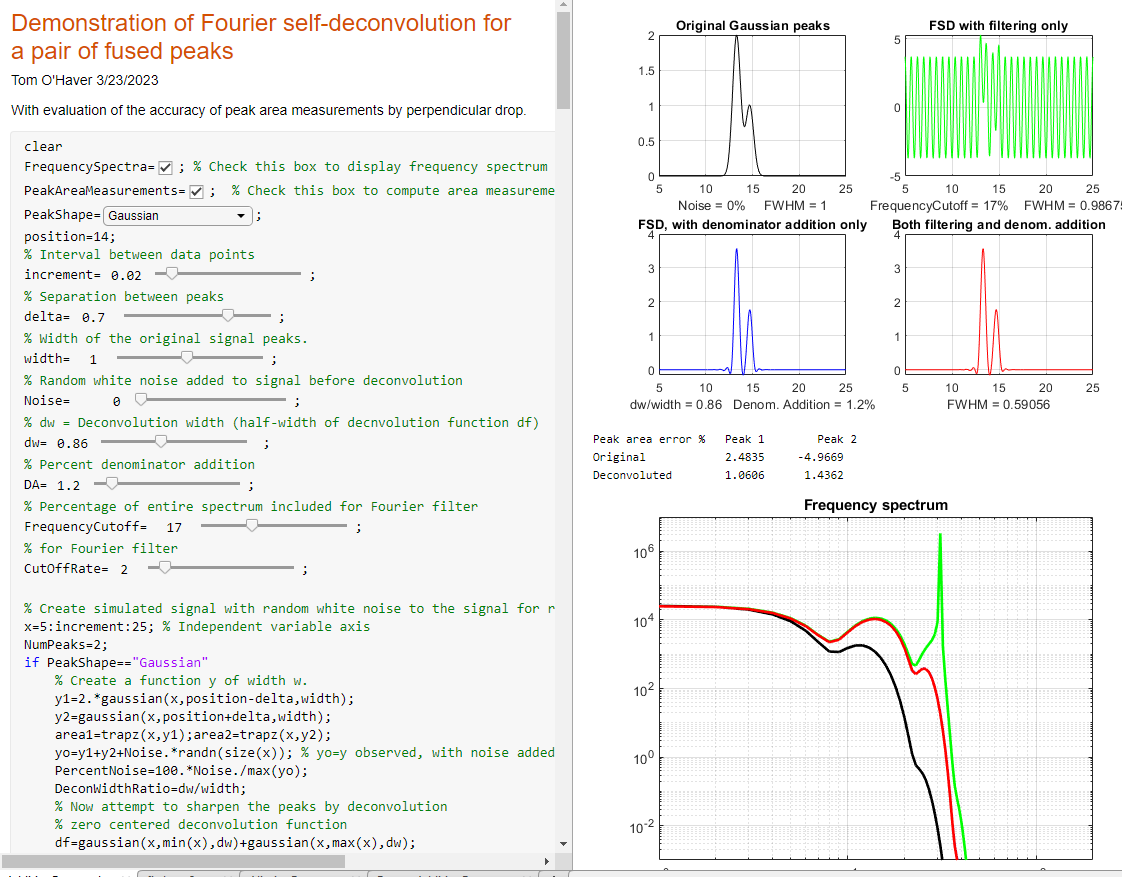
Here is a Live Script version of the self-deconvolution demonstration app, computationally equivalent to the “DenomAdditionDemo.m” function. It has sliders for each of the adjustable variables, which allows those variables to be changed simply by sliding the pointers. Each slider has a numerical range that you can set to be in a “reasonable range” for that variable simply by double-clicking on the slider. Moreover, the app has a pull-down menu to choose the peak shape (Gaussian, Lorentzian, etc.) and checkboxes for optional computation of frequency spectrum and of the peak area measurement accuracy. When any of these controls is changed, the app recalculates and updates the plots continuously as the slider pointer is moved.
Note 1: to view the graphic plots to the right of
the code, as shown above, right-click on the empty space
on the right and select "Disable synchronous scrolling".
Note 2: To make very small
adjustments to the numerical sliders, you can click once
on the little pointer to turn it green, then use your left
and right cursor control keys on your keyboard to make
incremental single-step adjustments. To increase tor
decrease the numerical range of any slider, just
double-click on it and modify the min, max and/or step
values.
For users to do not need access to the code, you can hide it from view by clicking on the View tab and clicking “Hide Code”. For more details, see this page, or these examples.
In addition
to this demonstration script, there is also a version for
applying the method to experimental data stored on disk in .xlsx
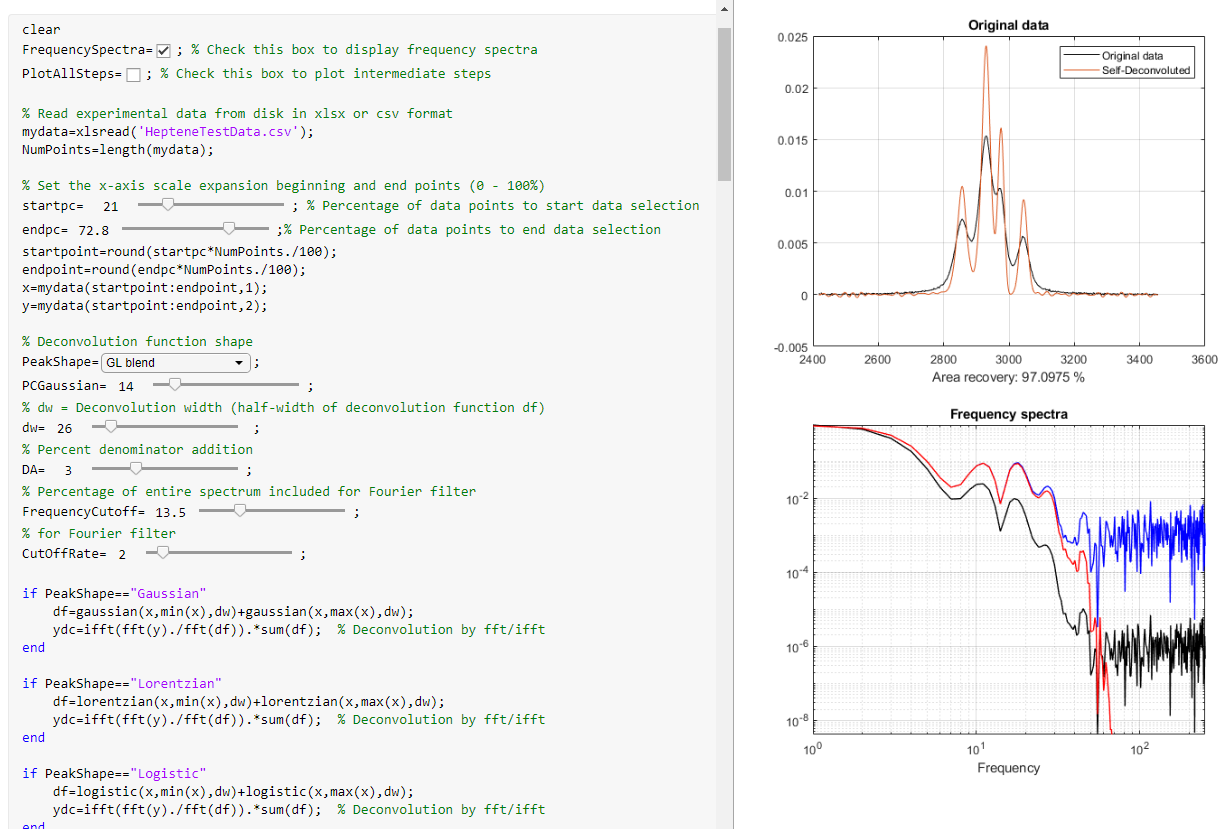
or .csv format, called DeconvoluteData.mlx (screen image).
Clicking the Open data file button in line 1 opens a
file browser, allowing you to navigate to your data file.
The script assumes that your x,y data are in .csv or .xlsx format
and in the first two columns.
Other example of Live scripts include tools for smoothing, peak detection, and iterative peak fitting.
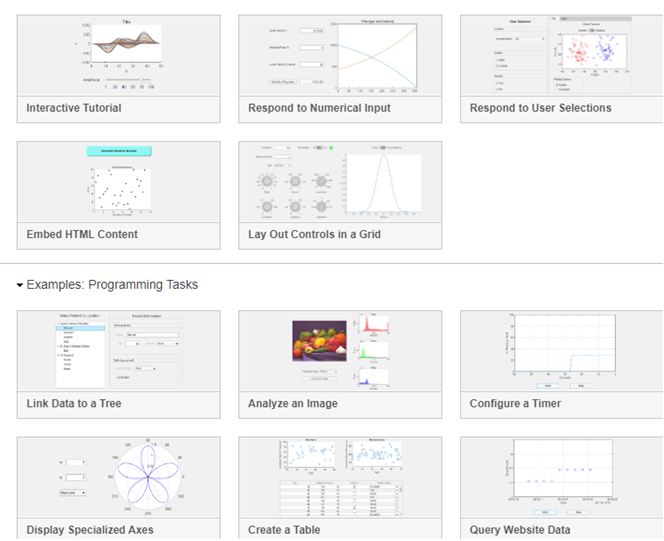
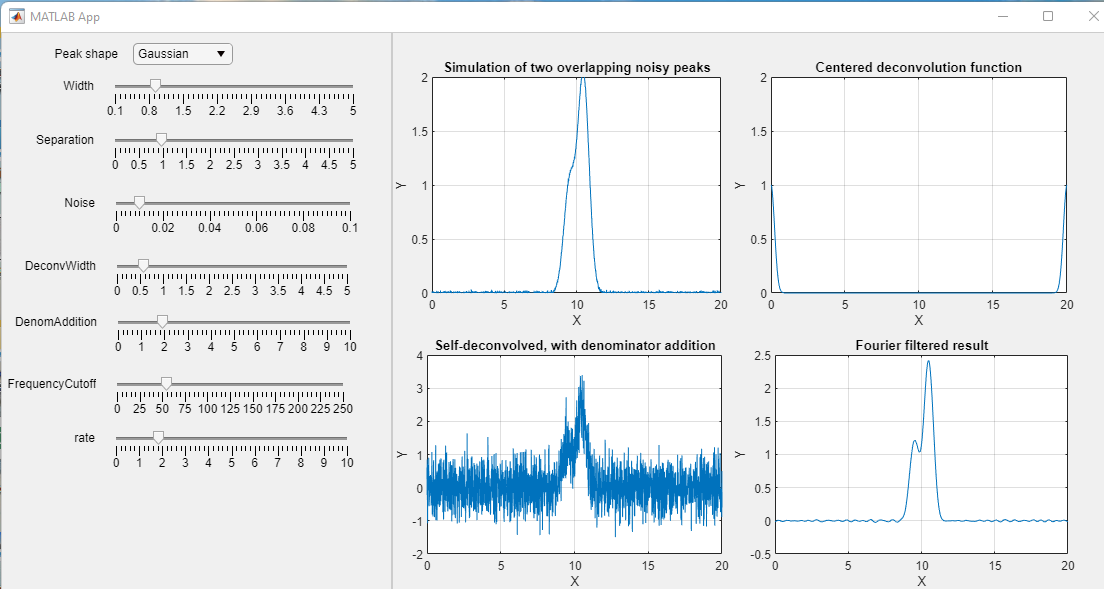
Matlab Apps. There is another development path that results in programs with an even more contemporary and polished graphical user interface (GUI). This is ideal for deployment to users who do not need to have access to the underlying code, to prevent accidental editing or deletion of portions of the script. These are called Matlab “apps”. There are examples of them in the toolboxes that may be included in your version of Matlab (or can be optionally purchased from Matlab); type “ver” at the command line to see which ones are included in yours. The process of development of such apps is more complex than coding the mathematically equivalent Live Script or function. But fortunately, Matlab has a built-in drag-and-drop development environment to build user interfaces; just click on the APPS button at the top left. This brings up several app-related buttons as well as a list of apps already installed.

 - the
"look" of your app - which might include menus, buttons,
controls, tables, graphs, etc. You do
- the
"look" of your app - which might include menus, buttons,
controls, tables, graphs, etc. You do Rather than detail all the required steps here, I will defer to the many excellent tutorials and YouTube videos already available.
For example, there is  a video tutorial titled
"Getting Started and Hello World app" at https://www.youtube.com/watch?v=iga-YS6VbyE. "Hello World" refers to very first
simple example often used for learning a new programming
language, which simply writes that phrase on the display.
a video tutorial titled
"Getting Started and Hello World app" at https://www.youtube.com/watch?v=iga-YS6VbyE. "Hello World" refers to very first
simple example often used for learning a new programming
language, which simply writes that phrase on the display.