Color Temperature of a Blackbody Source
 |
|
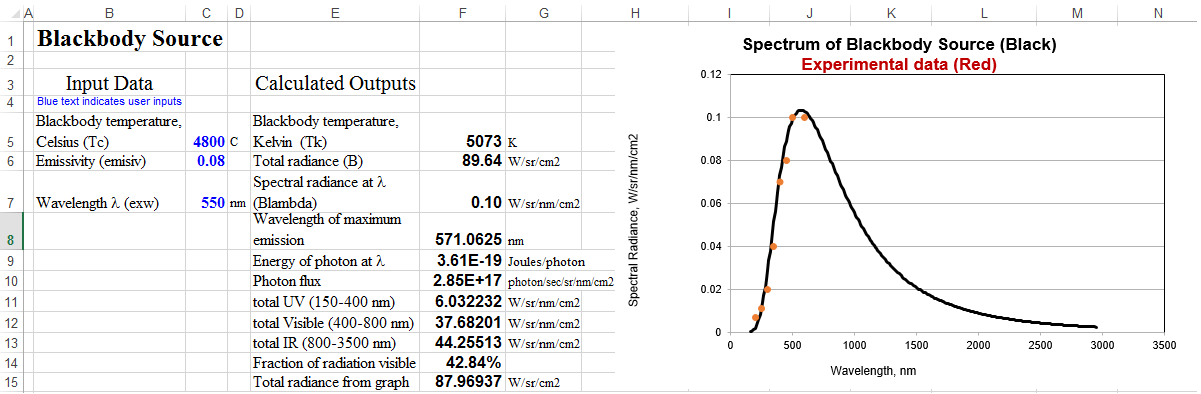
Evaluation of the Planck blackbody equation. Demonstrates how the emission spectrum of a blackbody radiator depends on its temperature and emissivity.
This model can be used to determine whether a light source has a blackbody-like emission spectrum and to estimate its temperature and emissivity if so. Students take experimental measurements of the radiance of a light source at various wavelengths, type in the values of wavelength and radiance into the table on the right, then adjust the parameters of the model (temperature and emissivity) so that the calculated blackbody spectrum (shown by the red line) is a best fit to the experimental data points (shown by the blue dots). For the greatest accuracy, the spectrum must be recorded on an instrument that is corrected for the wavelength-dependence of the detector sensitivity.
Download links:
Download spreadsheet in Excel
format (.xls)
Download spreadsheet in
OpenOffice format (.ods)
WingZ version: black.wkz; Screen image.
Wingz player application and basic set of simulation modules,
for windows PCs or Macintosh
Other simulations that
employ a blackbody source:
Signal-to-Noise
Ratio of Absorption Spectrophotometry
Fluorescence
Spectroscopy Signal-to-Noise Ratio
U.V.-Visible
Spectrophotometer
Dual
Wavelength Spectrophotometer
Note: It is also possible to use the more advanced technique of iterative least-squares curve fitting to automatically adjust the parameters of the blackbody equation to fit the measured spectrum of an incandescent body for the purpose of estimating its color temperature and emissivity. The Matlab/Octave script BlackbodyDataFit.m demonstrates the technique, placing the experimentally measured spectrum in the vectors "wavelength" and "radiance" and then calling the built-in minimum finder function fminsearch with the fitting function fitblackbody.m.
Computes the spectral radiance, total radiance, and peak wavelength of a blackbody source, given the temperature and emissivity. Also plots spectral radiance vs wavelength from 150 nm to 3500 nm.
Note: to run the OpenOffice
(.ods) spreadsheets, you have to first download the OpenOffice
installer (download
from OpenOffice), then install it (by double-clicking on the
installer file that you just downloaded), and then download my
spreadsheets from this page. Once OpenOffice is installed,
you can run my spreadsheets just by double-clicking on them.