Zoology 421 Neuron simulations:
Exercise 5. Effect of passive transmission on synaptic
strength.

PLEASE PRINT OUT THESE PAGES FIRST AND THEN KEEP THE PRINTED TEXT BESIDE
YOU AS A GUIDE WHEN YOU LOAD AND RUN "NEURON". THIS WILL SAVE YOU HAVING
TO JUGGLE BETWEEN NEURON AND NETSCAPE WINDOWS ONCE YOU HAVE THE SIMULATION
LOADED.
To begin working with this chapter you should have downloaded and installed
Neuron, as described in Chapter 1.
Preparing for the simulation:
In this Exercise a long dendrite is simulated. The dendrite has a diameter
of 0.2 mm and a length of 200
mm. At one end of the dendrite is an excitatory synapse, towards
the other end of the dendrite is a voltage electrode, 0.75 of the way down
the dendrite (i.e. at 150 mm). Load the simulation and click on the Init and
Run button . The Windows are explained below
Hypotheses to be tested and related observations to be made:
-
Move the excitatory synapse closer to the voltage electrode in steps of
about 30 mm. Use the "Keep lines" option on
the Graph menu (right click on the Window C) to compare the traces
at the various distances. Explain the changes you see in the wave form
of the voltage change in terms of the theory of passive propagation. In
addition to the points made in the theory
section of Exercise 4, you may need to consider the effect of membrane
capacitance.
-
If the membrane at the site of the voltage electrode contained voltage-dependent
sodium and potassium channels and the threshold for the activation of an
action potential at the site of the voltage electrode were -50 mV,
how close would the synapse have to be to the site of the voltage electrode
in order to trigger an action potential there?
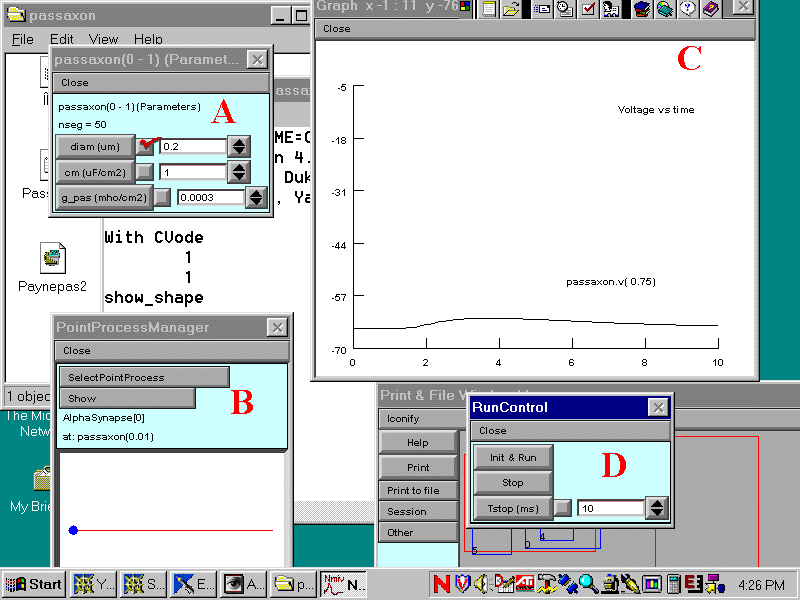
When you have loaded the simulation you should see Windows arranged
as below. Click on the following letters: A B
C D for a description of the function
of each Window.
Return to Instructions

A. The parameters of the dendrite:
diam - the axon or dendrite diameter (ignore the check mark)
cm - the specific membrane capacitance
g_pas - the passive membrane conductance
Return to letters
B. Stimulation Parameter Window: As shown, this allows you to
view and alter the position of the synapse (blue dot) along the dendrite
(red line). Click on various places along the red line to move the synapse.
Return to letters
C. Graph of the membrane potential recorded at a point 0.75 of the way
along the dendrite - i.e. 150 mm from
the end with the synapse
Return to letters
D. The Run/Control Box - click on Init & Run to run a simulation.
Return to letters


