Ensemble averaging is a powerful
method of reducing the effect of random noise in experimental
signals, when it can be applied. The idea is that the signal is
repeated, preferably a large number of times, and all the
repeats are averaged. The signal builds up, and the noise
gradually averages towards zero, as the number of repeats
increases.
An important requirement is that the repeats be aligned
or synchronized, so that in the absence of random noise, the
repeated signals would line up exactly. There are two ways of
managing this:
(a)
the signal repeats are triggered by some external event and the
data acquisition can use that trigger to synchronize the
signals, or
(b) the signal itself has some feature that can be used to
detect each repeat, whenever it occurs.
The first method (a) has the advantage that the signal-to-noise (S/N) ratio can be arbitrarily low and the average signal will still gradually emerge from the noise if the number of repeats is large enough. However, not every experiment has a reliable external trigger.
The second method (b) can be used to average repeated
patterns in one continuous signal without an external trigger
that corresponds to each repeat, but the signal must then
contain some feature (for example, a peak) with a
signal-to-noise ratio large enough to detect reliably in each
repeat. This method can be used even when the signal patters
occur at random intervals, when the timing of the repetitions is
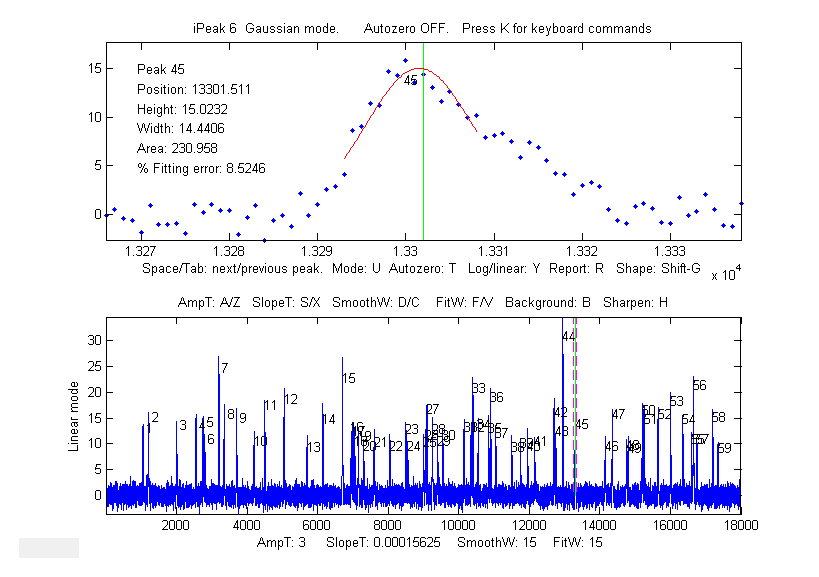
not of interest. The interactive peak detector iPeak 6
has a built-in ensemble averaging function (Shift-E) can compute the average of all the repeating
waveforms. It works by detecting a single peak in each
repeat in order to synchronize the repeats.
The Matlab script iPeakEnsembleAverageDemo.m (on http://tinyurl.com/cey8rwh) demonstrates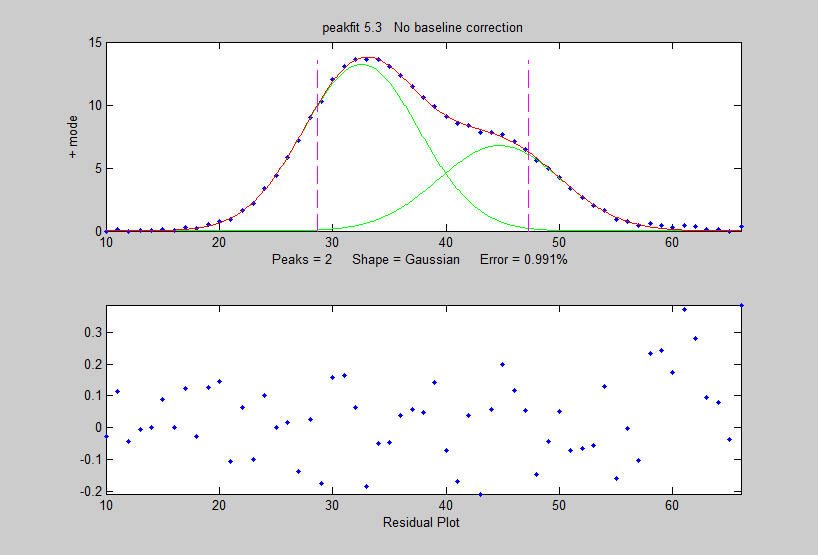 this idea, with a signal that contains a
repeated underlying pattern of two overlapping Gaussian
peaks, 12 points apart, with a 2:1 height ratio, both of
width 12. These patterns occur a random intervals, and
the noise level is about 10% of the average peak height.
Using iPeak (above left), you adjust the peak detection
controls to detect only one peak in each repeat pattern,
zoom in to isolate any one of those repeat patterns, and press Shift-E. In this case there are about
60 repeats, so the expected signal-to-noise (S/N) ratio
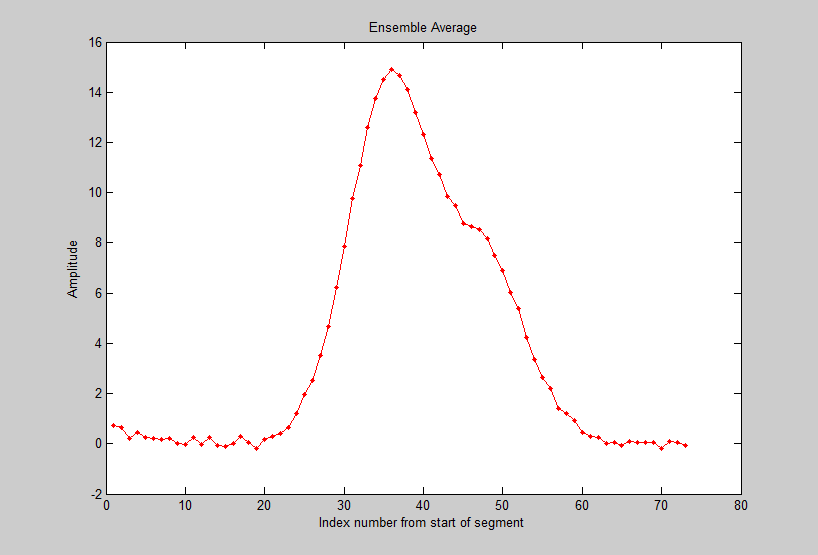
improvement is sqrt(60) = 7.7. You can save the averaged pattern (above right)
into the Matlab workspace as "EA" by typing
this idea, with a signal that contains a
repeated underlying pattern of two overlapping Gaussian
peaks, 12 points apart, with a 2:1 height ratio, both of
width 12. These patterns occur a random intervals, and
the noise level is about 10% of the average peak height.
Using iPeak (above left), you adjust the peak detection
controls to detect only one peak in each repeat pattern,
zoom in to isolate any one of those repeat patterns, and press Shift-E. In this case there are about
60 repeats, so the expected signal-to-noise (S/N) ratio
improvement is sqrt(60) = 7.7. You can save the averaged pattern (above right)
into the Matlab workspace as "EA" by typing
>> load EnsembleAverage; EA=EnsembleAverage;
then curve-fit this averaged pattern to a
2-Gaussian model using the peakfit.m
function (figure on the right):
>> peakfit([1:length(EA);EA],40,60,2,1,0,10)
Position
Height Width Area
32.54
13.255 12.003 169.36
44.72
6.7916 12.677 91.648
You will see a big improvement in the accuracy of the peak separation, height ratio and width, compared to fitting a single pattern in the original x,y signal:
>> peakfit([x;y],16352,60,2,1,0,10)