Zoology 421 Neuron simulations:
Exercise 7: Simulation of a motorneuron - spatial and
temporal summation of synaptic activity

PLEASE PRINT OUT THESE PAGES FIRST AND THEN KEEP THE PRINTED TEXT BESIDE
YOU AS A GUIDE WHEN YOU LOAD AND RUN "NEURON". THIS WILL SAVE YOU HAVING
TO JUGGLE BETWEEN NEURON AND NETSCAPE WINDOWS ONCE YOU HAVE THE SIMULATION
LOADED.
To begin working with this chapter you should have downloaded and installed
Neuron, as described in Chapter 1.
Preparing for the simulation: This simulation brings together all of the
concepts presented in Exercise 1 through 5. Load
the simulation.
This simulation of a complete nerve cell is offered to demonstrate
some features of synaptic integration and impulse generation. For this
example we have chosen a stylized motoneuron whose structure is similar
to that of the much studied spinal motoneuron of the cat. Both the model
and some of the language used here to describe it were developed by John
Moore and Michael Hines at Duke and Yale universities. This model motoneuron
is rather complete, consisting of a soma, an axon hillock, an initial segment
of axon leading to a long myelinated fiber, and a dendritic tree collapsed
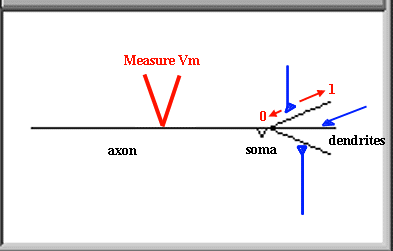
into three dendrites as shown in this figure copied from the panel in the
lower left of your screen.

The channel densities in each of these elements have been laboriously
chosen to match as many as possible of available experimental observations
on the spinal motoneuron of the cat. The motorneuron accepts three excitatory
synapses (shown in blue), one on each dendrite. The location of the synapses
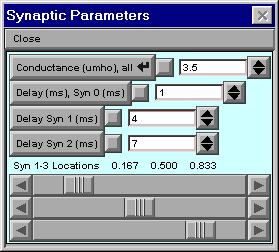
on each dendrite is determined by a number between 0 and 1 in the top left-hand
panel as shown below. When activated, the synapses depolarize the initial
segments of the axon and the soma, resulting in action potentials being
generated by voltage-dependent channels in the axon and soma. These action
potentials travel down the axon, out of the spinal cord and excite muscle
to contract.

A value of 0 means that the synapse is placed at the cell soma, a value
of 1 places it at the end of the dendrite. When the simulation is loaded,
the synapses are spaced at three different, increasing distances along
their respective dendrites. In addition to their location, the delay before
each synapse is activated can be determined. When the simulation is loaded,
the synapses are activated at three different, increasing times; 1, 4 and
7 ms respectively. The conductance of the post synaptic membrane change
(the strength) of the synapses can be changed.
Click on the Init & Run button on the lower right of the screen
to run the simulation. In the graph of membrane potential vs. time,
you should see the effect on the membrane potential, as recorded in the
axon, of the activation of the three synapses (see diagram above for voltage
electrode position). Neither of the three active synapses triggers an action
potential.
Hypotheses to be tested and related observations to be made:
-
When you first run the simulation after loading, why does the effect of
each synapse diminish in size from synapse 1 to synapse 3?
-
Move all of the synapses to position 0.5 by grabbing the buttons on the
Synaptic parameters box and gliding them along. Init & Run the simulation.
Does the result confirm your answer to the above question? Now try diminishing
the distance between the synapses and the soma in steps of about 0.1, keeping
all of the synapses at the same (smaller) distance. What happens
to the effectiveness of the synapses as they are placed closer to the soma?
At what distance is an action potential triggered.
-
Move all of the synapses to position 0.5. Now try reducing the time
interval between the activation of the synapses e.g. from 1,4,7 ms to 1,
3, 5 ms. etc. Observe the summation of depolarization resulting from the
overlap of the effect of each synapse. Keep on reducing the interval between
the activation of the synapses. At what interval does temporal summation
result in an action potential?
-
Just play with the positions and timing of the synapses and try to get
a feel for the interplay between temporal and spatial summation in triggering
action potentials.


