|
Silicon-based quantum computing home page B. E. Kane November, 2010 |
Quasi-classical transport in a six valley 2D electron system |
|
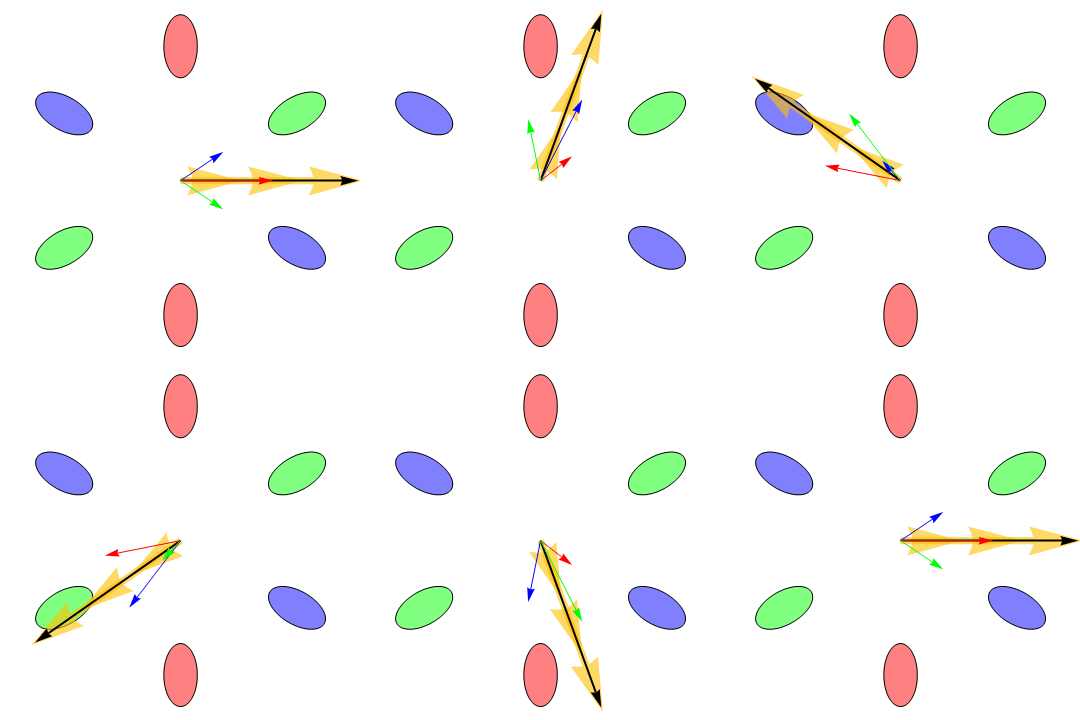
Our recent research has demonstrated that the six electron valleys in silicon are very nearly equally occupied in our H terminated silicon [111] FETs. Transport in this system is interesting because the effective masses of the electrons in the valleys are anisotropic and consequently the electrons do not always move in the direction of an applied electric field, as is shown in the following animation: |
|
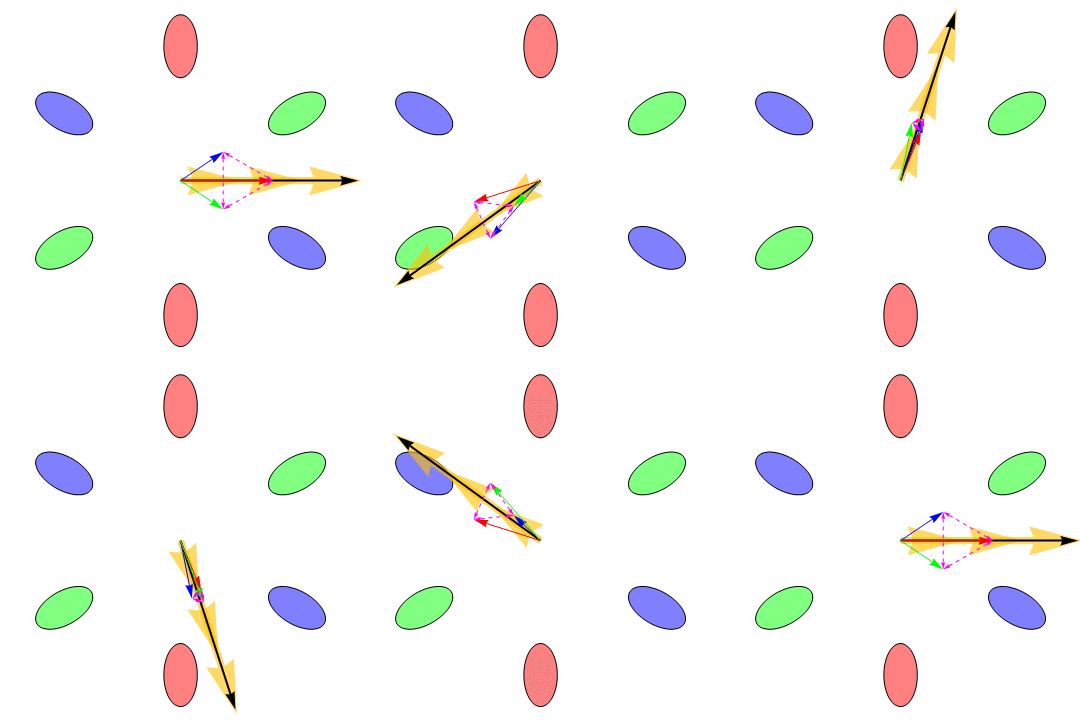
The big arrow is the applied electric field. In the animation it is rotating in order to illustrate the dependence of the valley currents on the field direction. The blue, green, and red arrows are the currents induced by the electric field in the correspondingly colored valleys (the valleys on opposite sides from one another have the same mass anisotropy and consequently always have the same current vectors). The vector sum of the currents from all of the valleys is the black arrow, which always points in the same direction as the electric field when all the valleys are equally occupied. However, the differing valley currents cause the Hall effect — the voltage that is measured when a magnetic field is applied perpendicular to the plane of the electrons’ motion—to deviate from its classical value Measurement of the Hall effect allows us to determine the drag or friction between the electrons in different valleys. Intervalley drag is always present at high temperatures because thermally induced charge fluctuations cause electron scattering and hence momentum exchange between the valleys. If the intervalley drag is large enough, the electrons in all the valleys move with the same velocity, and consequently the Hall effect approaches its classical value. Lowering the temperature causes the intervalley drag to diminish, allowing the electrons in different valleys to move in different directions. Intervalley drag can thus be probed by measuring the temperature dependence of the Hall effect. The following animation shows how the valley currents change as the strength of the intervalley drag is varied. The dotted double ended arrows are a representation of the drag force between the electrons in different valleys. The animations were developed by Robert McFarland. |


