The Retirement Income Simulation Spreadsheet

http://www.wam.umd.edu/~toh/income/
Tom O'Haver, University of Maryland, April 1998. Revised April, 2008.

Swedish translation by Weronika Pawlak. Dutch translation by Johanne Teerink.

This simulation shows how much income you can withdraw from a retirement account of (e.g. an IRA or 401k account) that is invested it in a combination of fixed-interest or variable (equity) instruments, assuming that all interest and capital gains are re-invested and not taxed. You can control the income withdrawn, the return on the fixed-income and equity portions of your investments, and the volatility (uncertainty) of the equity portion. Graphs show the variation of principal and monthly income vs time for a 35-year period of retirement (for example, from age 65 to 100, or from age 60 to 95). (A companion simulation, the Investment Simulation Spreadsheet can be used to estimate the principal that can be accumulated by investing in your working years). Instructions and further explanation is available on https://terpconnect.umd.edu/~toh/simulations/Instructions.html

Note: This simulation was developed for instructional purposes and is not intended a tool for detailed personal financial planning. It does not take into account certain personal and legal factors that may apply to citizens of the USA, such as: additional income from pensions, Social Security, or wage earnings; income taxes and capital gains taxes; IRS penalties for early withdrawal before age 59 or for excess withdrawls above $150,000 per year; and IRS minimum required withdrawls from tax-deferred accounts after age 70 1/2.

This simulation is available in three different spreadsheet formats:

The Inputs:

The Outputs:
The Graphs:
Experiments.
  1. Start with the Initial principal set to, say, $1,000,000 and all the other variables set to zero. Obviously in this case you are taking no income, so the income graph stays at zero and principal graph stays flat.

  2. Increase the "Yearly income, initial $" variable and notice the effect: the annual income graph is a flat line (constant) and the principal graph is a straight line sloping down, showing the depletion of principal. Set the $ income to $100,000/year. In this case you can do the math in your head - you are obviously going to run out of money in 10 years, and this is shown by the graphs as you would expect. Question: What is the largest annual income you can take that will cause your money to last for at least 35 years? Do you consider that a reasonable annual income for someone starting out with a million dollars?

  3. Return the "Yearly income, initial $" to zero. Increase the "Yearly income as % of principal" and notice the effect: the both the annual income graph and the principal graph are now curved lines. This is because the income is calculated as a fixed percentage of the principal, so as the principal is depleted, income drops. If you set this variable to 10% (of a $1,000,000 initial principal), the initial income $100,000/year as before, you will see that you don't run out of money suddenly; rather, your annual income decreases substantially with time as the principal is depleted.

  4. Now let us assume that you have invested your entire principal in a fixed-return account earning 5% yearly. Set the "Fixed Return" variable to 5. Set your annual income to $30,000. Now the principal graph shows an upward curve as the interest from your investment, compounded from year to year, more than compensates for the $30,000 annual income withdrawn. You could now increase your income without running out of money. Question: What income can you take that will cause your principal to remain unchanged for the full 35 year duration of the simulation? Limiting your income to this amount, you will never run out of money, no matter how long you live, and you will have all of the original principal to pass on to your heirs. However, perhaps you do not care to leave anything behind, in which case you can increase your income even further. The advantage of investing your principal in fixed-return instruments is predictability - that is, you can predict exactly how much income you will make from your investment and how long your principal will last. If you have accumulated a sufficiently large principal, then you may have the luxury of investing in predictable, worry-free fixed-return investments. However, many retirees find that they need to obtain more retirement income than fixed-return investments allow.

  5. How much income will you need in retirement? Many financial advisors say you will need between 80% and 100% of your pre-retirement income. Some expenses will be reduced in retirement (no daily commuting to work, possibly lower clothing costs, lower housing costs if your home is paid off by that time), but some expenses may be greater. (Most retirees report that they spend more on travel, entertainment, eating out, and - especially as they get older - medical expenses). But if you are many years from retirement, how can you estimate what your income will be just before retirement? At the vary least, it is likely that your income will keep up with inflation, which has averaged between 3 and 5% over the last several decades. Moreover, it's likely that you will receive raises, promotions, or better job opportunities at some points in your working life. That means that over a 30-year period, your income could easily be 5-10 times your starting income, even though that may seem like a lot of money from the perspective of someone just beginning their working life. Social Security will clearly not be enough, even if that system is still in operation when you retire. Consider yourself fortunate if you will get a pension from your employer - such pensions are becomming less and less common. It's most likely that you will need to generate most or all of your retirement income yourself, from your retirement savings and investments.

  6. A favorite way to increase retirement income is to increase the investment return on your retirement savings. Typically, returns on equity investments (stocks and stock mutual funds) are greater than that for fixed investments. The long-term historical average annual return of the stock market is 10% including the Great Depression and 12% excluding the Depression. To simulate investment in equities, set the "Fraction in equities" variable to 100% and the "Equity Return" to between 10% to 12%. Question: Now what annual income can you take that will leave your principal unchanged?

  7. The down side of investing in equities is the risk of fluctuating returns (called "volatility"). In some years the stock market does better than in other years. The volatility is the degree to which the returns fluctuate around their average; it is expressed in terms of standard deviation. The higher the standard deviation, the higher the fluctuation.

    You can simulate the effect of these fluctuations by setting the "Volatility" variable to some non-zero value. Doing so will introduce some "bumpiness" in the principal curve (and in the income curve, if you are basing all or some of your income on a percentage of principal). Every time you recalculate the spreadsheet, another random set of returns is calculated. This is like simulating various alternative possible "futures". Every time you try out a different set of input variables, you should press F9 several time to observe how much your income varies.

    An obvious effect of fluctuation in investment returns is that it makes precise planning impossible. In fact, the effect of fluctuation is greater in your retirement years, when you are withdrawing income from your retirement accounts, than in your wealth-accumulation years, when you are contributing to to your retirement accounts. This is illustrated in the following graph, which shows a simulation of random fluctuating returns on investment principal for two scenarios. The top graph illustrates the wealth-accumulation years (calculated with the Investment Simulation Spreadsheet) and the bottom graph illustrates the retirement income years. The average annual return (10%) and standard deviation (15%) are identical for these two scenarios. The only difference is that in the top graph, regular contributions are made, while in the bottom graph, regular withdrawls are made. Clearly, the effect of volatility is much greater in the retirement income. This is one reason that retired persons are often advised to keep their principal invested in a balanced portfolio of conservative equity funds and fixed-return funds, in order to reduce volatility. People in their wealth-accumulation investment phase, however, can tolerate more volatility and can afford to invest more aggressively.
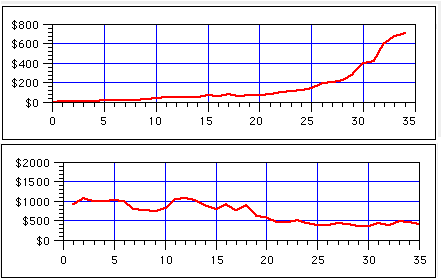
    But there is another and even more serious problem. If the standard deviation is suficiently large relative to the average return, it is possible that your principal may be exhausted within your life expectancy. Once that happens, there is no way to recover your principal, because you are no longer making contributions. Try increasing the volatility and see if you can observe such a "go broke" scenario. Obviously, you want to eliminate this possiblity. There are several ways to reduce the likelyhood of going broke: you could reduce your rate of withdrawls, increase the rate of return on your investments, or reduce the volatility of your investment returns.
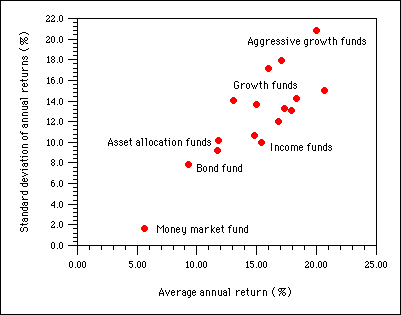
  8. What are the values of typical standard deviations for various types of investments? The following chart shows the percent average annual return (on the horizonatal axis) plotted against the annual standard deviation (on the vertical axis) of several different investment types. (These are real examples of well-known funds computed over the period 1987-1997). Clearly there is a trend evident here: the investments with the highest potential rate of return are generally the ones with the highest volatility.


    Obviously, both high average return and low standard deviation are desirable. In general, funds that use "higher-risk" investment strategies yield greater average returns and greater standard deviations than funds that use more conservative strategies.

    You can simulate the effect of investing in these types of funds by using these values to set the "Equity Return" and "Volatility" variables. (In the WingZ version, full-scale on the Volatility slider represents a standard deviation of 60%. The standard deviation is displayed at the top right of the slider). Question: based on the mutual fund data list in this table, which of these fund types would allow the greatest annual income to be withdrawn without significant risk of going broke before year 35?

    Despite the greater risk of equities compared to fixed-return investments, the long-term average return is still better for equities. Life expectances are now long enough that many of us will spend 30 years or more in retirement, which most people would consider a long-term investment. For this reason many retired people keep a substantial fraction of their principal invested in equities.

  9. The effect of volatility depends on whether you take your income as a percentage of principal or as a fixed dollar amount. To demonstrate this, try the following experiment. Set the standard deviation to zero and the % income to zero. Then adjust the $ income until the principal is just exhausted in year 35. Now increase the standard deviation to 5% and note the large effect. Now set the % income to this same income and set the $ income to zero. Recalculate the spreadsheet and note the greater stability of your income in the later years. In effect, this strategy reduces your income when investment returns are low and increases it when returns are high, greatly reducing the chance that you will go broke.

  10. One way to reduce risk is to invest in a mix of fixed investments and equities. You can simulate this by setting the "Fraction in equities" somewhere between 0 and 100%. You will find, however, that diluting your equity investents with fixed-return investments will reduce your average annualized returns. For example, if you have a portfolio of 50% equities (returning 12%) and 50% fixed investments (returning 6%), then the overall return of this mixed portfolio would be 9% (half-way between 12% and 6%). Most financial investors recommend that retired investors should have 50-80% of their principal invested in equity funds.

  11. A better way to reduce volatility, while maximizing returns, is to construct a portfolio that allocates its assets between different fund types and sectors, for example, a mix of domestic and foreign funds, large-company, small-company, and mid-size company funds, industry sectors such as technology, pharmaceuticals, and financial funds, and funds utilizing different investment strategies such as "growth", "value", and "income" funds. The idea is that if some types of funds are doing poorly one year, other types of funds may be doing better in that year, which will help to smooth out returns from year to year. If each of the funds achieves good long-term returns on its own, then this strategy can reduce volatility without reducing the overall long-term returns of the portfolio. You can learn about the holdings, historical rates of return and volatility, and investment strategies of mutual funds by researching the funds on Morningstar (www.morningstar.com) or in Value Line (www.valueline.com) or by looking on the funds' own Web sites.

  12. Compensating for inflation. Because of improved medical care, people are living longer and longer. It's not unusual to live 20 or 30 years in retirement - or even longer. That is why this retirement income simulation has a 35-year time-line. Over this period of time, inflation (at the rate of 3-5% per year) is likely to decrease your purchasing power by a factor of about three. For that reason you can not expect to live easily on a fixed income over a long time period. To compensate for this effect, you should plan to increase your retirement income gradually over time, at the rate of 3-5% per year. If your retirement principal is invested at least partially in equity funds, and you are computing your income as a percentage of your principal (show above to be the safest mathod), then the best way to do this is to take an income which is less than the expected rate of return on your principal by the expected rate of inflation. For example, if you expect to obtain a 12% annual return on your overall protfolio, and you expect inflation to average 4%, then take 8% of your principal as income, leaving the remaining 4% to grow your principal (and your income) to compensate for inflation.

References

  1. Personal and Family Finance (http://www.nnfr.org/econ/famfin.htm)

  2. Mutual Fund Investors Center (http://www.mfea.com/)

  3. TIAA-CREF Library Series (Detailed, customer-friendly information on retirement, investing, Social Security and health care) (http://www.tiaa-cref.org:80/libra/index.html)

  4. Fidelity Investments, Retirement section (http://personal300.fidelity.com/retirement/)

  5. VanKampen Investor Library (http://www.vankampen.com/knowledge/educ/)

  6. Stock Market Indices (http://www.efmoody.com/investments/)

  7. A Primer of Asset Allocation and Portfolio Theory for Small Investors (http://www.efficientfrontier.com/BOOK/title.shtml)

  8. "The Mutual Fund Wealth Builder", Michael D. Hirsh, HarperBusiness, 1992.

  9. "The Quick and Easy Guide to Investing for Retirement", G. Liberman, A. Lavine, C. Janik, and R. Rejnis, Alpha Books, 1996.

  10. "How to Retire Young and Rich", J. S. Coyle, Warner Books, 1996.

  11. "How to Pick the Best No-load Mutual Funds for Solid Growth and Safety", Sheldon Jacobs, Irwin Professional Publishers, 1992.

  12. "How Mutual Funds Work", Albert J. Fredman and Russ Wiles, New Your Institute of Finance, 1993.

  13. "Die Broke: A Radical Four-Part Financial Plan", Stephen M. Pollan and Mark Levine, HarperCollins, New York, 1997.

  14. "Retirement Right: The Benefits of Growing Older", Nancy Levitin, Avon Books, New York, 1994.

(c) 1998, T. C. O'Haver, The University of Maryland at College Park
toh@umd.edu
Unique visitors since May 17, 2008: