In the order-disorder phase transition, there is a critical temperature, Tc, above this temperature, the system is disorder, below this temperature, the system is partly order. If the temperature is 0, the system is order.
In other word, we can say that in an order-disorder system, the Free energy
of system is not only related with the temperature, but also the order parameter,
¦Ç. At the temperature above the critical temperature, the free energy of
system reaches minimal at points that ¦Ç=0. And at the temperature below critical
temperature, the free energy of system reachese minimal at points that ¦Ç!=0.
So, our task is to find certain ¦Ç value at certain temperature. Moreover,
we could calculate the heat capacity change related with the phase transition.
I do this with matlab. And the result is very clear.
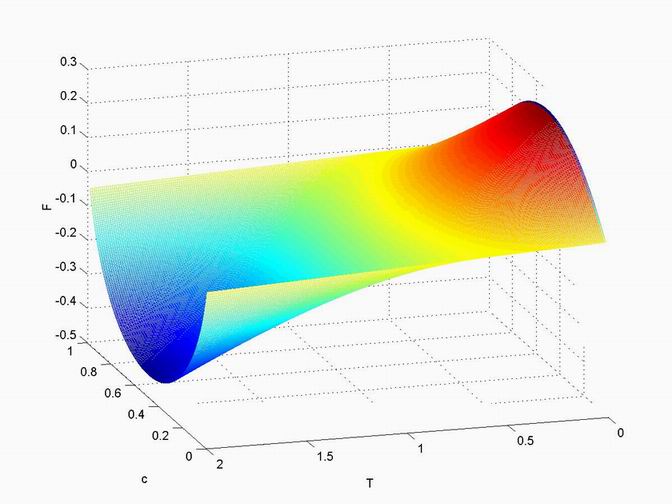
Below is the first picture of Free energy with order-disorder phase transition.
In this graph, c means ¦Ç. Source code in Matlab is available via this link

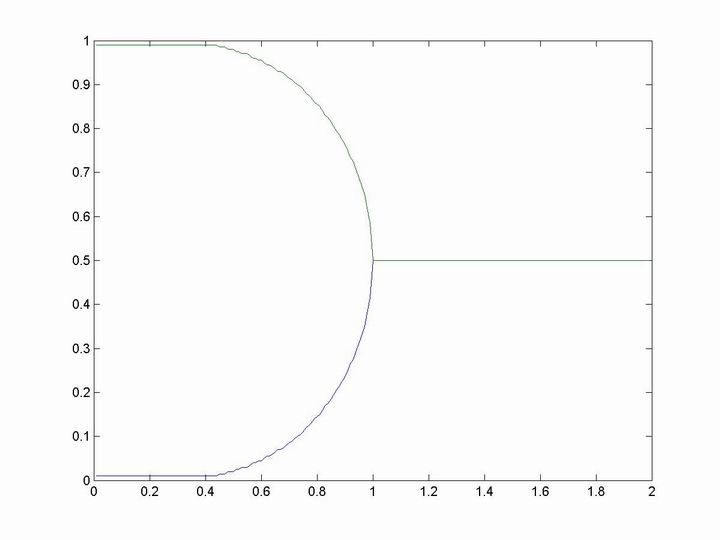
Below is the curve that shows the ¦Ç and T that produce the minimal free
energy. The source code in Matlab is availible via this link.

Here we show the lowest free energy in 3-D condition. And actually, the
illustration above is top view of the picture below. Source code in Matlab
is available via this link.

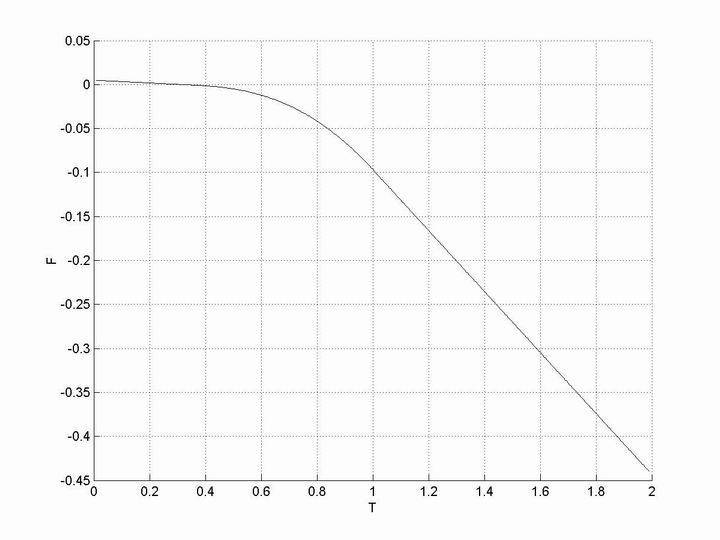
And the free energy-temperature curve is here. This picture is the side
view of the picture above.

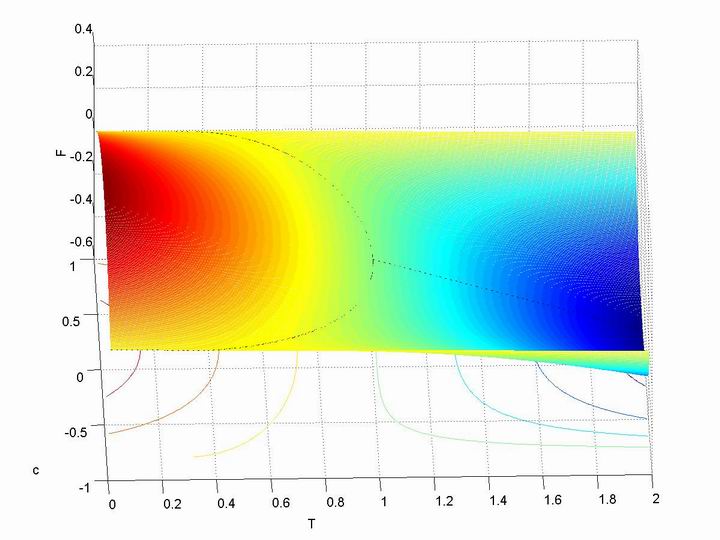
At last, I over impose the lowest free energy path onto the free energy
surface. I believe everybody has a better understanding to order-disorder
transition with these pictures.Source code in matlab is available via this
link.
