ENSE 627 QUALITY MANAGEMENT IN SYSTEMS
Spring 1998
Homework Assignment 5, Due 6:30 pm, March 4, 1998
Chapter 3. Statistical Process Control
3.9 Assignment Problems ( Page 3-65 )
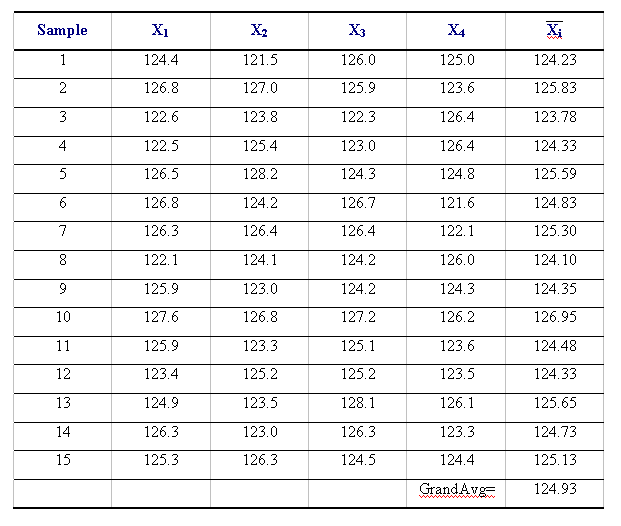
3-4 Fifteen (15) samples have been taken from a product line. The sample size is
4. All the measurements taken are listed below. Construct an X-bar Chart (3s limits)
and R-Chart. Plot the data on these two charts. Is the process in statistical
control?
Experiment:
1. Take a deck of cards and shuffle the deck.
2. Then pick a card and record its number.
[ace=1, numbers = face value, jack=11, queen=12, king=13]
3. Replace card in deck. Re-shuffle deck.
4. Repeat steps 2&3 for a total of four times. These data will be x1, x2, x3, x4,
and comprise the first sample.
5. Repeat until 20 samples (sets of 4) have been recorded.
6. For each sample, calculate and record the mean value on the data table.
7. Use data from table to calculate UCL, LCL, X, for X Chart and
UCL, LCL, R, for R Chart.
8. Construct X chart and R chart.
9. Plot data from table onto charts.
10. Examine charts and record conclusions.