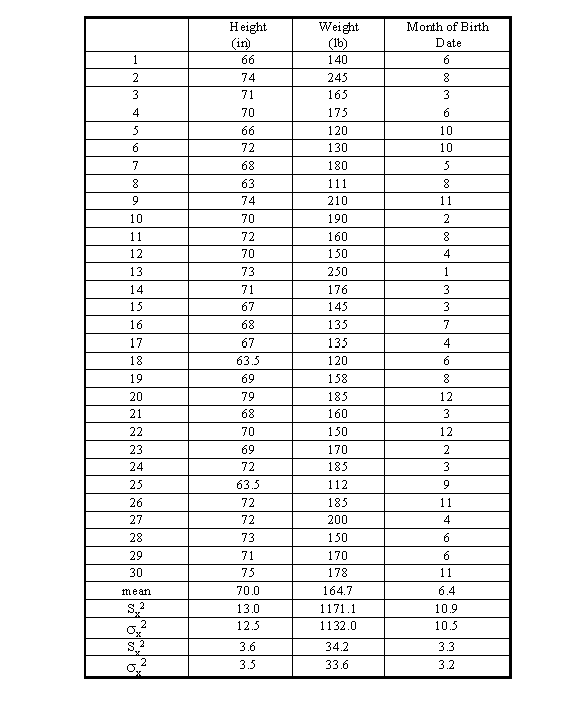
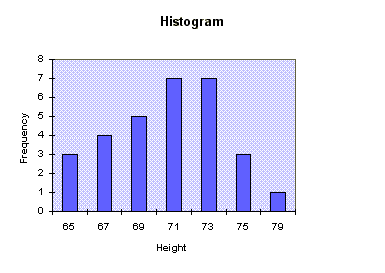
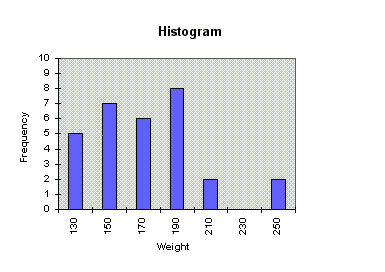
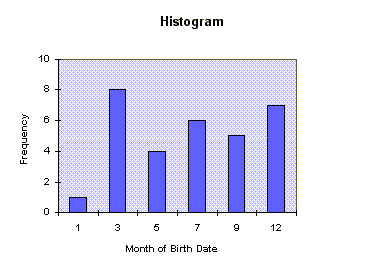
2.4.1
Using the three sets of data about the height, weight, the month of
the birth-date of a group of specific students in a specific class, do
the following:
(1) Calculate the mean, variance, and standard deviation for each data set.
(2) Construct three histograms for the three data sets.
(3) By examining the constructed histograms, interpret the numerical values of the mean and standard deviation you have obtained.
It is suggested that you use a computer to do problem 1. Any spread sheet program will be useful.
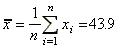
(1) Calculate the mean, variance, and standard deviation
for each data set.
(2) Construct three histograms for the three data sets
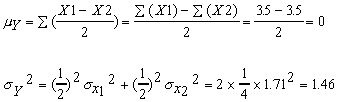
(1)
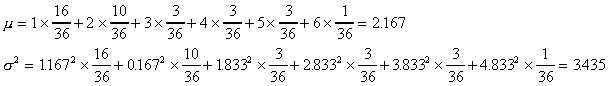
(2)
(1) Determine P(Z>1.96); (2) Determine P(-2<Z<2); (3) Determine P(0<Z<3).
(1) Determine P(Z>1.96)
P(Z>1.96)=1-P(Z<1.96)=1-0.9750=0.0250
(2) Determine P(-2<Z<2)
P(-2<Z<2)=2P(0<Z<2)=2(P(Z<2)-P(Z<0)=2*(0.9772-0.5)=0.9544
(3) Determine P(0<Z<3)
P(0<Z<3)=P(Z<3)-P(0<Z)=0.9987-0.5=0.4987
P(1100<X<1200)=P(X<1200)-P(X<1100)
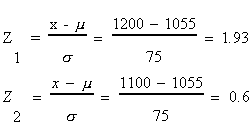
P(1100<X<1200)=P(0.6<Z<1.93)=0.9732-0.7257=0.2475