


Climate Change in the NMNH
11/22 Washington, D.C.:
My first stop in the museum was a new exhibit named Cellphones: Unseen Connections. This area examined the origins, history and impact of cellphones.
The hall used an interactive board game medium that involved the player in making decisions about their phone. This pertained to things like repairing a phone instead of buying a new one and, in situations where you lose the ability to use your phone, what would you do? The technique has a good design but I didn’t find the prompts to be that engaging or something that would educate someone about use, origin, and disposal of phones.Another presentation technique was comics across the walls depicting different aspects of phones and changes they brought about. One that was particularly interesting was one depicting reactions to new technologies throughout time. Whether it was writing in 370 BCE, books in the 17th century, or the telephone in the 19th century, humans have always been anxious about new technologies.I thought this method was engaging and entertaining–it drew my eye in the hall and was a comedic and approachable way to gain new insights.
Throughout the hall were display cases showing earth materials used in the production of cellphone technology. Various presentations displayed examples of what the technology inside the phone looks like, where it is sourced, the people that were involved in getting this source, and the disposal of these materials. Exhibits stressed the rarity of these metals and how mining and excavation must take place around the globe to retrieve them. Other sections showed images of people involved in the mining process with personal accounts of the dangers and risks involved in the process. There were also displays discussing how these materials are never really disposed of and what happens to phone parts when they are discarded. E-waste is harmful for the environment and occurs across the globe. Charts showed the carbon footprint of creating phones which is a whopping 123 pounds of carbon emissions per phone and how that adds up.
The exhibit discussed the technological impact of cell phones–the growth of data centers as data traffic grows. Engineers need to find methods to create increasingly more efficient and effective server systems to support the demand. Museum staff showed models of data centers’ internal machines to manage this data. There were several social impacts focused on like the objects we used prior to and due to the creation of cellphones, accompanied by a display showing these objects. Objects like maps and encyclopedias and dictionaries have become far less prevalent within society as a result of cell phones, but methods of self expression and tools have been crafted solely due to the creation of cell phones (things like special bags or phone cases). Another social impact displayed was comics discussing how phones can warp our perception of ourselves, showing how easy it is to enhance photos with filters and how social media is a constructed reality that may often be harmful to our mental health.
I also visited the Earth information center created in cooperation with NASA. Within the Earth Information Center (EIC) were several displays meant to educate the public on how we visualize changes across the globe. One of which was satellite imagery that changed if a person was standing in front of it, this allowed the view to change what they were seeing to past and present images of regions affected by the climate. Another was a large screen that rounded at the end of the hall, it cycled through various screens and one of which depicted currents throughout the ocean showing how heat moves across the globe through warm currents.
I believe the hall was decently effective in explaining environmental data and issues. The exhibit shows blurbs of information that are accessible reading for museum guests. It shows what climate change looks like in the US with specific examples like flooding in the New York subway and drought in the southwest to make it a reality for museum patrons. Interactive elements involve guests in the methods scientists use to examine the changing climate like monitoring Earth's vital signs (carbon dioxide, ozone, sea level) and satellite imagery of environmental events. It shows how climate change, urbanization, and environmental disasters have influenced landscapes using satellite models. Some of the parts weren’t very engaging but there was a lot of information present.
Walking through the David H. Koch hall of human origins, there were displays showing how humans have impacted the environment. One of which discussed animal domestication with a display of animal figures, discussing how the population of popular livestock had increased from 2.7 to 4.1 billion in population from 1961 to 2004. Another discussed agriculture which explained surprising details like how ¼ of the Earth is used to grow crops and fewer than 20 plant species produce most of the world's food, explaining how humans have expanded the land used to sustain a growing population off of a smaller variety of food sources. This display showed figurines of food items.
I would agree with the claims made by critics of this hall that it de-emphasizes the human impact on the environment and climate. Much of the hall does not discuss how humans have directly impacted the environment and the portion that does touch on this only says that “during the period in which humans evolved, Earth’s temperature and the amount of carbon dioxide in the atmosphere fluctuate together”. The blurb hardly puts the blame on humans, rather poses humans as suffering from an unfortunate, inevitable situation.
Exhibits in the Sant Ocean Hall also discussed climate change and human impact. Interactive videos discussed some of this information:
Video 1: Deep Ocean Creatures (Office of Ocean Exploration and Research)
This video highlights the exploration of deep-sea environments near Hawaii, showing real footage of unusual and rarely seen organisms. The audio includes biologists identifying and describing newly observed or puzzling deep-ocean species as they appear on camera. The main data provided consist of observational descriptions of creature behavior, appearance, and habitat in real time. Is it understandable? Yes. The video is very accessible for a general visitor because it relies on visuals and plain-language narration. Even though the organisms are scientifically interesting, the explanations are simple and focused on what the viewer can see onscreen.
Video 2: No Sunlight, No Problem
This video explains the diverse habitats that exist in deep coastal ocean environments, especially methane seeps. It describes how microbes convert chemicals, rather than sunlight, into energy, forming the base of entire ecosystems. The video explains that methane seeps form when dead marine organisms decompose and release methane gas below the sunlit zone. It also contrasts methane seeps with hydrothermal vents and notes their ecological value: they support commercially important fish species and help keep methane, a greenhouse gas, from entering the atmosphere. Is it understandable? Mostly, but less so than the first video. While the visuals help, the ecological and chemical processes (like chemosynthesis, methane cycling, and the comparison to vents) are more complex and use terminology that may be unfamiliar to general visitors. Without background knowledge, some viewers may not fully grasp how microbes convert chemicals into energy or why methane seeps matter for climate and fisheries.
A “Human Connections” exhibit focused on human impacts on the ocean. One of the issues addressed was pollution, showing images of marine animals with their lives impacted by pollution. It also showed plastic that was found within an Albatross chick and discussed how marine animals often mistake plastic trash as food. These displayed certainty would encourage people to be concerned about the topic as it showed emotional imagery. Another display talked about how climate change impacts the ocean–rising temperatures and sea levels alongside unpredictable weather could cause the extinction of many species. It encouraged viewers to be more concerned by stressing how it impacts humans as well and the severity of the increase in carbon, rising more drastically than it ever has in the past.
The 7 Rs
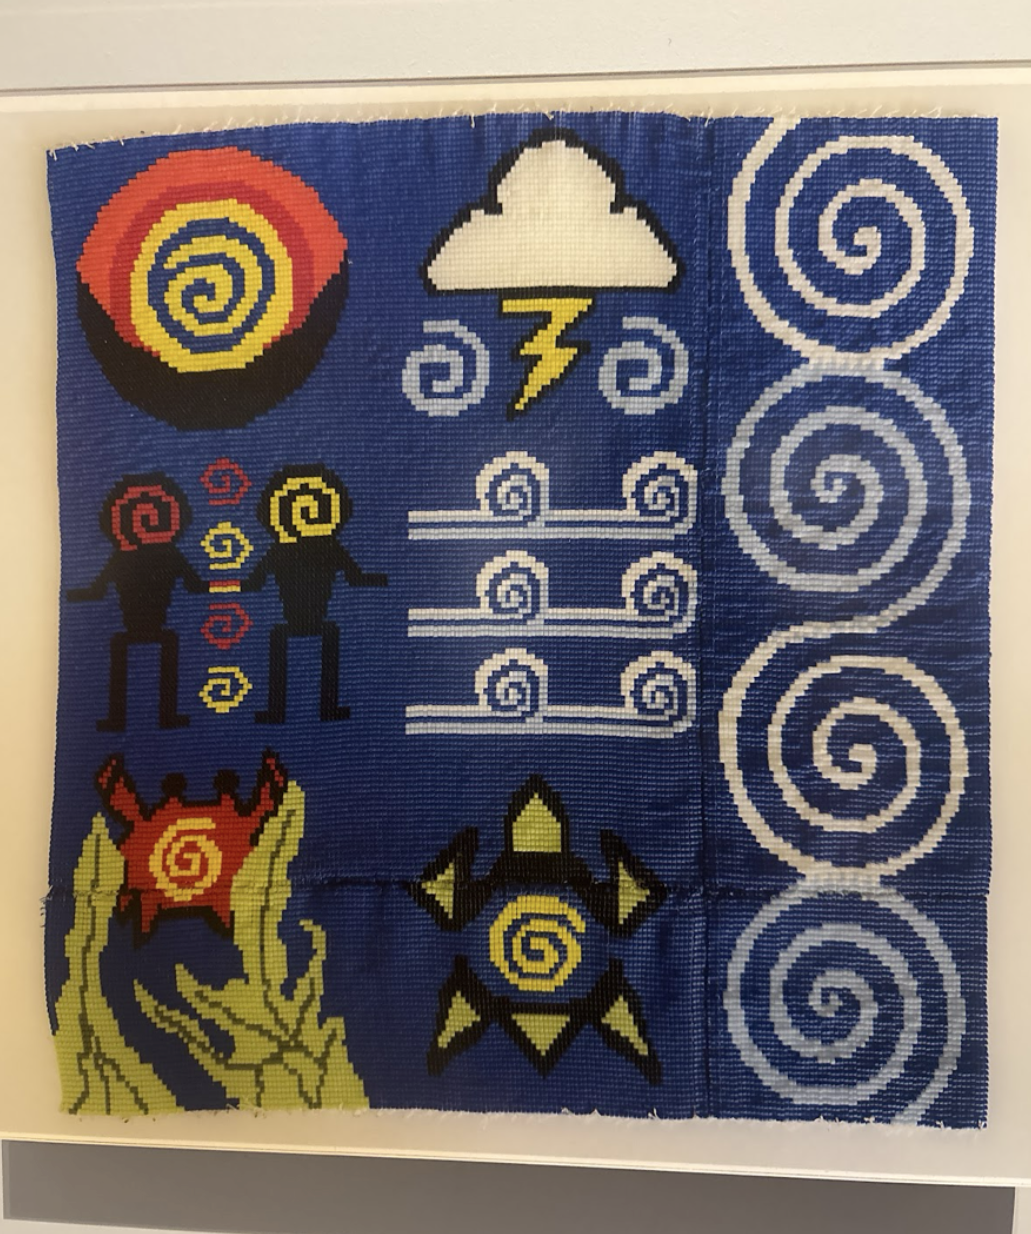
Within the hall was a gallery with art created by artists' reflection on climate change. One of the most notable to me was titled "The 7 Rs" and was created by Lara A. Jacobs, Coral Avery, Kathryn Champagne, Rhode Grayson in Oregon in 2022 using beadwork. The piece shows the seven Rs of the indigenous value system: respect, relevancy , reciprocity, responsibility, rights, reconciliation through redistribution, and relationships. The artwork was meant to stress the importance of centering indigenous voices in sustainable practices to reduce harm on marine systems.
Within the David H. Koch Hall of Fossils were several presentations that we can look at to understand climate change and how we look at the environment historically. Within the hall were dioramas that had reconstructions of environments at different points in prehistory. These had displays that compared the carbon dioxide, temperature, and sea level to modern times. One of these dioramas displayed a scene from the Paleozoic, 299-270 MYA. The scene took place in north Texas while the supercontinent of Pangea still existed; it explains that CO2 levels fluctuated from less than today to 3 times higher, the temperature was 8 degrees lower to 12 degrees higher than today on average, and the global sea level was 40-80M higher. Another display showed another time during the Paleozoic–320 to 299 MYA when the CO2 levels were fluctuating near the level it is today, temperatures were 6 degrees lower to 4 degrees higher than today, and the global sea level was 0-40 M higher. These dioramas are effective in helping visitors visualize prehistoric environments and understand historical climate change. By combining visual reconstructions with comparative climate data, they make abstract concepts like temperature fluctuations, CO₂ levels, and sea level differences more concrete. Even a general visitor can grasp how Earth’s climate has varied dramatically over geologic time.
Also within the hall were displays showing climate changes past and present. These displays used fossils to detect carbon levels in the atmosphere to learn about the temperature at the time. It analyzed a time 56 million years ago, how ecosystems became hotter and dryer while plants became less nutritious. Because of this animals got smaller. Using examples from past changes due to carbon increases, the display informs us on possible outcomes of current climate change. Carbon dioxide and temperature are rising faster now than they were then, leading to frightening possible outcomes.