

Monoprotic Titration Curve

Click to see larger graphic
[OpenOffice and Excel Versions]


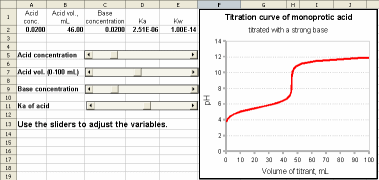
A model of the titration curve of a weak monoprotic acid titrated by a strong base. You can change the titrant concentration and the pK, volume, and concentration of the acid by typing in their values at the top left of the screen or by using the sliders. (I find the sliders easier to use in a darkened lecture hall where I can't see the keyboard easily).
A dynamic model like this allows interactive investigation of such questions as: "What is the weakest acid that gives a discernible inflection at the endpoint?", or "Can titration be used at arbitraily low concentration levels by using a dilute titrant?", or "Is the inflection point always exactly at the equivalence point?"
Download link: titration.wkz;
Wingz player application and basic set of simulation modules, for
windows PCs or Macintosh
Other related simulations:
Triprotic Titration Data Analysis
Ca Acid conc., M   (cell D2)
Va Acid vol., mL   (cell D2)
Cb Base Conc. ,M   (cell D2)
Ka                 (cell D2)
Kw                 (cell E2)
StartpH            (cell F2)
EndpH              (cell G2)

pH range: StartpH to EndpH in 40 steps
H = 10^-pH
Vb = -Va*((H^3+Ka*H^2-(Kw+Ka*Ca)*H-Kw*Ka)/
   (H^3+(Ka+Cb)*H^2+(Ka*Cb-Kw)*H-Ka*Kw))

Graph plots Vb on horizontal(x) axis and pH on vertical (y) axis.

A model of the titration curve of a weak monoprotic acid titrated by a strong base. You can change the acid concentration, acid volume, base concentrations, and Ka of the acid by using the sliders. You can even change the Kw of water in cell E2. Assumptions: Activity effects are ignored. The pH is measured correctly without error at the ends of the pH range.
View
Equations (.pdf)
Download spreadsheet
in OpenOffice format (.ods)
Download spreadsheet
in Excel format (.xls)
Note: to run the OpenOffice (.ods) spreadsheets, you have to first download the OpenOffice installer (download from OpenOffice), then install it (by double-clicking on the installer file that you just downloaded), and then download my spreadsheets from this page. Once OpenOffice is installed, you can run my spreadsheets just by double-clicking on them. Note 1: Don't use version 3.1. There is a bug in OpenOffice 3.1 that causes bad x-axis scaling on some of my graphs. The problems does not occur in version 3.0 or in the most recent version 3.2. Note 2: Downloading these files with Interent Explorer will change the file types from ".ods" to ".zip"; you will have to edit the file names and change the extensions back to ".ods" for them to work properly. This problem does not occur in Firefox or in Chrome.