Unit III - Part C
3.5 Power Models
Exponential equations and graphs are among the most important non-linear
models. But many important non-linear patterns are modeled better by equations
and graphs of other types. Perhaps the second most common simple curves
are those that are based on equations with the form y = A(x), for various
specific values of A and b. Models of this type, where values of the input
variable are all raised to some fixed power, are commonly referred to as
power models.
The patterns of growth produced by power models can be used to calculate
and explain patterns of change in a variety of familiar situations. The
next several problems explore only a few of the many possibilities.
1. In many engineering and construction projects, the first step is building
a scale model of the proposed machine or structure (either on paper, on
a computer screen, or in real materials). Then plans have to be scaled up
to real size. For example, the New York City parade on Thanksgiving Day,
sponsored by Macy's Department Store, is famous for its display of very
large balloons in the shape of cartoon characters. Suppose that a scale
model is made of intended real size.
(a) If the model is 2 feet tall, how tall will the balloon be?
(b) If the model has a belt that is 1.5 feet around its waist, how long
will the belt be on the large balloon?
(c) If the model has a surface area of 6 square feet, how many square feet
of material will be required to make the large balloon?
(d) If the model holds 2.5 cubic feet of air, what will the real balloon's
volume be?
(e) How would your answers to questions (a) - (d) change if the model was
or or of real size?
2. If your answers to the various parts of question 1 are typical, you probably
got (a) and (b) correct without much hesitation; you probably also puzzled
over questions (c) and (d). To help make an informed guess about the answers
to these questions about area and volume, it helps to do some exploration
of growth patterns with a simpler figure. The sketch that follows shows
a cube--a box with all edges the same length.
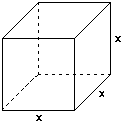
(a) Complete the following table of sample girth, surface area, and volume
measurements and describe the different patterns of change in the rows:
Edge Length           1    2      3      4      5
Girth
Surface Area
Volume
(b) What rules will give the girth (distance around), surface area, and
volume of any such cube? How do the differences in those rules help to explain
the differences in rates of growth for the three size measurements?
(c) If the edges of one cube are twice as long as those of another, how
are the girth, surface area, and volume of the two cubes related? What if
the edges of another cube are three times as long as those of the first?
What if the edges of yet another cube are 20 times as long as the first?
(d) How do your answers to (c) suggest answers to questions 1(c) and 1(d)
above?
3. One of the most famous scientific examples of a power model is the relation
between time and distance for objects in free-fall subject to gravity. For
example, if you were to drop a golf ball off the top of one of the campus
high-rise dorms, the relation between elapsed time (in seconds) and distance
fallen (in meters) is given approximately by the equation d = 5t. This model
does not account for the effect of air resistance, but, for modest time
and distance values, that simplification is not too much of a problem.
The basic quadratic power relation between time and distance was
actually known in the 15th century (if not earlier), when devices for measuring
time were really very crude. To study the question, Galileo came up with
an ingenious idea for an experiment that "slowed down" gravity
while retaining the fundamental pattern of its effect. He suggested collecting
(time, distance) data as a ball rolled down a smooth ramp, somewhat like
that pictured in the following sketch:

(a) Use a stopwatch to collect (time, distance) data for a table like this:
Time in seconds
Distance in meters  0.50   0.75   1.00   1.25   1.50   1.75   2.00   2.25   2.50
(b) Enter the data in your calculator's stat lists and get a plot of the
(time, distance) data. Then experiment with various potential modeling rules
of the form
y = Ax, testing each by plotting it over the data to see how it fits.
(c) Use the STAT CALC command PwrReg (for power regression) to get what
the calculator suspects is the best fitting model of the power type and
compare it to your data.
(d) Try LinReg and ExpReg to see what the calculator suggests about possibilities
of these models to fit the data pattern.
Think about how scientists 500 years ago might have done
this experiment without stopwatches!
Scientific research often produces patterns of data that are described well
by power expressions other than the basic quadratic (y = Ax) and cubic (y
= Ax) models. In fact, it often turns out that a relation is best modeled
by a rule with fixed exponent that is not a positive whole number.
When variables are related by equations like y = Axor y = Axit is customary
to say that y varies directly with x or with the square of x. In
cases where y is related to x by a rule like y = or y = we say that y varies
inversely with x or with the square of x. These relations are also considered
power models because, using negative exponents, they can also be written
in the general form y = Ax. For example, y = is equivalent to y = axand
y = is equivalent to y = ax. Some very important relations between variables
fit this sort of inverse power variation pattern.
4. Use your calculator to explore the patterns of change implied by inverse
and inverse square variation and compare them to models of linear and exponential
decay.
(a) y = (b) y = (e) y = 10 - x (d) y = ()
The next three problems involve situations that are modeled by equations
of inverse square variation. Use the what you've learned about the pattern
of change implied by such variation in (4) to draw some conclusions about
how the application situations will behave.
Hearing and sight--whether by humans, animals, or robots--both depend on
our ability to find patterns in sound and light energy that hits our ears
and eyes. To avoid damage to our ears and eyes, we are advised to keep away
from the loud noises of machinery or radios and close to good lights for
reading and detailed work. The intensity of sound and light energy is related
to our distance from the source--the more distant the source, the lower
the sound or light intensity.
5. The illumination from a light source is inversely proportional to the
square of distance of the light from its target. For example, if a flashlight
is listed with a rating of 160 lumens, it provides illumination at a distance
of d feet would be given by B = lumens per square foot.
(a) How will intensity of the flashlight change as distance increases from
1 to 10 feet? How is that pattern shown in tables and graphs of (distance,
illumination) data? How is it predictable from simply looking at the equation?
(b) What does the inverse square pattern of light intensity say about the
use of flash lighting in photography?
6. The intensity of sound is measured by several different scales. One that
uses units of power is watts-per-square-meter. It is a measure of the pressure
that a sound forces on your ear. For a stereo system with its volume turned
up very high, the intensity of sound is a function of the hearer's distance
from the speakers that can be modeled by an inverse square relation. For
example, if a radio has its volume turned up very high, its sound intensity
as a function of distance might be given by an equation like I = where distance
is in meters from the speaker to the listener's ear.
(a) How will the intensity of sound vary as distance increases, and how
is that pattern shown in tables and graphs of the (distance, intensity)
relation? How is it predictable from simply looking at the equation?
(b) What does the inverse square law for sound say about choice of seats
in a large university lecture hall? How will acoustics of a room alter the
pattern of the simple inverse square law?
7. The gravity that pulls flying objects toward the surface of the earth
is the same force that holds the moon and NASA satellites in their orbits
around the earth. The force of attraction (F) between any two objects is
a function of the distance (d) separating the centers of those objects,
with rule in the form F = .

(a) What does the form of the rule tell you about the way gravitational
force on the astronauts in a space shuttle changes as that shuttle moves
into higher and higher orbits around the earth?
(b) How does your answer to (a) explain the apparent "weightlessness"
of astronauts in space?
(c) Why doesn't gravity simply pull the satellite back to earth once its
booster rocket engines cut off?
3.7 Periodic Models
Linear, exponential, and power models are the fundamental algebraic tools
for describing and reasoning about patterns of variation in a wide variety
of scientific, technical, business, and social situations. But there is
another very common family of patterns that require new sorts of tools for
mathematical modeling--the phenomena that exhibit periodic or cyclical variation.
The most common places where such patterns of change occur are in physical
or biological systems where some variable of interest changes over time.
The most common shape of those patterns is depicted in the graphs referred
to generically as sinusoids.
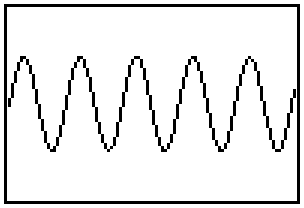
Think About This Situation
You've all undoubtedly seen graphs with this general shape many times before
and you probably know that the mathematical theory that provides a basis
for those graphs is trigonometry.
1. What patterns in the graph make the labels periodic or cyclic
variation seem
appropriate?
2. How does the pattern of change in this graph differ from linear, exponential,
and power models of change studied earlier?
3. What different situations can you think of where some variable changes
over
time in a periodic or cyclic pattern?
The mathematical ideas used to model periodic or cyclical patterns of change
have very ancient roots in topics of geometry that might seem at first to
have very little to do with the phenomena that produce sinusoidal graphs.
The next three problems illustrate, in very brief form, some of the key
ideas behind the subject that is the basis of models for periodic change.
1. One of the oldest, but persistently impressive, applications of geometric
ideas is the use of sun shadows to deduce distances of otherwise unmeasurable
objects. One classic problem is often posed with stories like this: How
could you estimate the height of one of the light towers at Byrd Stadium,
without climbing the tower?
(a) Generate as many different ideas as you can for solving this problem.
(b) Find at least one method that requires only a ruler and a sunny day.
2. Another classic problem related to (1) is often posed with stories like
this: How could you estimate the length of a support wire that is to
be attached to a radio tower and the ground and so that it meets the ground
at an angle of 70at a point 50 feet from the base of the tower?
(a) Generate as many different ideas as you can for solving this problem.
(b) Find at least one method that requires only a ruler and protractor.
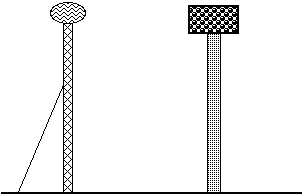
3. The simplest methods for solving problems (1) and (2), except for asking
someone who already knows the answers, involve some elementary facts about
similar triangles. What are the assumptions required in each case?
The two problems involving inaccessible points on towers both involved right
triangles and the general principle that in two similar right triangles
the ratios of corresponding sides will always be the same. Ancient scientists
and mathematicians knew very well that the shape of a triangle depends on
the measures of its angles. So if we know the angle measures in a right
triangle, we know the ratios of its sides. Furthermore, in a right triangle
one angle must be 90and the sum of the other two must be 90, so knowing
the measure of one of the acute angles we can deduce the ratios of the sides
to each other.
For the problem on attaching support wires to a radio tower, we could draw
a right triangle with one leg 50 and the adjacent acute angle 70. We could
then measure the hypotenuse and scale up our answer to the real situation.

But mathematicians, being uneasy about scale drawing as an accurate method
of calculation (imagine the effect of errors if the scale drawing is only
a very small replica of the real thing), have chosen to produce tables that
give very accurate ratios of corresponding sides in right triangles for
any possible acute angle combinations. To serve the different kinds of information
that might be available in different situations, they focused on three key
ratios:
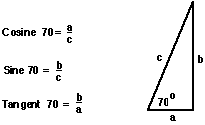
These three ratios are now available in nearly every scientific and graphing
calculator at the press of a button. Knowledge of one acute angle and one
side in a right triangle permits deduction of the other sides and angles.
Using the inverse sine, cosine, and tangent buttons, one can deduce
angle size from side ratios.
4. To see the ways that one can use the trigonometric ratio information
in reasoning about triangles, solve each of the following problems. All
information is given with reference to right triangles labeled in the standard
notational convention of geometry.
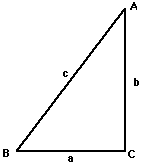
(a) If angle B is 40and side c is 30 cm, what is the measure of angle A
and the lengths of sides a and b?
(b) If angle B is 70and side a is 20 cm, what is the measure of angle A
and the lengths of sides b and c?
(c) If angle A is 65and side a is 75 cm, what is the measure of angle B
and the lengths of sides b and c?
(d) If the length of side a is 25 cm and side b is 40 cm, what are the measures
of angle A and angle B and the length of side c?
(e) If the length of side a is 35 cm and the length of side c is 50 cm,
what are the measures of angles A and B and the length of side b?
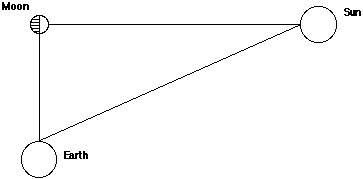
5. Ancient scientists very cleverly used trigonometric ideas to do some
calculations about distances from Earth to really inaccessible places like
the Moon and the Sun. In one technique, an Earth-bound observer waits for
a time when the sun and moon were both visible in the sky and exactly half
the moon was illuminated by the sun, a situation like that pictured at the
top of the next page.
(a) What could you deduce about distances from Earth to Moon and Sun in
such a situation?
(b) Suppose you knew that the distance from Earth to Moon was about 260,000
miles (there is some evidence that this was estimated early from eclipse
data and other methods). How could you use that information and some other
measureable facts to estimate the distance to the Sun from Earth?
(c) Using what we now know about Earth ... Sun ... Moon distances, what
angle measures would be observed in the situation? (Earth to Moon 260,000
miles and Earth to Sun 93,000,000 miles)
The use of sine, cosine, and tangent ratios to calculate angles and distances
in right triangles probably seems a long way from graphs of periodic variation.
But the connection can be made by considering distances and angles in circular
motion. The following sketch is intended to depict something like the sort
of images you see on weather or air-traffic radar screens.
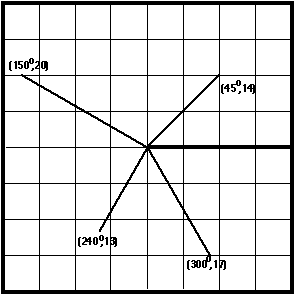
The ray from screen center to the right edge of the screen provides a base
line for measuring angles along which radar blips are found. Each blip then
can be located by a pair of numbers giving angle and distance. The angles
range from 0 to 360.
6. How can the sine, cosine, and tangent ratios be used to calculate (x,y)
coordinates (on a map these will be directions east-west and north-south
of the center) for the blips located by angle and distance on the preceding
diagram?
Your reasoning in solving problem 6 should lead to the conclusion that it
is possible to define the sine, cosine and tangent ratios for any angle
from 0 to 360. Furthermore, if we graph those ratios, we get patterns like
this:
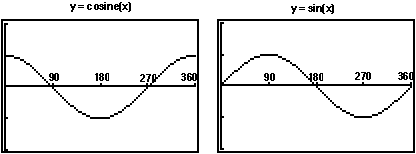
7. Follow the rotating radar beacon to explain why the shapes of these graphs
are what one could reasonably expect for patterns of change in cosine and
sine ratios.
8. Now imagine that the rotating radar beacon keeps on going and the angles
are measured in angles from 360to 450and 540and so on. How will the graphs
of cosine and sine ratios extend as time passes and the radar beacon passes
through greater and greater angles?
If one uses the image of a rotating radar beacon to think about cosine and
sine ratios for "angles" beyond 90, the original notion of ratios
in right triangles leads in a natural way to periodic graphs that you recognize
as sinusoids. In particular, if we think of increasing angle measure as
a measure of time passing, we get the desired models of periodic change
over time.
In many scientific applications of periodic models, the rotation is measured
not by degrees of angle, but by radians (distance around a circle
of unit radius). Thus to make use of cosine and sine functions in your graphing
calculator, you will have to first specify Radian or Degree on the settings
and then adjust the window settings accordingly.
9. Use your graphing calculator to study the graphs of these variations
on y = sin x . In each case, explain why the result is what you could reasonably
expect.
(a) y = 2 + sin x (b) y = 2(sin x) (c) y = sin (2x)
Conclusions and Connections
This very brief sketch of the foundations of periodic models only scratches
the surface of the issues involved. However, we hope you have some glimpse
of the subject!
1. How would you describe to someone not familiar with trigonometry what
periodic or cyclic variation is?
2. What situations would you mention as examples of periodic variation?
3. How would you explain the connection between right triangle trigonometry
and periodic graphs?
4. What are the most striking differences between periodic models and linear,
exponential, or power models?
3.8 Combinations and Systems of Models
Linear, exponential, power, and periodic models capture the essential patterns
of change in a huge number of important situations. However, to accurately
describe and reason about the specific conditions in any given problem,
it is often necessary to modify or combine those primary models to give
more complex and accurate representations of the relations among variables.
The required combinations often involve addition, subtraction, multiplication,
or division of two basic model forms.
For example, Newton's Law of Cooling from physics predicts that when a hot
liquid at 90C is poured into a cup or pan that is exposed to a cooler ambient
temperature like 20C, the (time, temperature) graph will have the following
shape.

You've encountered at least two different kinds of algebraic models that
look similar to this graph--for example, exponentials like y = 0.5and inverse
powers like y = or y = . But neither case quite fits the bill since the
graph looks to be approaching a lower limit of y = 20.
The basic strategy for building a model in this case, and for many others
like it, is to look for a modification or combination of things we know.
Since the given graph looks like a standard exponential or inverse variation
model shifted upward by 20, it makes sense to try either y = 20 + 0.5or
y = 20 + . If you test these two possibilities, you'll see that we're on
the right track. Only some fine-tuning is needed to get y = 20 + 70(0.5).
The inverse variation models don't quite fit, because they are not defined
for x = 0.
Other combinations of linear, exponential, power, and periodic models are
very commonly encountered. In each case you can try again to find ways to
piece together a combination of basic rules to give the needed model. For
example, consider the way that a linear and a quadratic power model can
be added to give a parabola that might be useful to fit a basic quadratic
pattern with additional conditions.
y = 2x + 6 y = -x 2
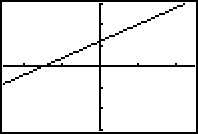

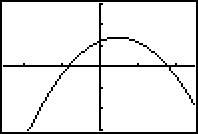
When combined by addition, these two rules give the quadratic model y =
2x + 6 - x2 with the following graph.
While it is probably not critical for you to develop great skill in building
algebraic rules for all such combinations of basic models, it is important
to realize that the world does not always display patterns that can be modeled
with simple rules. Furthermore, experimenting with combinations of models
can be a good way to review the patterns that characterize each basic family.
In the following problems you are given graphs that tend to be typical of
several different situations. Use what you know about linear, exponential,
power, and periodic models to devise combination models that seem to fit
the more complex conditions given. Then test and refine your ideas with
graph experimentation on your calculator.
1. Although Newton's Law of Cooling seems to refer only to the way hot objects
cool to lower ambient temperatures, there is a comparable law of warming
to cover the case when a cool object is introduced to a warmer environment.
The graph will look something like this:
(a) What does the shape of this graph imply about the pattern of temperature
change over time?
(b) What types of basic algebraic models have shapes somewhat like this?
(c) What combination model can you design to match the pattern here?

2. In businesses that manufacture products, there is a cost factor called
a learning curve. The idea is that as production proceeds on an item, the
company gets smarter and reduces its average cost of producing each item.
A typical pattern looks something like this:
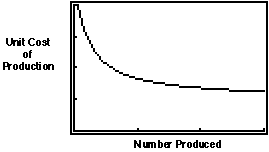
(a) What does the shape of this graph imply about the pattern of production
cost change as the company gets experience in manufacturing?
(b) What types of basic algebraic models have shapes somewhat like this?
(c) What combination model can you design to match the pattern here?
3. In psychological studies of learning and memory, if a subject is given
the challenge of memorizing a list of words, the typical pattern of learning
follows a graph like this:
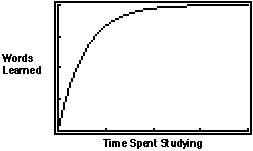
(a) What does the shape of this graph say about the pace of learning as
time is spent on the task?
` (b) What combination of basic model types might be involved in this situation?
(c) What single equation gives a graph that looks like this?
4. When a diver jumps off a high diving platform, his or her height above
the water is a function of time into the dive. The graph of that (time,
height) relation is going to be quite close to that pictured here:
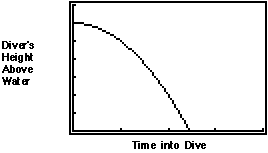
(a) What does the shape of this graph say about the rate at which the diver
falls toward the water?
(b) What combination of basic model types might be involved in this situation?
(c) What single equation gives a graph that looks like this?
5. The basic graph of sin(x) or cos(x) gives the familiar sinusoid pattern.
But many periodic phenomena need models that are modifications of those
simple cases. For example, if one graphs the number of daylight hours in
the day here in Maryland through the seasons of several years, you get a
graph like this:
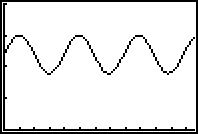
(a) What does the shape of this graph say about the pattern of change in
daylight hours as time in a year passes?
(b) What variation on sin(x) might be a good match for the pattern in this
situation?
In addition to combining basic algebraic models to match specific problem
conditions, it is often the case that a problem or decision-making situation
involves the interaction of several relations among variables. In those
cases it is often helpful to study tables or graphs of the variables simultaneously
by graphing two relations on a single screen or tabling several different
y lists as a single common input variable x changes. The next two problems
involve just this kind of situation.
6. When summer approaches, most high school and college students start thinking
about finding summer jobs.
              Want Ads -- Help Wanted
Fast Food --Restaurant     Natural Lawns -- Summer
seeks summer help;         help needed.  $5 per
cashiers, cooks,           hour. No prior
cleanup; 20 hours per      experience required.
week all shifts            Call 24 hours
available.  Call 234-5678  1--800-314-1589.
Camp Staff--Summer         Child Care -- Tiny Tots
play-ground and camp       Day Care Center seeks
counselors age 15 or       summer help for child
higher.  Good pay and      care positions.  Hours
lots of fresh air.  Call   7-5 four days per week.
987-6543                   Send references to Box
                           Q.
In some cities and towns there is work available in shops and restaurants
and in seasonal service jobs like lawn mowing or life-guarding. But there
often aren't enough jobs to go around.
To help students find summer work--both to earn money and to get work experiences--many
city and county governments have special summer job programs. Students are
hired to do cleanup and building jobs in parks or other community facilities.
As with most government projects, there is seldom enough money to go around.
Think About This Situation
In Kent County, the government budget sets aside $100,000 each year for
a youth jobs program. The officials who run the program have to make some
decisions before announcing their plans and inviting applicants for the
jobs.
(a) What choices can you imagine that the jobs program planners have to
make in setting up the program each year?
(b) What factors would they have to consider in making those choices?
(c) How are the choices related to each other; that is, how does one decision
affect the other options?
One plan for the Kent County summer jobs plan focused on the connections
among pay for each student worker, hours worked, and number of students
who would be interested in jobs at various levels of pay. The jobs program
staff were unsure how much they should offer as pay. Recalling that the
county has $100,000 to spend on student salaries:
(a) How many student workers can be hired if the county pays $2000 per worker
for a summer contract covering 8 weeks? How many if the county pays only
$1500 per worker?
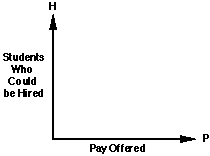
(b) If the number of students who could be hired is represented by H and
the offered summer pay rate by P, what equation gives H as a function of
P?
(c) If the planners wanted to display their options in a graph, what type
of graph shape would the relation between H and P give?
The jobs program staff figured that if they offered pay that was too low,
then few students would be willing to take the jobs. After doing a survey
of current high school students and recent graduates now in college, they
came up with the following estimates of the relation between pay rate P
and number of students who would actually apply for the jobs A.
Pay rate offered (P) 0 800 1200 1600 2000 2400
Job applicants (A) 0 80 120 160 200 240
(d) What relation between pay rate offered and number of job applicants
is suggested by these data? Explain why the pattern is or is not reasonable.
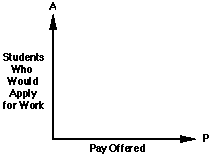
(e) What equation is a good model for the relation showing A as a function
of P?
(f) If they wanted to display their options relating offered pay P to number
of student applicants A in a graph, what type of a graph would they get?
 Depending on how the job pay rate offer is made, different results could
occur. Explore the relations between possible pay rates, number of students
who could be offered jobs, and number of students who would actually apply
for the jobs. Find the pay rates that would lead to each of these three
possible outcomes:
(g) The number of applicants would exceed the number of jobs.
(h) The number of applicants would be under the number who could be hired
at the specified rate.
(i) The number of job applicants would just equal the number who could be
paid at the specified rate.
Based on the results of your analysis, what pay would you recommend offering?
When the Kent County job program officers decided on a pay rate to offer,
they presented their plan to the County Board with a graph to illustrate
their reasoning. On the same diagram they plotted the relation showing
the number of students who could be hired (H) as a function of pay rate
(P) and the number of expected job applicants (A) as a function of pay rate
(P).
(j) Make such a graph showing the two relations.
(k) Explain how the graph shows the answers to questions (g), (h), and (i).
 7. For people running businesses that sell products, there are many decisions
to make to guarantee profitability. Quite often those decisions involve
deciding what prices to charge for their products.
Consider the case of concert promoters who have a contract to bring a music
program to a summer theater. They have to estimate costs of putting
on the show, income from ticket sales and concessions, and the profit
that can be made. When all these factors are considered, they have to decide
what prices to charge for tickets.
The first step in deciding how to set ticket prices for the concert was
to do market research on what prices people would probably pay. A market
research survey produced predictions of ticket sales (S) that could be expected
for various possible ticket prices (P). They got this data relating price
and probable ticket sales:
Proposed Price $ 5 10 15 20 25 30 35
Probable Ticket Sales 2300 1950 1600 1400 1100 900 700
(a) What equation relating P and S fits this pattern well?
(b) Re-express this relation in a form that shows S as a function of P.
After estimating the connection between ticket prices and probable ticket
sales, the concert promoters wanted to see the probable connection between
ticket prices (P) and dollar income (I) from ticket sales.
(c) Income from sales of concert tickets will be the product of number of
tickets sold and price per ticket. What equation gives I as a function of
P, based on your result from (b)? Sketch a graph of this relation between
ticket price and income from ticket sales and explain what the shape of
that graph says about the way income projections change as proposed ticket
price varies.
(d) What price is likely to give the maximum ticket income and what would
that
income be? Explain how you could find your answer using a calculator-generated
table or graph of the price-income relation.
The next step in making a concert business plan was to estimate operating
costs for the concert. The planners knew that some costs were fixed (for
example, pay for the bands and rent of the concert space) but others would
vary depending on the number of tickets sold (for example, number of security
guards and ticket takers). After estimating all the possible operating costs,
they came up with the equation C = 17500 + 2S, giving operating costs as
a function of number of tickets sold.
(e) According to that rule, what are the projected fixed operating costs
and what is the projected operating cost for each person who buys a ticket
for the concert?
(f) How will total operating costs change as the number of tickets sold
increases?
(g) Since ticket sales seem to depend on price charged, it is possible to
express operating cost as a function of price. What equation would express
that relation?
[Hint: Substitute the expression for ticket sales in terms of price into
the cost equation.]
(h) Operating profit for the concert will be the difference between income
(I) and operating costs (C). Using the equations that express I and C as
functions of price P, write an equation giving projected profit as a function
of ticket price and find the price that seems to project maximum profit.
Explain how you could find that optimal situation using a calculator-generated
table or graph of the price-profit relation.
 Depending on how the job pay rate offer is made, different results could
occur. Explore the relations between possible pay rates, number of students
who could be offered jobs, and number of students who would actually apply
for the jobs. Find the pay rates that would lead to each of these three
possible outcomes:
(g) The number of applicants would exceed the number of jobs.
(h) The number of applicants would be under the number who could be hired
at the specified rate.
(i) The number of job applicants would just equal the number who could be
paid at the specified rate.
Based on the results of your analysis, what pay would you recommend offering?
When the Kent County job program officers decided on a pay rate to offer,
they presented their plan to the County Board with a graph to illustrate
their reasoning. On the same diagram they plotted the relation showing
the number of students who could be hired (H) as a function of pay rate
(P) and the number of expected job applicants (A) as a function of pay rate
(P).
(j) Make such a graph showing the two relations.
(k) Explain how the graph shows the answers to questions (g), (h), and (i).
 7. For people running businesses that sell products, there are many decisions
to make to guarantee profitability. Quite often those decisions involve
deciding what prices to charge for their products.
Consider the case of concert promoters who have a contract to bring a music
program to a summer theater. They have to estimate costs of putting
on the show, income from ticket sales and concessions, and the profit
that can be made. When all these factors are considered, they have to decide
what prices to charge for tickets.
The first step in deciding how to set ticket prices for the concert was
to do market research on what prices people would probably pay. A market
research survey produced predictions of ticket sales (S) that could be expected
for various possible ticket prices (P). They got this data relating price
and probable ticket sales:
Proposed Price $ 5 10 15 20 25 30 35
Probable Ticket Sales 2300 1950 1600 1400 1100 900 700
(a) What equation relating P and S fits this pattern well?
(b) Re-express this relation in a form that shows S as a function of P.
After estimating the connection between ticket prices and probable ticket
sales, the concert promoters wanted to see the probable connection between
ticket prices (P) and dollar income (I) from ticket sales.
(c) Income from sales of concert tickets will be the product of number of
tickets sold and price per ticket. What equation gives I as a function of
P, based on your result from (b)? Sketch a graph of this relation between
ticket price and income from ticket sales and explain what the shape of
that graph says about the way income projections change as proposed ticket
price varies.
(d) What price is likely to give the maximum ticket income and what would
that
income be? Explain how you could find your answer using a calculator-generated
table or graph of the price-income relation.
The next step in making a concert business plan was to estimate operating
costs for the concert. The planners knew that some costs were fixed (for
example, pay for the bands and rent of the concert space) but others would
vary depending on the number of tickets sold (for example, number of security
guards and ticket takers). After estimating all the possible operating costs,
they came up with the equation C = 17500 + 2S, giving operating costs as
a function of number of tickets sold.
(e) According to that rule, what are the projected fixed operating costs
and what is the projected operating cost for each person who buys a ticket
for the concert?
(f) How will total operating costs change as the number of tickets sold
increases?
(g) Since ticket sales seem to depend on price charged, it is possible to
express operating cost as a function of price. What equation would express
that relation?
[Hint: Substitute the expression for ticket sales in terms of price into
the cost equation.]
(h) Operating profit for the concert will be the difference between income
(I) and operating costs (C). Using the equations that express I and C as
functions of price P, write an equation giving projected profit as a function
of ticket price and find the price that seems to project maximum profit.
Explain how you could find that optimal situation using a calculator-generated
table or graph of the price-profit relation.


