Frequency domain analysis
In this lab, we will learn the following new Matlab commands:
   bode       - Bode plot (frequency response).
   loglog     - Log-log scale plot.
   hold       - Hold current graph.
   nyquist    - Nyquist frequency response of LTI systems.
Frequency response mothods provide a useful alternative to root locus methods for control system design. Frequency domain methods, however, can also be used in situations when the exact transfer function is not known - the frequency response of a system can be measured in the laboratory by choosing different sinusoidal inputs and measuring the magnitude and phase of the sinusoidal output, or by using a special type of instrument called a network analyzer.
In this lab, you will use MatLab to analyze the frequency response of some simple systems. Both Bode and Nyquist analysis will be performed.
1. Bode plots. If a system has a transfer function G(s), its frequency response is G(jw) (it is only evaluated for values of s which are on the jw axis). Since G(jw) is a complex number, it is usually represented in two different plots, one for its magnitude and the other for its phase, both as functions of w. These two plots together are called the Bode plots of the system. By using a log scale for the frequency, a linear scale for the magnitude (in dB), and a linear scale for the phase, the composition of two systems (in series) is easily accomplished by adding together their Bode plots. For example, consider a standard second-order system (mass-spring-damper):
             1
G1(s) = -------------
       s^2 + s/2 + 1
and find its Bode plot using matlab:
numG1 = 1;
denG1 = [1 0.5 1];
bode(numG1,denG1);
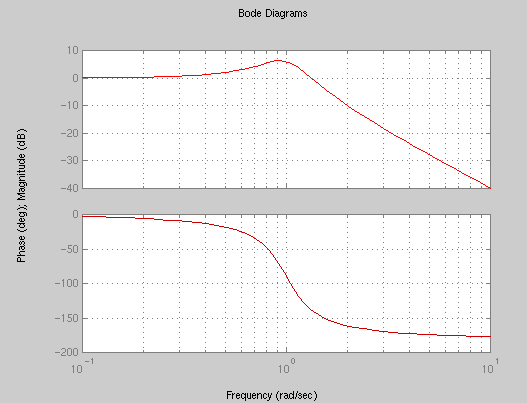
(note that this plot is the true frequency response, not the asymptotic Bode response you learned in lecture)
Now plot the Bode response of an integrator (a pole at the origin):
G2(s) = 1/s

numG2 = 1;
denG2 = [1 0];
bode(numG2,denG2);
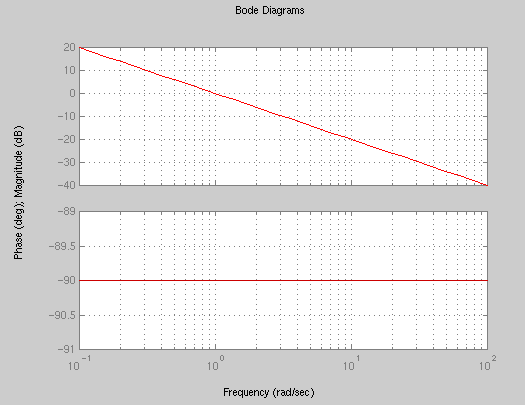
The combined system has a transfer function given by:
G(s) = G1(s) G2(s)

[numG,denG] = series(numG1,denG1,numG2,denG2);
bode(numG,denG);
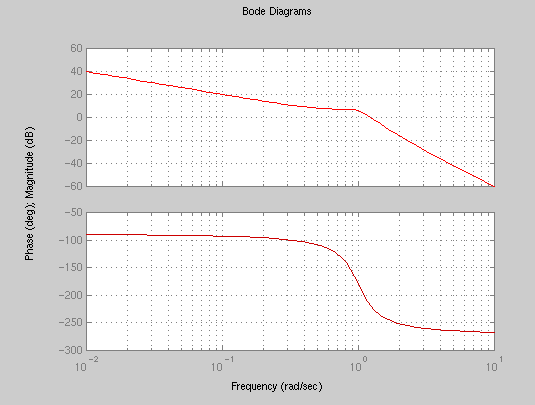
which is the sum of the two individual Bode plots. Note the subplot and axis commands which change the scale on the magnitude plot only.
There are several characteristics of a system that you can read directly from its Bode plot:
Bandwidth. Sinusoidal inputs with frequency less than w_BW are amplified by the system's DC gain, Mdc, while sinusoidal inputs with frequency greater than w_BW are attenuated. For a second-order system, the output is attenuated by a factor of 0.707*Mdc or greater. For your original 2nd order system (G1), plot the magnitude response on a log-log scale, i.e. do not express the magnitude in dB. Locate the point M = 0.7 on the magnitude axis (or Mdb = -3dB), and draw a line across until it hits the plot of |G(s)|. Read down to find w_BW, as shown in the figure:
[m,p,w]=bode(numG1,denG1);
loglog(w,m);
grid;
hold on;
plot([0.1 1.5], [0.7 0.7],'r-');
plot([0.1 1.5], [0.69 0.69],'r-');
plot([1.5 1.5], [0.01 0.7],'r-');
plot([1.49 1.49], [0.01 0.7],'r-');
text(1.5,0.008,'w=1.5');

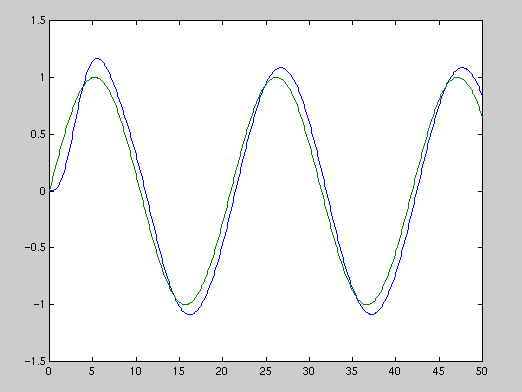
You can find the time-domain output of the system to a sinusoidal input by using the lsim command in matlab. Try applying two simusoids with different frequencies to the system, and observe the response:
t=0:0.1:50;
u = sin(0.3*t);
[y,x] = lsim(numG1,denG1,u,t);
plot(t,y,t,u)
t=0:0.1:10;
u = sin(3*t);
[y,x] = lsim(numG1,denG1,u,t);
plot(t,y,t,u)
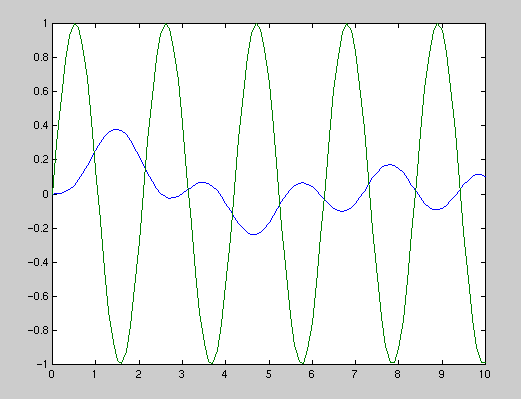
Note the phase lag as well as the magnitude attenuation in the second plot.
Questions:
1. Why are the last two plots so different in their output magnitude?
2. What is the bandwith of system G2?
3. What is the bandwith of system G1*G2?
System Type. The system type is the number of (open-loop) poles at s=0, and is the (negative of the) slope of the low-frequency portion of the magnitude Bode plot. By Bode's gain-phase relationship:
<G(jw) = n x 90 (n is the slope of |G(jw)|)Thus you should be able to determine the type of a system by observing the low-frequency phase of G(jw) and dividing by 90 degrees.
With unity-gain feedback, a Type 1 system has zero steady-state error to a step input and a Type 2 system has zero steady-state error to a ramp input.
Question:
4. Plot the Bode plots of systems G1, G2, and G1*G2. From the
plots, determine the types each system. Explain your answer graphically.
Determining the transfer function from a Bode plot. The bode plots can be used to estimate the transfer function of the system. For example, if we have measured the following bode plots of the system:
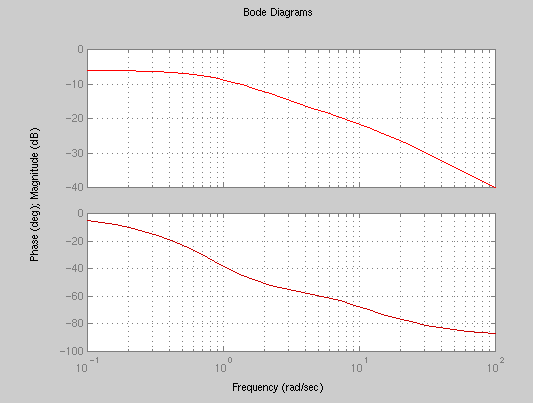
from which we observe that there are three "break points" at w=1, w=4, and w=8, and that the gain of the system is such that 20 log K = -6 so that K=10^{-6/20}=0.5. Therefore the system's transfer function is:
                 K ( s/4 + 1)            (s + 4)
    T(s) = --------------------- = ------------------
           ( s/1 +1 ) ( s/8 +1 )    (s + 1) (s + 8)
The frequency response (bode plots) of a system can be measured in the laboratory by choosing different sinusoidal inputs and measuring the magnitude and phase of the sinusoidal output, and the transfer function of the system can
be determined from this data as we just showed.
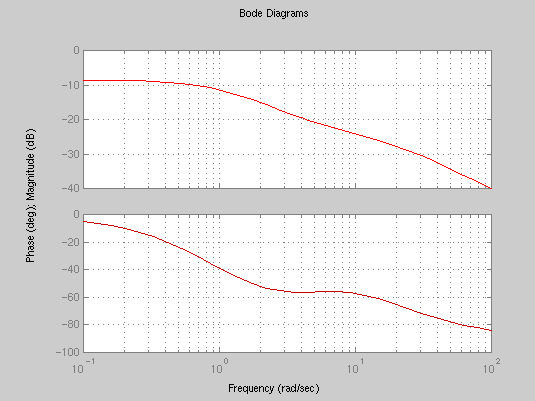
Question:
5. What is the transfer function corresponding to the following bode plot?
2. Nyquist diagram and stability. Consider the unit feedback system with the open-loop transfer function
                  40 K
    G3(s) = ----------------
             (s+2)(s+4)(s+5)
For K=1, find its Nyquist diagram using matlab:
numG3 = 40;
denG3 = conv([1 2],[1 4]);
denG3 = conv(denG3,[1 4]);
nyquist(numG3,denG3);
grid;
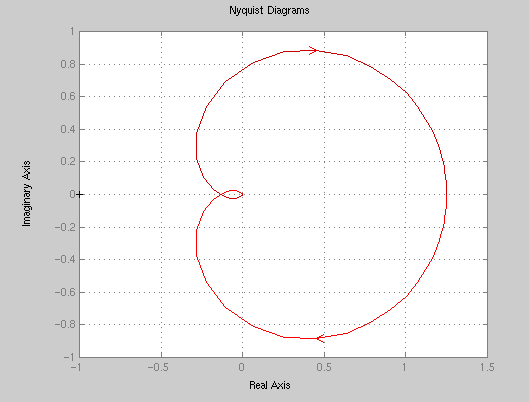
Based on Nyquist criterion, it is seen that P=0, N=0, Z=P-N=0. Therefore, the closed-loop system is stable. From this diagram, it can be seen that, approximately, for 0 < K < 10, the system will remain to be stable.
The stability can also be judged using Bode plots:
figure(4)
bode(numG3,denG3);
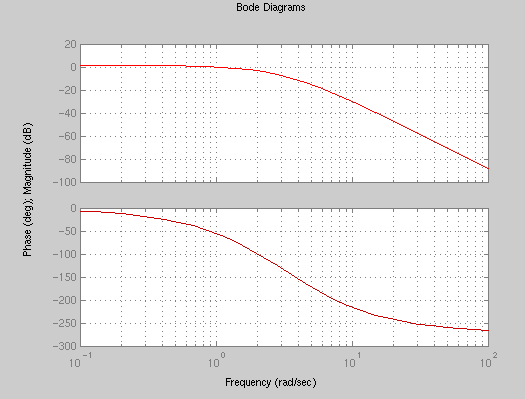
The Nyquist criterion tells us that the Bode log-magnitude plot must be less than unity when the Bode phase plot is -180 degree. We see that at a frequency of 7 rad/sec, when the phase plot is -180, the magnitude plot is -20dB. Therefore, an increase in gain of +20 dB is possible before the system becomes unstable. This amounts to increase K to K=10, which verifies the observation from the Nyquist diagram.
Questions:
Consider the unit feedback system with the open-loop transfer function
             K(s+3)(s+5)
    G4(s) = -------------
             (s-2)(s-4)
6. Is the closed-loop system stable for K=3? K=0.7? Why? Can you draw a general conclusion for K so that the closed-loop system is always stable?
7. Explain your conclusion in Question 6 by using root locus technique.
3. Stability Margins
Gain margin. The closed-loop system is marginally stable when the root-locus crosses the jw axis, or 1 + KG(jw) = 0. In terms of magnitude and phase, |KG(jw)| = 1 and <KG(jw) = -180. Since most systems become unstable as K increases, the gain margin is defined as how much the proportional gain K can increase (in a unity feedback situation) before instability results. This can be read directly from the Bode plot by finding the point when the phase crosses 180 degrees, and finding the magnitude at that frequency:
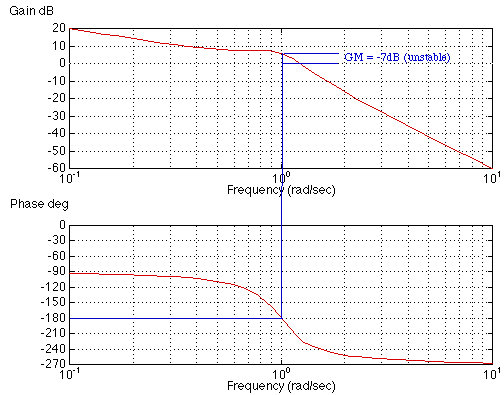
If the gain is greater than 1 (0dB) then the system is unstable at K=1, and the gain margin is negative (dB) or < 1 (magnitude). If the phase never crosses -180, then the system is stable for all gains and the gain margin is infinite.
Phase margin. The analog of the gain margin is the phase margin. This is found from the Bode plot as the difference from the phase from -180 when the magnitude is equal to 1 (or 0dB).
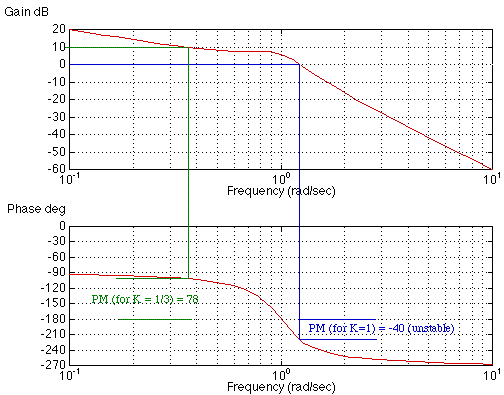
If the phase is less than -180 when the magnitude is equal to one, then the closed-loop system is unstable for K=1. The phase margin for different proportional gains K can also be found from the Bode plot. When |KG(jw)| crosses magnitude 1, then |G(jw)| crosses magnitude 1/K. Shown above is the calculation for K = 1/3 (20 log (1/K) = 9.5 dB).
Question:
8. Find the phase margin and gain margin of G1(jw).
9. Find the phase margin and gain margin of G1*G2(jw).
10. Use bode, nyquist, AND root locus arguements to prove or disprove the following statement:
"Any second-order minimum phase system with at least one finite zero can be
stabilized by using a high-gain unit feedback".
Assignments:
Answer all questions (1-10)