


National Museum of Natural History Self-Guided Excursion in Washington D.C.
24 November 2025, 2:00-4:30 p.m.
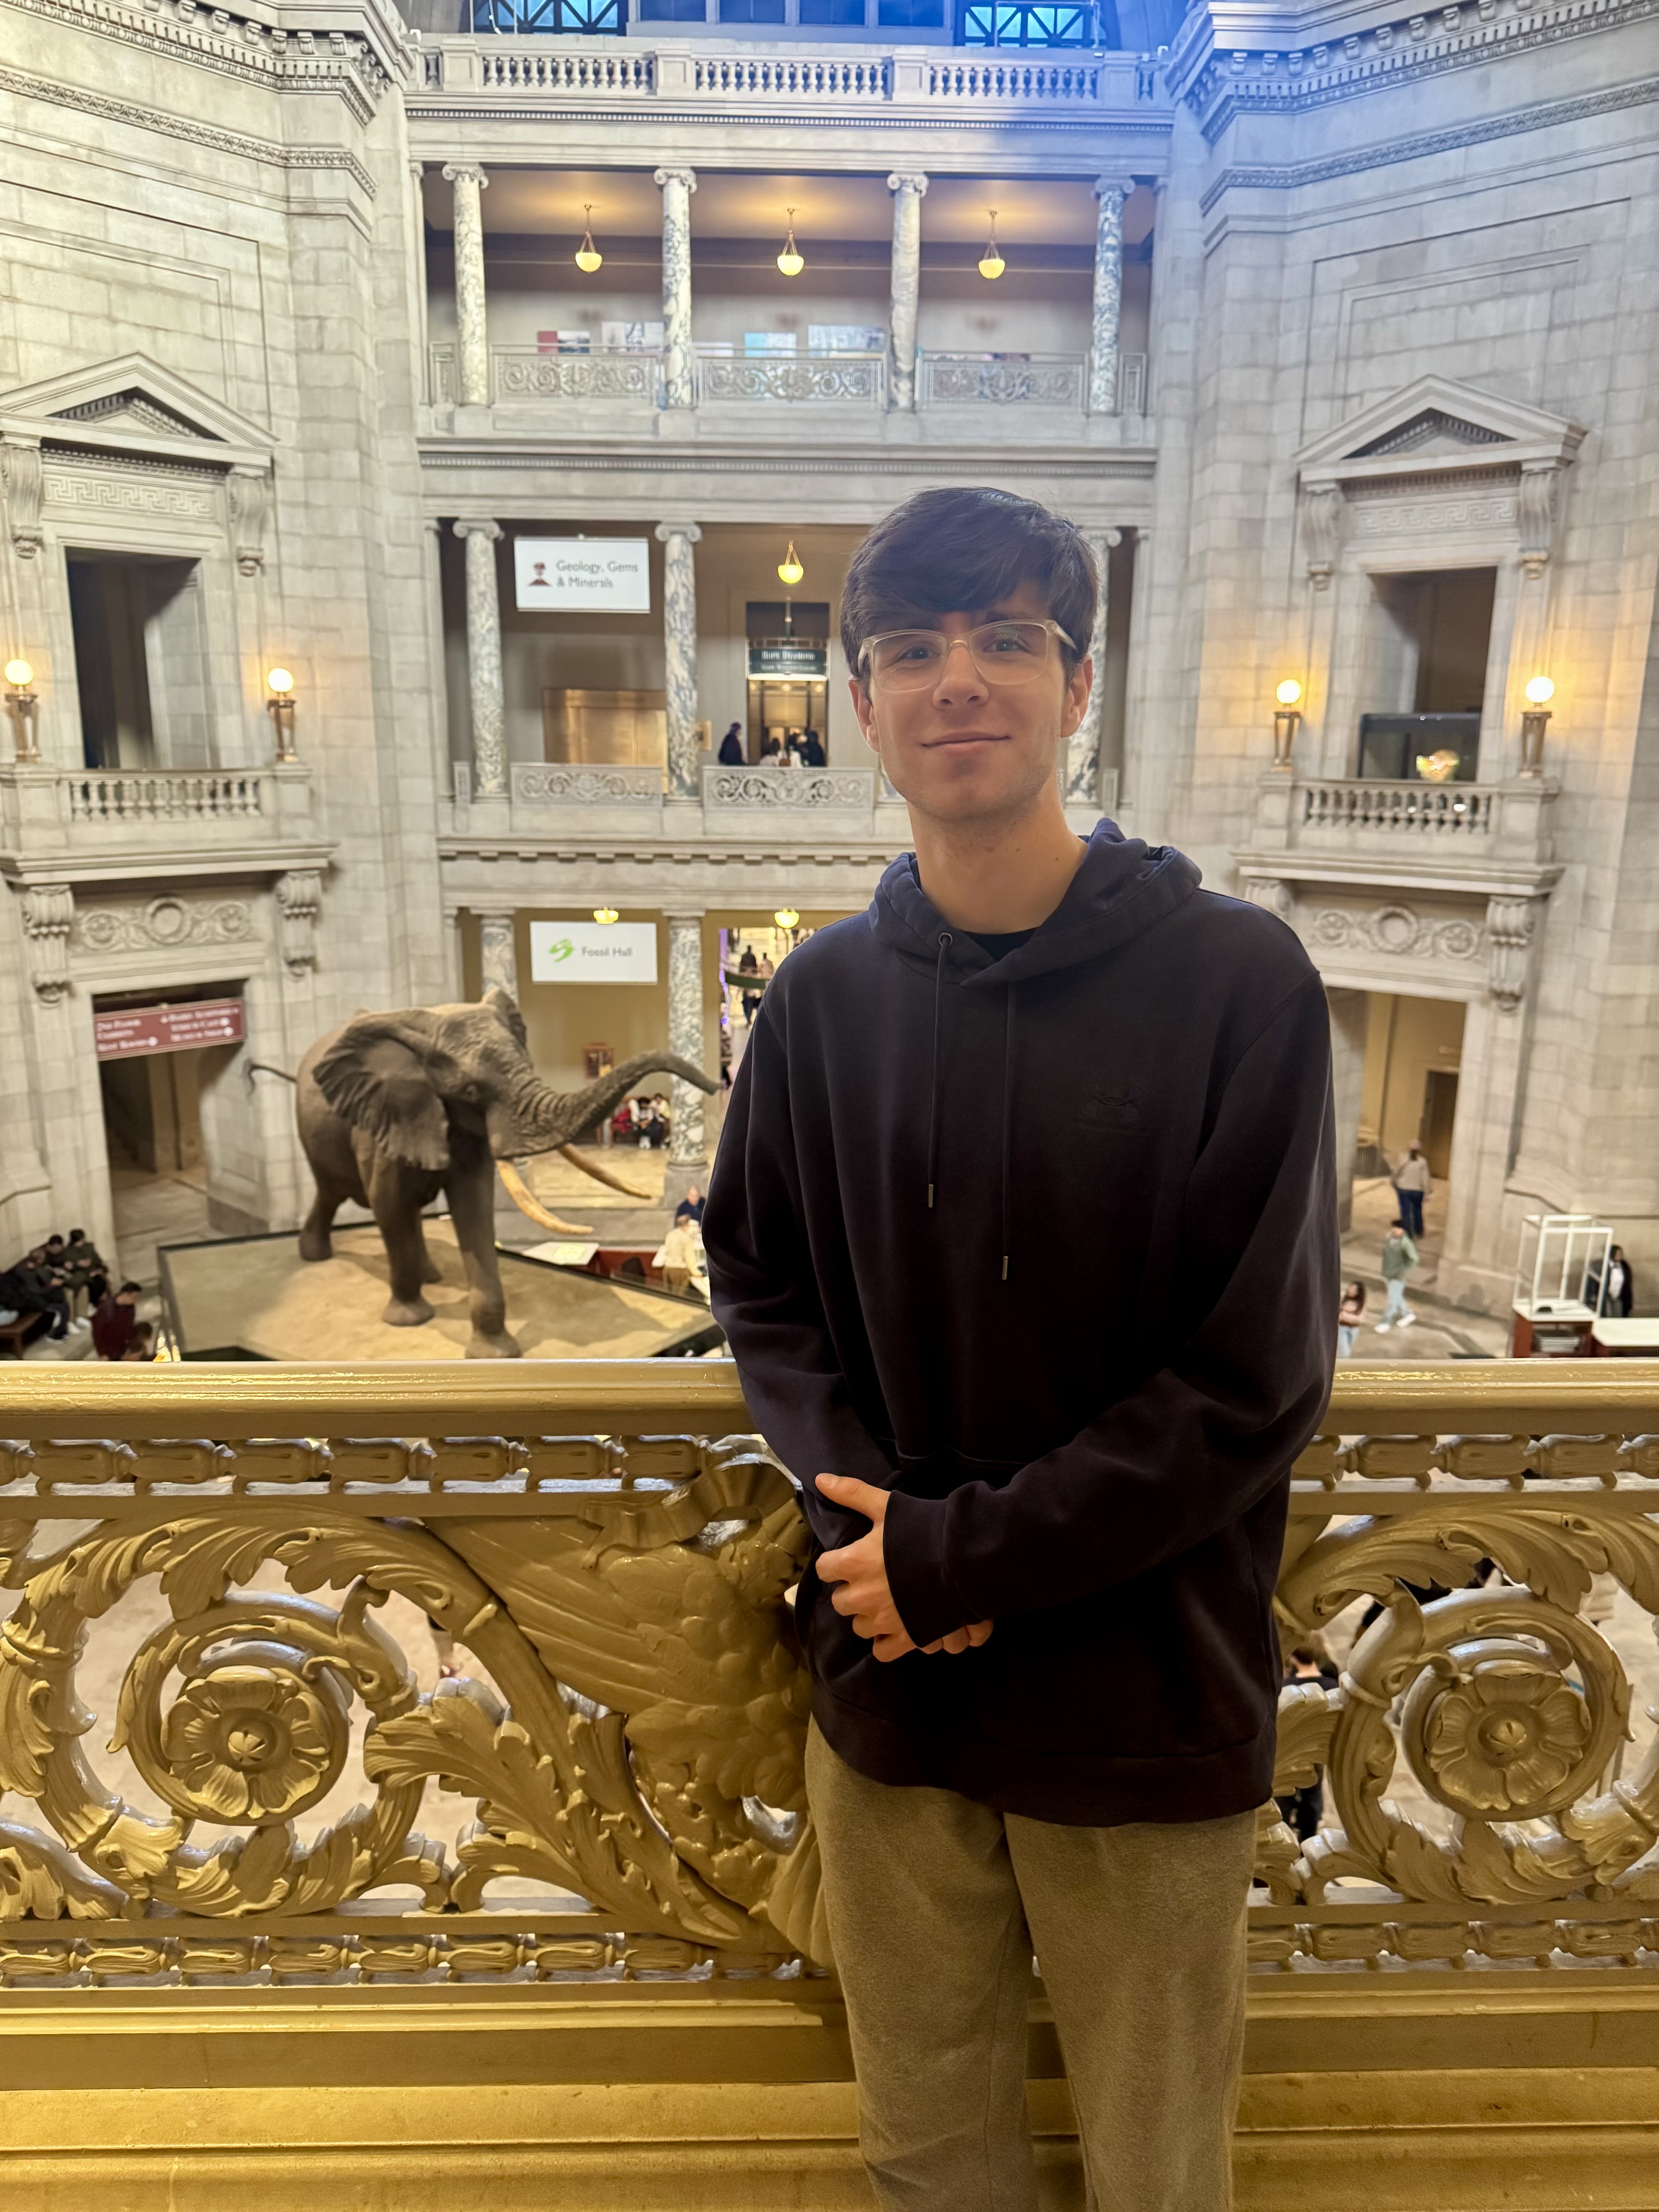
Quinn Abel in front of the rotunda of the National Museum of Natural History.
As a member of the Science and Global Change (SGC) College Park Scholars program, I am always looking for ways to learn more about how our world has changed over time. One of the best ways to research global change is to visit museums that explore it through the lens of various fields, including geology, climatology, environmental science, and many more. For my SGC excursion this semester, I went on a self-guided tour of the Smithsonian National Museum of Natural History in Washington, D.C., in order to study how our climate and environment have changed over the course of history and how the museum chooses to convey that information.
I started my journey in the David H. Koch Hall of Fossils – Deep Time exhibit. Here, I sought to learn more about prehistoric climate changes and how the climate can fluctuate independently of anthropogenic influences. A notable part of this exhibit was the various paleoenvironment dioramas scattered throughout the hall that depict the environments of different points in geologic history. These dioramas featured miniature fauna and flora representative of the time and included information about the local climate. One diorama depicted a grassland in the area that is now Nebraska as it was 25-16 million years ago. There were certainly many notable differences between this time and the modern day, as the carbon dioxide levels were up to 50% higher, average global temperatures were 3-7°C higher, and sea levels were about 100m higher than today. Another diorama depicted a conifer forest and prairie in the area that is now Arizona as it was 230-201 million years ago. At this time, carbon dioxide levels were 7 times higher, the average global temperature was 6-14°C higher, and sea levels were about 10m lower than today. These dioramas are very effective at not only providing a visual representation of the time and place that helps immerse you, but also providing very descriptive statistics that paint a clear visualization of the climate and environment. Also, in this exhibit are exhibits describing past climate changes. One exhibit shows how fossils show that atmospheric carbon doubled about 56 million years ago, causing significant changes in temperatures. This led to areas like modern-day Wyoming to change from subtropical, lush environments to hot and dry environments, as well as causing plants to be less nutritious and animals to become smaller. These displays could do a better job explaining how the fossil record was used to come to these claims, as they mainly focus on the observations and not the methodology.
My next stop was the Sant Ocean Hall. Here I started at the interactive video display labelled The Changing Ocean. The first video I watched was titled How Many Horseshoe Crabs? This video describes how volunteers conduct spawning surveys on the Delaware coast to examine changes in Horseshoe Crab populations. They collect their data by counting the number of male and female Horseshoe Crabs per square meter. The second video I watched is titled Fuel for the Storm. This video explains how hurricanes are formed by warm water, moist air, and converging winds, and explains how scientists use sea surface temperature data to forecast the intensity of storms. This video also highlights how warming ocean temperatures through climate change only make extreme weather events like hurricanes more frequent and deadly. These videos do an excellent job of providing a succinct and simple explanation of how scientists collect data and present it in a way that is understandable to even those without much scientific knowledge. Also in this hall is an exhibit that focuses on human impacts on the ocean. One of these impacts is overfishing, which the exhibit says is mainly caused by increased use of commercial fishing technology and increased demand. This led to unsustainable practices that cause fish populations to dwindle. The exhibit encourages us to act by making sure the seafood we buy is sustainable and supporting organizations that use sustainable practices. Another impact discussed is pollution. The exhibit explains how trash, waste, sewage, and oil are accumulating in the oceans and affect the chemistry of the ocean and the health of marine life. We are encouraged to take action by not littering and supporting community recycling programs. My final stop in this hall was the Art X Climate gallery, where artists reflect on climate change through their works. One piece I found interesting was Planting Resilience by Jillian Pelto. This piece is a diptych that incorporates three line-graphs into its design that represent the sea level rise from 1950-2050, the increase in National Wildlife Refuge acreage in New England, and the increase in US adults supporting environmental protections. This piece does an excellent job at not only showing the desperate state of our environment but also how we are stepping up to take action and protect the environment. Not only is this piece very thought-provoking, but it also looks very visually appealing and does an excellent job of using color and texture.
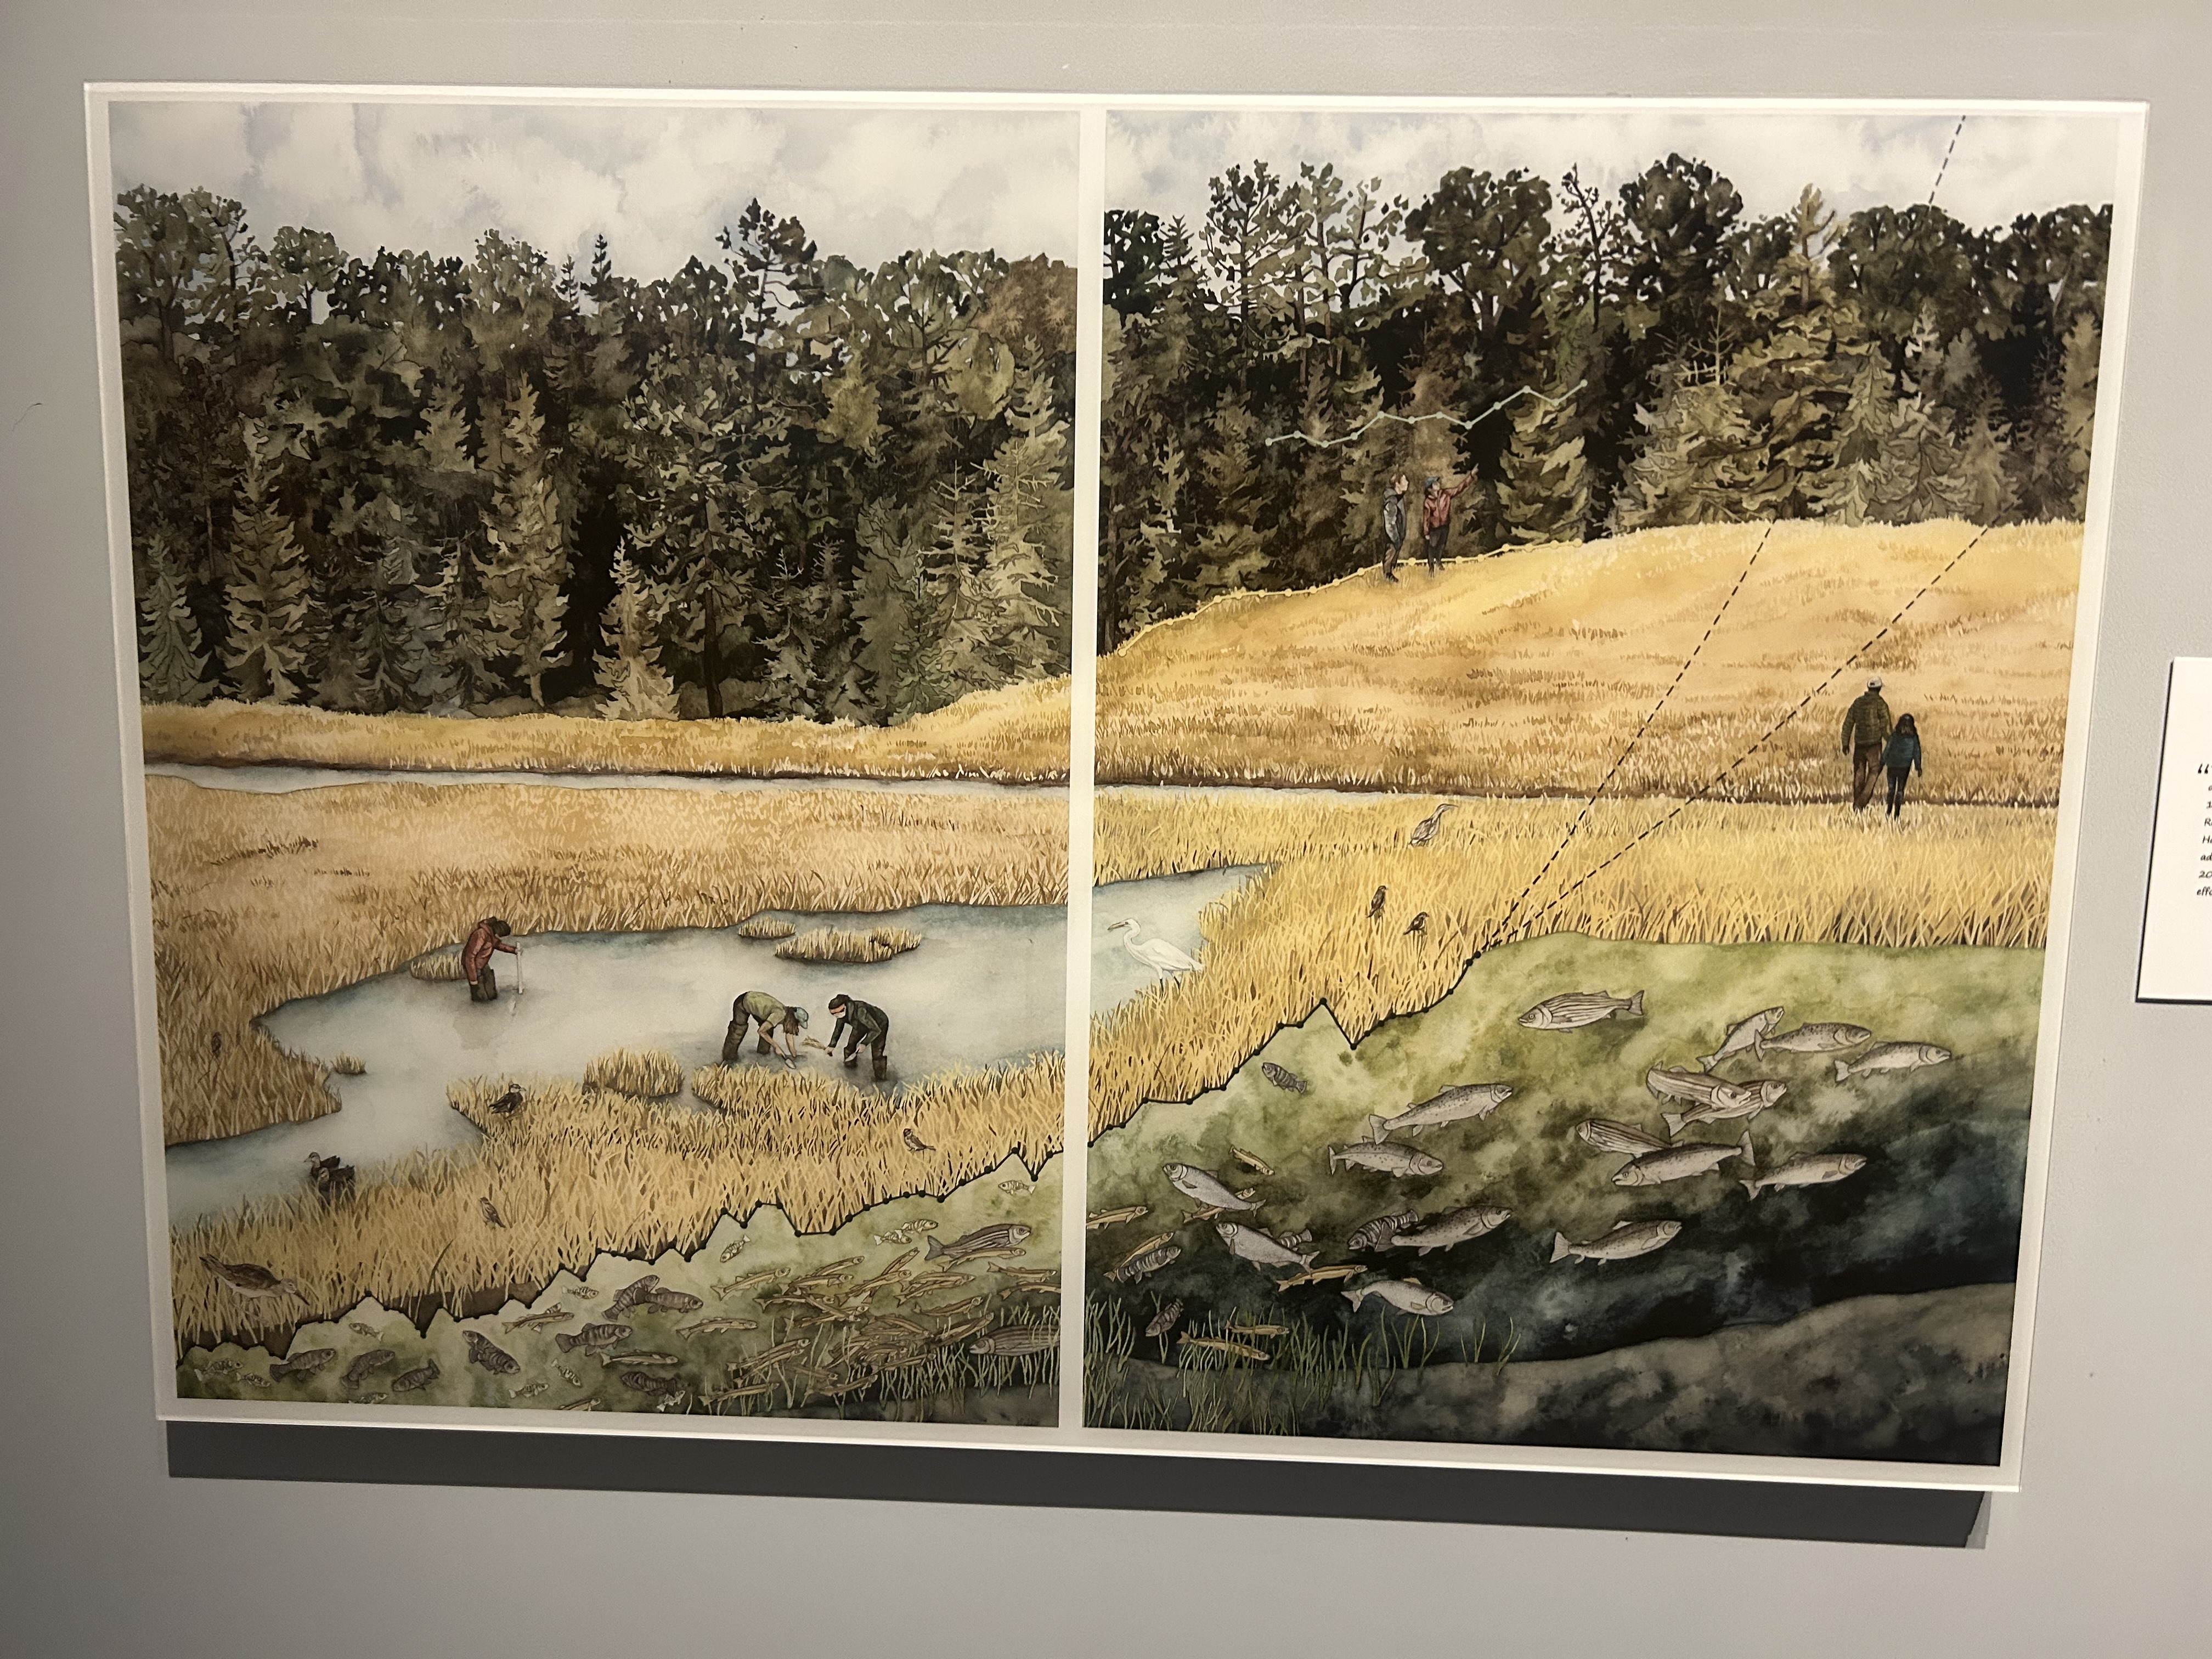
A piece of artwork entitled Planting Resilience by Jillian Pelto featured in the
Art X Climate: Artists Reflect on Climate Change exhibit.
Next, I visited the David H. Koch Hall of Human Origins. In this hall, I focused on one specific exhibit called Humans Change the World. This exhibit highlights the Anthropocene Event and how humans have impacted the living and non-living world. One aspect discussed is the level of carbon dioxide in the atmosphere. This topic is explained through a graph showing the changes in CO2, temperature, and sea level from 400,000 years ago to the present day, and shows how exponential the increase in all of these has been over the past few centuries. The graph also highlights significant milestones in human history that have impacted our growth as a species and contributed to our influence on atmospheric carbon dioxide levels. Another aspect that is discussed is how agriculture has shaped biology and the natural world. This is displayed through a timeline and various images showing the development of various agricultural technologies/practices, such as the cultivation of tea and coffee, as well as the domestication of livestock. Some critics of this exhibit claim that this exhibit de-emphasizes the impact humans have had on the environment and climate. I do not agree with these claims, as a large part of this exhibit is understanding how human technological advancements affect the environment. A good example of this is the discussion of anthropogenic practices leading to a major increase in carbon dioxide levels in the atmosphere that I mentioned earlier. Overall, I think that this exhibit does a good job of not just examining human development but the impact it has on the world around us.
I then moved up to the second floor of the museum and stopped by the Earth Information Center. This is a temporary exhibit that was created in cooperation with NASA and focuses on how weather and climate data are collected and studied. One display in this exhibit is a large screen at the back of the room that displays a rotating selection of climate data from around the world. Some of the maps that are displayed show surface temperatures, near-surface wind speeds, cloud distribution, and precipitation, as well as relative humidity. The display also shows animations that describe how wind patterns form across the globe and show the movement of the global convection cells. This display was super interesting to study and showed lots of climate data in an easy-to-understand and visually appealing manner. Another display in this exhibit focused on how scientists can observe changes on our planet and from space. Some of the topics discussed are how satellites are fitted with instruments that can see all kinds of electromagnetic radiation, allowing them to observe climate patterns that are not easily observed by the naked eye. Also discussed are how ice cores, sedimentary rocks, and biological specimens are examined in the field. These topics are displayed through a variety of pictures and diagrams showing satellites as well as scientists working in the Feather Identification Lab and working with NASA's SnowEx program in Alaska. Overall, I think this exhibit does an excellent job of showcasing and explaining environmental and climate data. The use of the interactive screen display and diagrams makes complicated topics and data sets easier to understand, and explains how collecting this data helps us make more informed weather predictions and helps us understand how our world is changing.
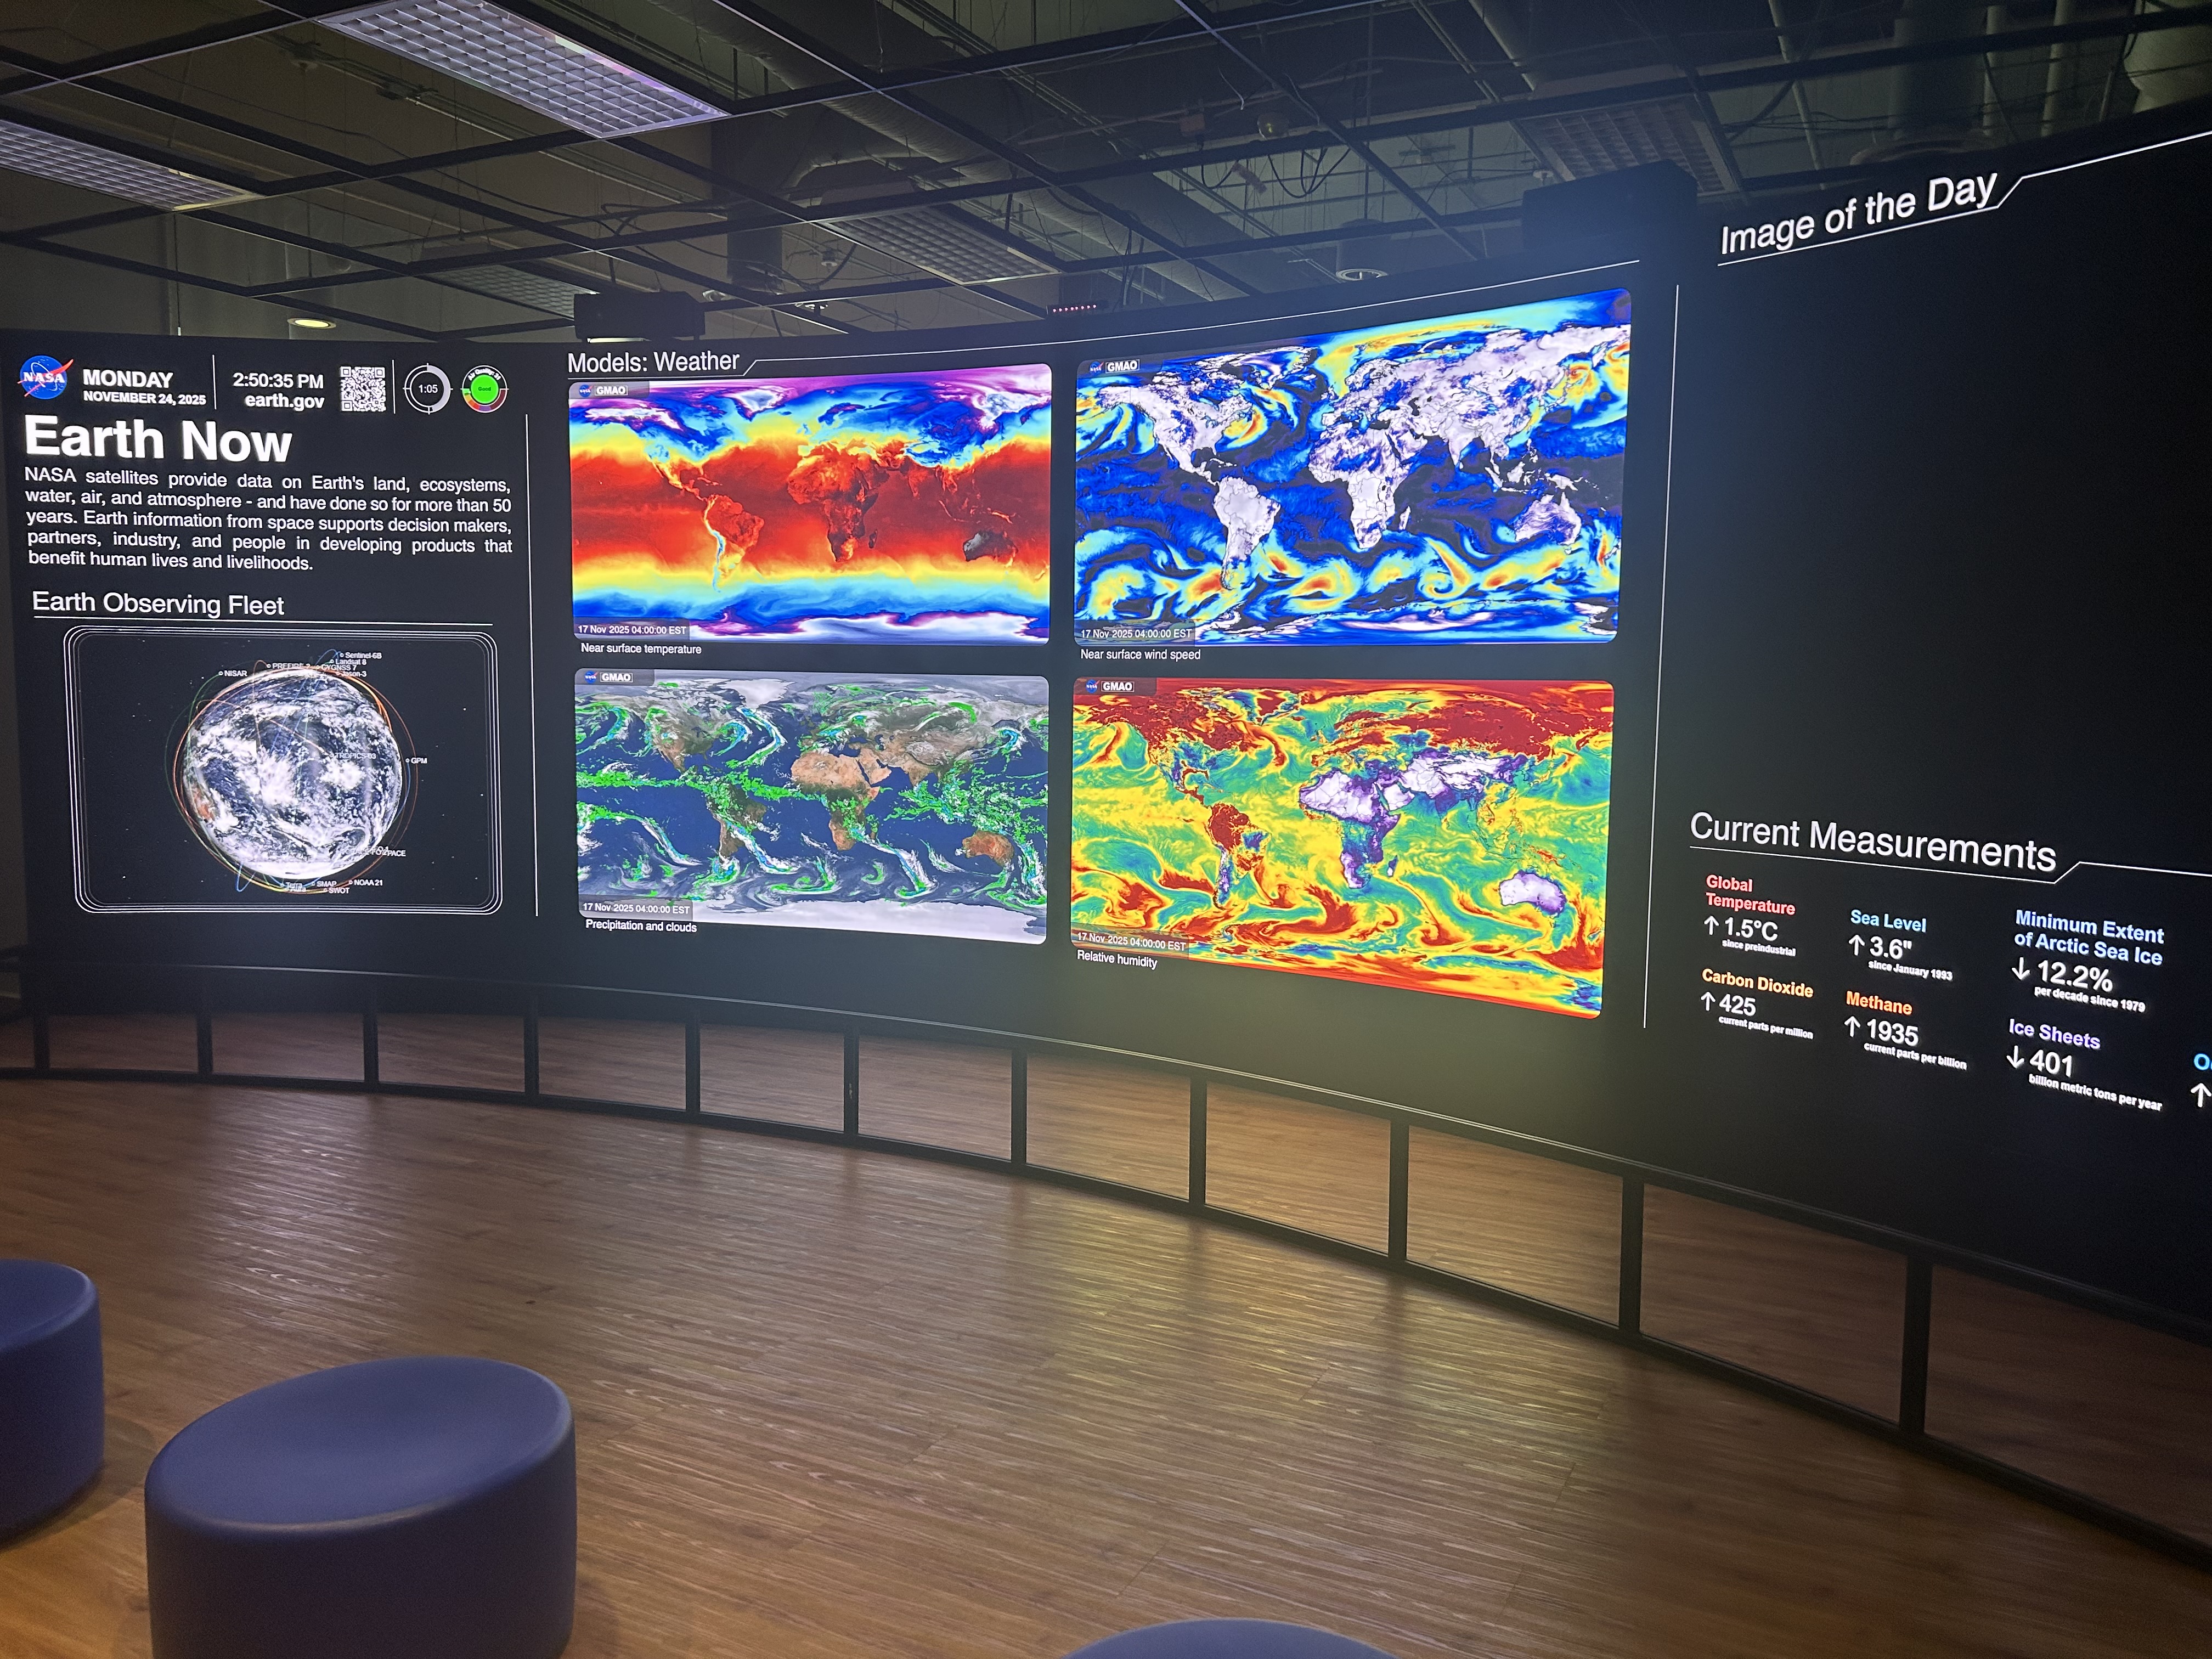
A display in the temporary Earth Information Center exhibit showcasing various climate
data from around the world.
The last exhibit I visited was the temporary exhibit Cellphones: Unseen Connections. This exhibit focuses on the history and impact of cellphones and their creation, and does so through a variety of interesting methods. One presentation style used is that of comic book images and dialogue. This is a very interesting and effective way of communicating information, as it uses a narrative to teach the reader about the societal and technological impact of cellphones. Ultimately, this method helps grab the reader's attention and provides information in a visually interesting manner. Another presentation technique is the use of quotes from experts in material science and engineering fields that provide insight into the manufacturing of cellphones. There are multiple quotes from workers in these industries scattered across the exhibit that explain how materials like rare-earth magnets, indium tin oxide, and radio frequency circuits are manufactured from raw materials. This is a very effective method of communicating information as it provides primary accounts that highlight the materials that make up your cellphone and how they are produced. The exhibit also explains how the average cellphone is composed of at least 65 of the 118 elements on the periodic table, such as aluminum, indium, lithium, etc. This exhibit does a great job of highlighting the negative impacts of producing cellphones. For instance, it explains how some materials needed in cellphones, such as tantalum, are collected from conflict-affected areas and that the extraction and sale of these materials could contribute to human rights and environmental abuses. Also, the displays highlight how many of the resources used to create cellphones are finite and are being depleted are increasing rates. There are also environmental effects to disposing of cellphones, as the e-waste from electronics ends up in landfills and contributes to pollution. The exhibit also highlights the social and technological impacts of cellphones. A social impact of cellphones is that a digital connection is helping keep languages alive. The ease of learning new languages online helps spread Indigenous languages and helps contribute to a sense of community for language learners. One technological impact of cellphones is how innovations in phone technology led to the implementation of radio antennas, fiber optic cables, and data centers, all of which help optimize your digital experience. A second technological impact is how scientists have pioneered methods for ensuring the durability of electronics. For instance, the glass of your phone screen is treated with aluminum oxide and a chemical bath with potassium ions to increase its durability. These impacts are communicated through various models showing the elements that make up a phone, as well as the various instruments that create your digital connection, such as radio antennas and servers. This exhibit does a great job of showing how cellphones are constructed and used, as well as the societal, environmental, and technological impact of their creation and use.
This excursion to the National Museum of Natural History was quite enjoyable, and I learned a lot about global change and how we communicate information and data as scientists. The various halls and exhibits that I visited throughout this excursion proved to be very effective at explaining how our environment and climate have changed over time due to both natural and anthropogenic reasons. The data presented throughout the museum show that natural climate changes can occur, but that due to certain anthropogenic factors (releasing greenhouse gases into the atmosphere, polluting land and oceans, etc.), the rate at which our climate is changing is increasing. Even though this sounds worrying, the exhibits provide ways that we can protect our environment and become better stewards of our planet. Ultimately, I feel that my understanding of global change and how to effectively communicate scientific information has been thoroughly deepened from this experience and will serve me well in my academic career.