% simple example for testing publish
t=0:.1:5 % vector of t values
t =

  Columns 1 through 7

         0    0.1000    0.2000    0.3000    0.4000    0.5000    0.6000

  Columns 8 through 14

    0.7000    0.8000    0.9000    1.0000    1.1000    1.2000    1.3000

  Columns 15 through 21

    1.4000    1.5000    1.6000    1.7000    1.8000    1.9000    2.0000

  Columns 22 through 28

    2.1000    2.2000    2.3000    2.4000    2.5000    2.6000    2.7000

  Columns 29 through 35

    2.8000    2.9000    3.0000    3.1000    3.2000    3.3000    3.4000

  Columns 36 through 42

    3.5000    3.6000    3.7000    3.8000    3.9000    4.0000    4.1000

  Columns 43 through 49

    4.2000    4.3000    4.4000    4.5000    4.6000    4.7000    4.8000

  Columns 50 through 51

    4.9000    5.0000
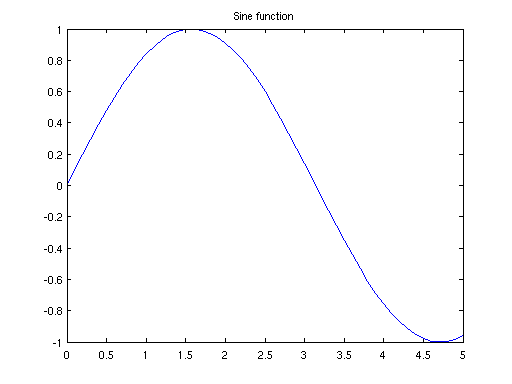
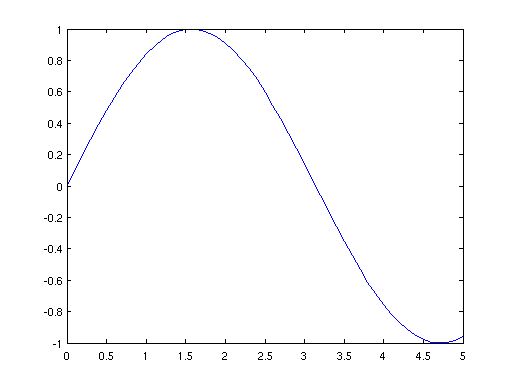
plot sin(t) vs. t
plot(t,sin(t))
add a title
title('Sine function')