Individual WAH Mortalities
Plotted against other animals
Mannat Singh and Elie Gurarie
2020-10-30
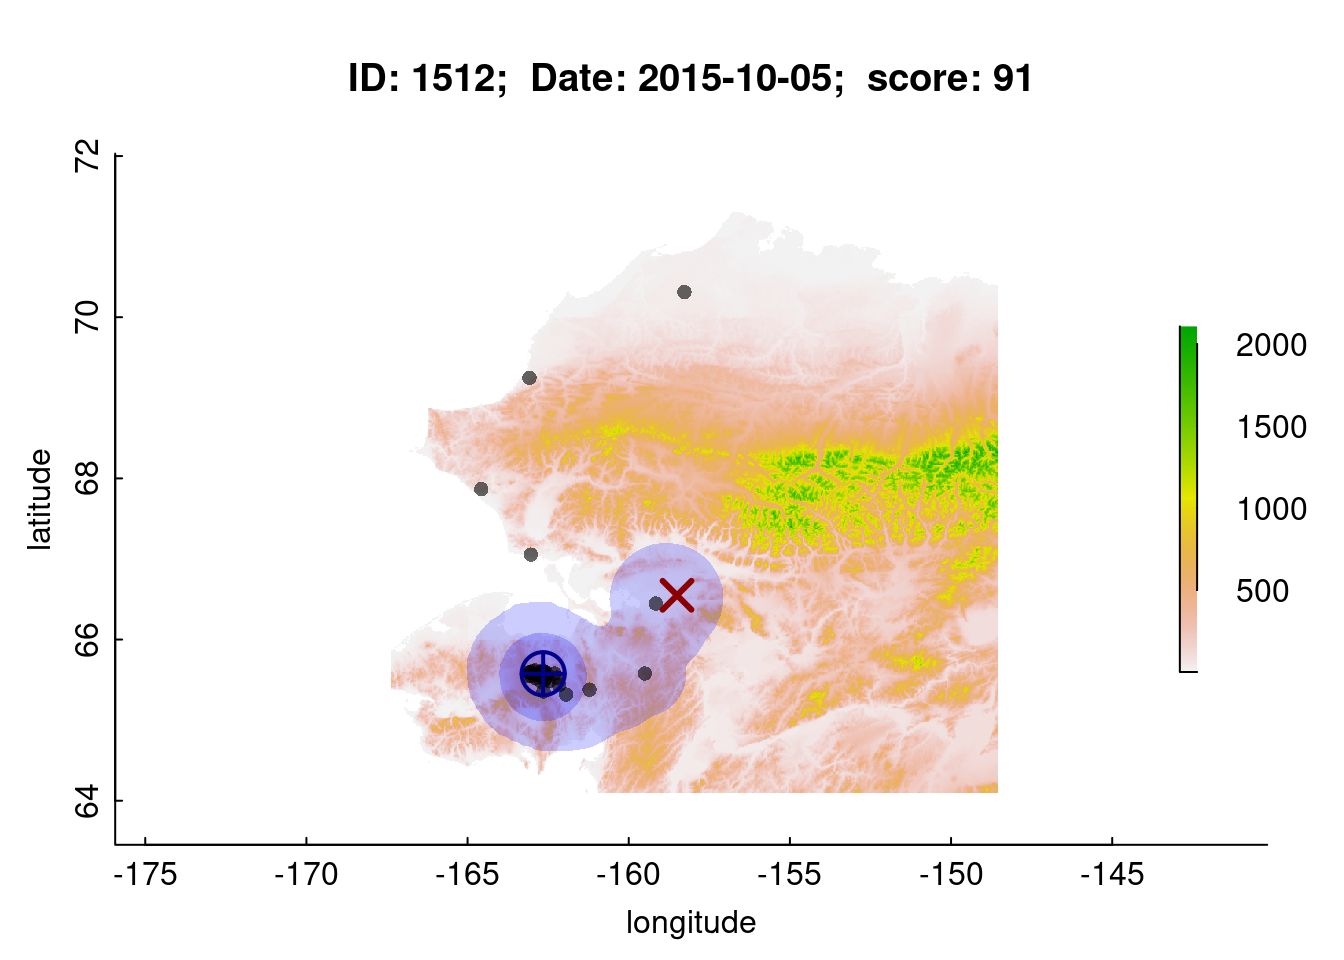
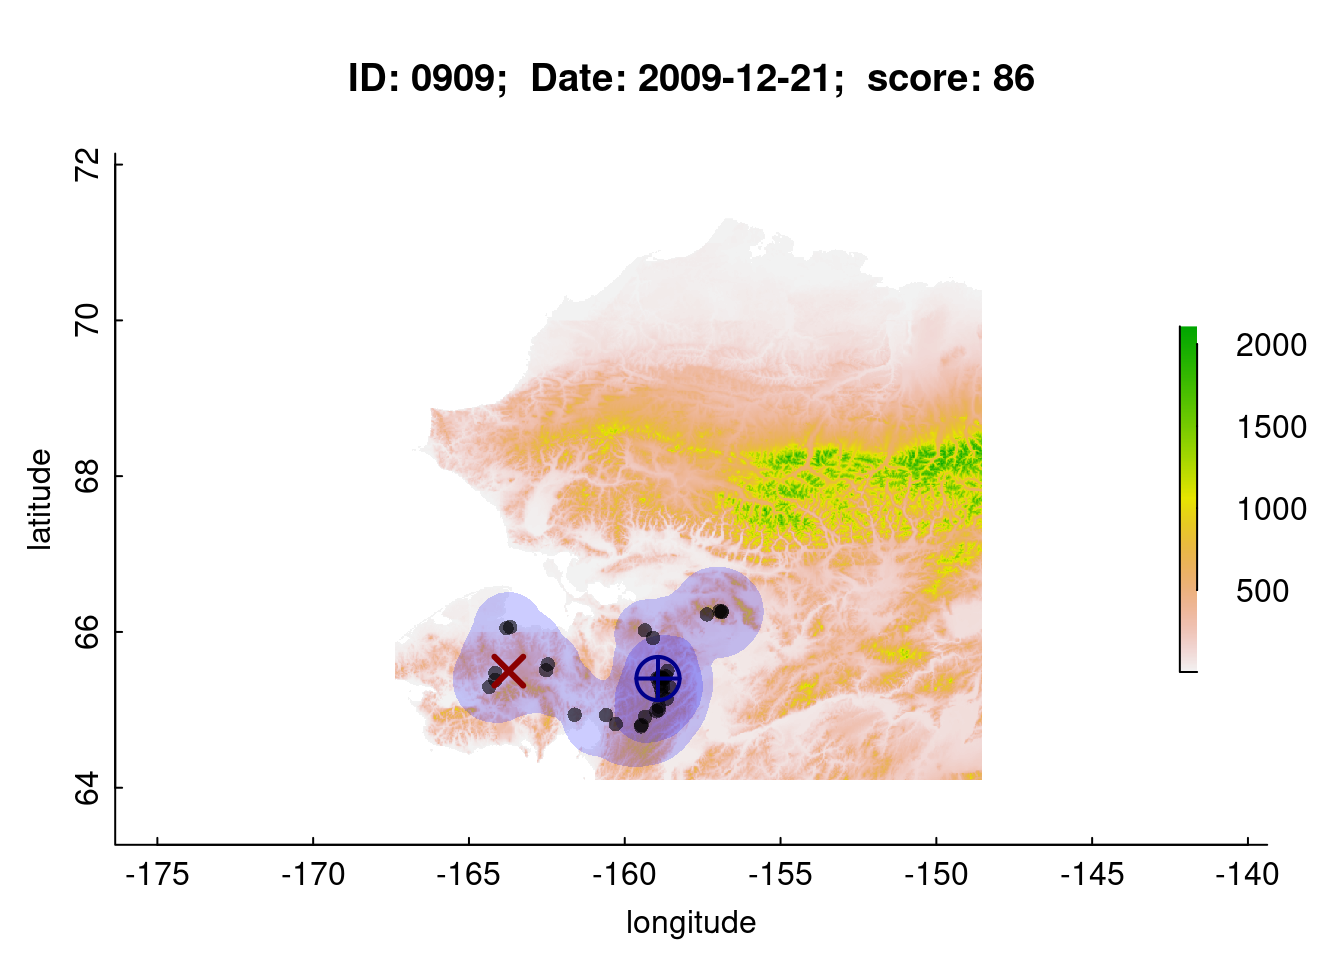
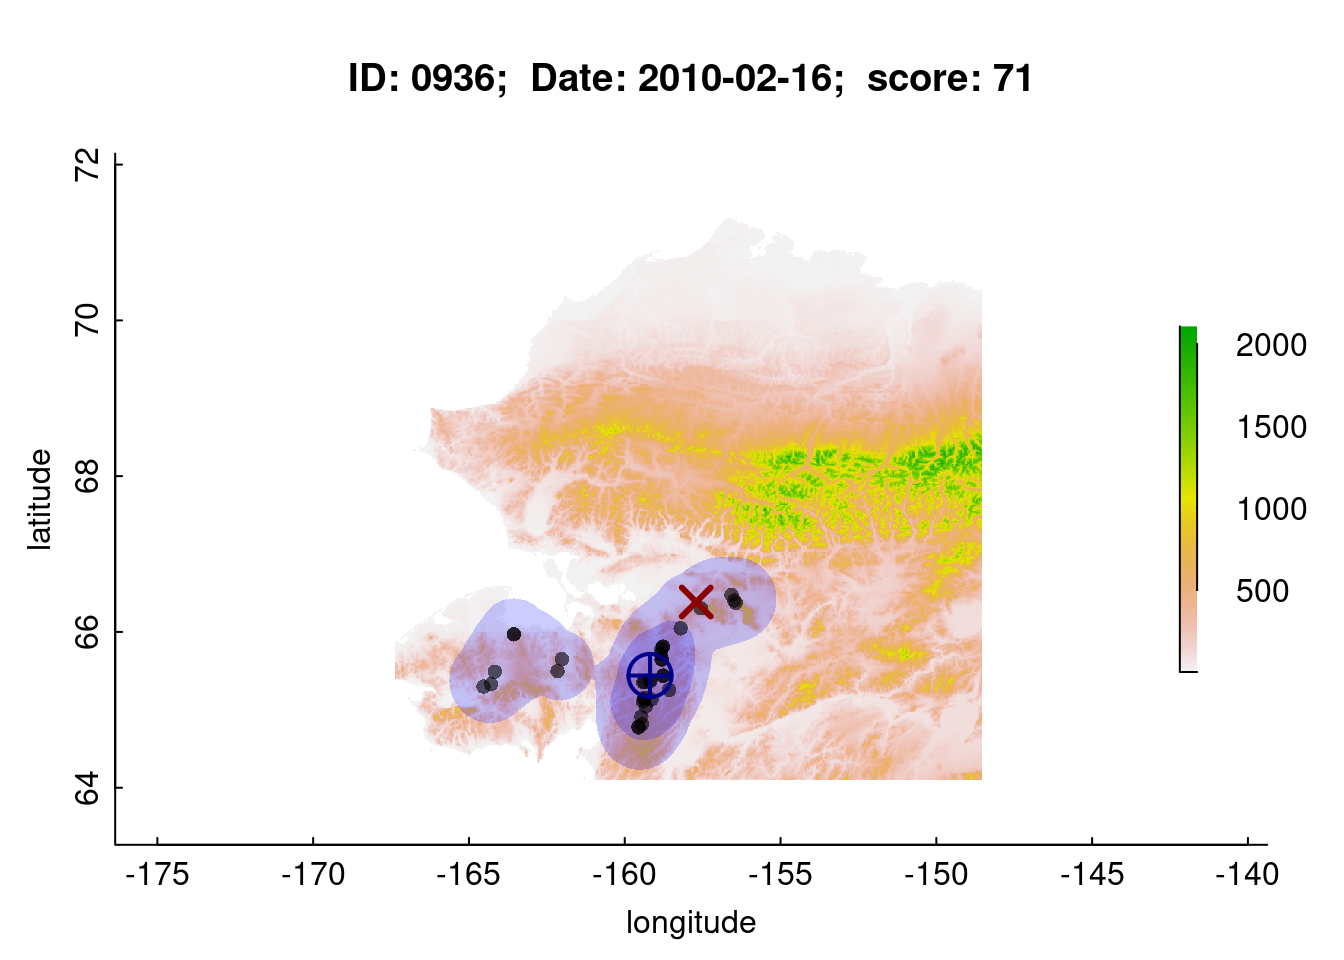
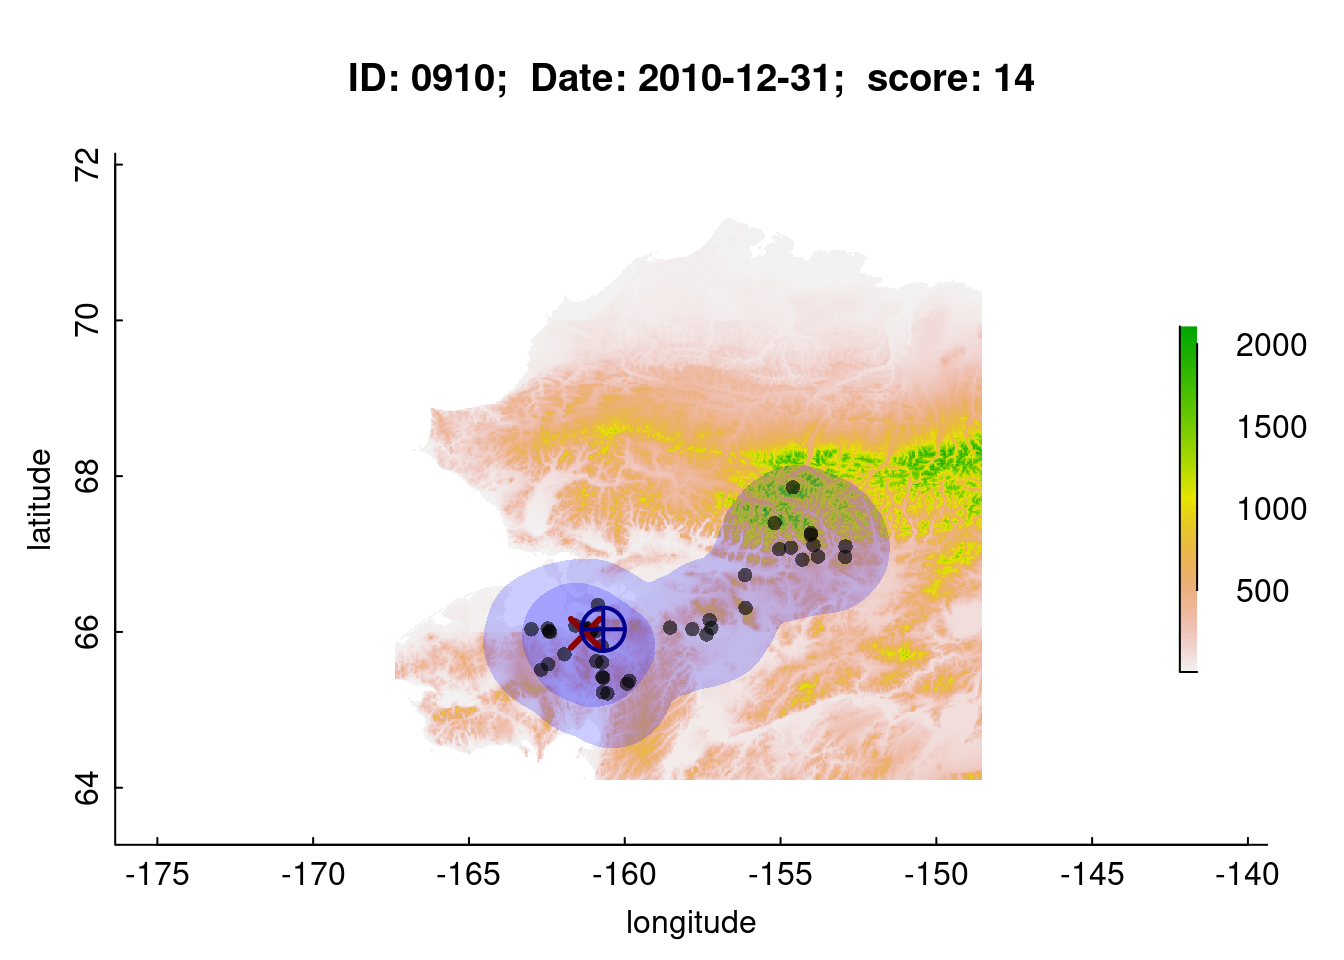
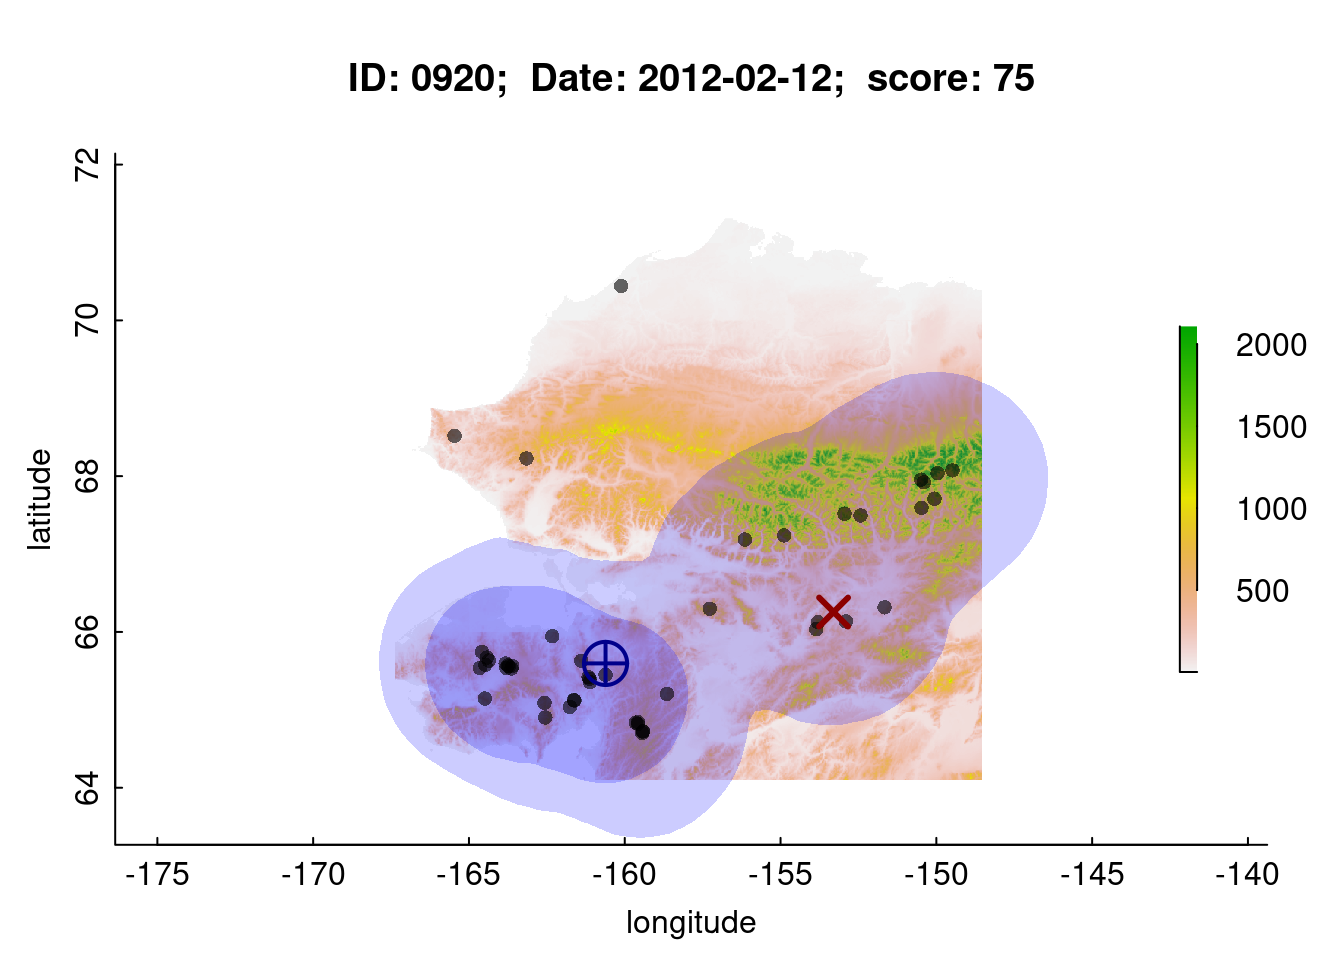
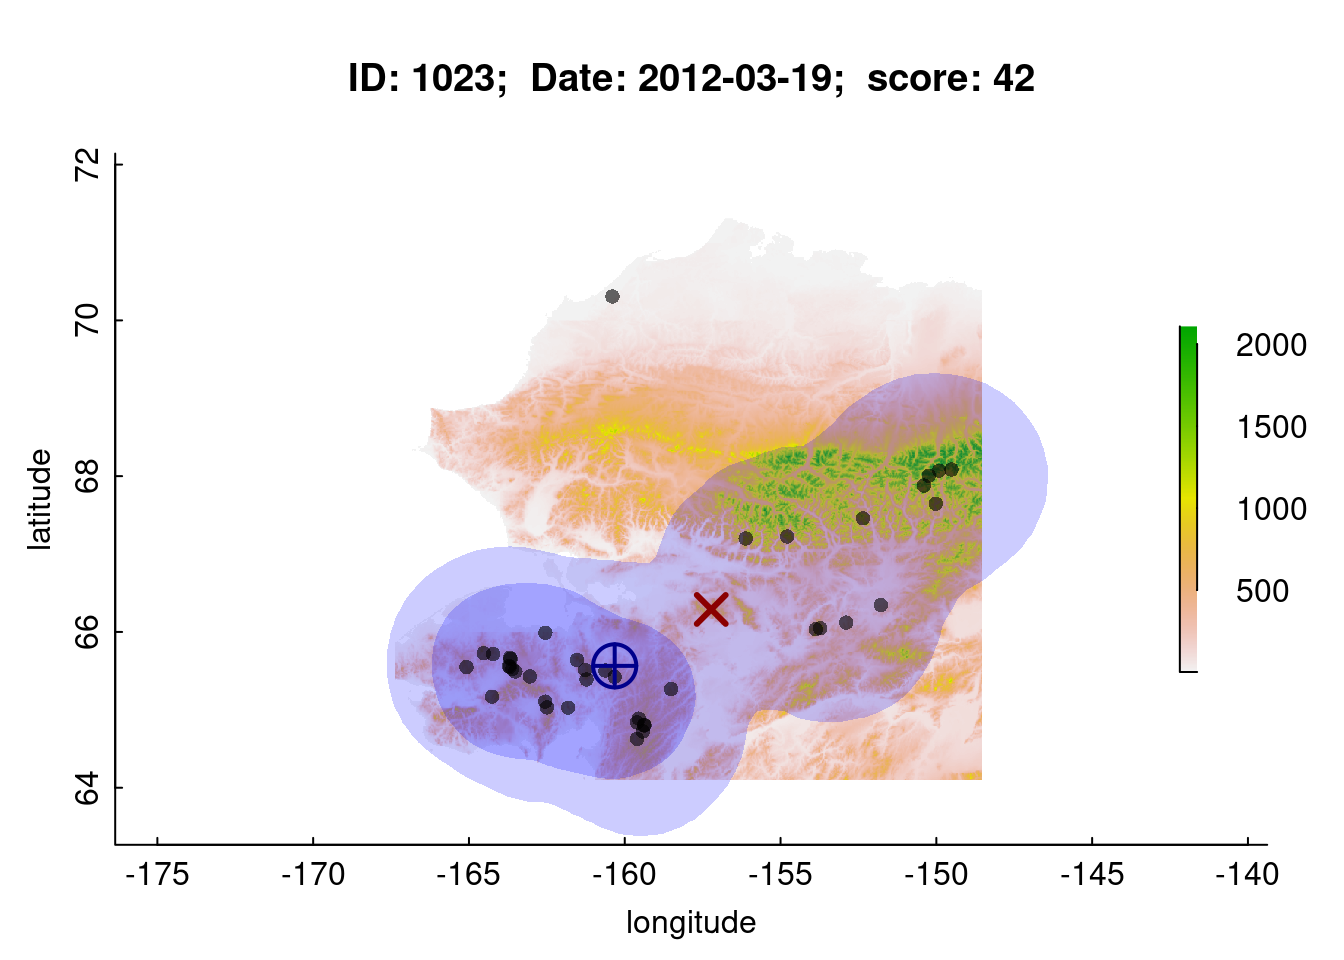
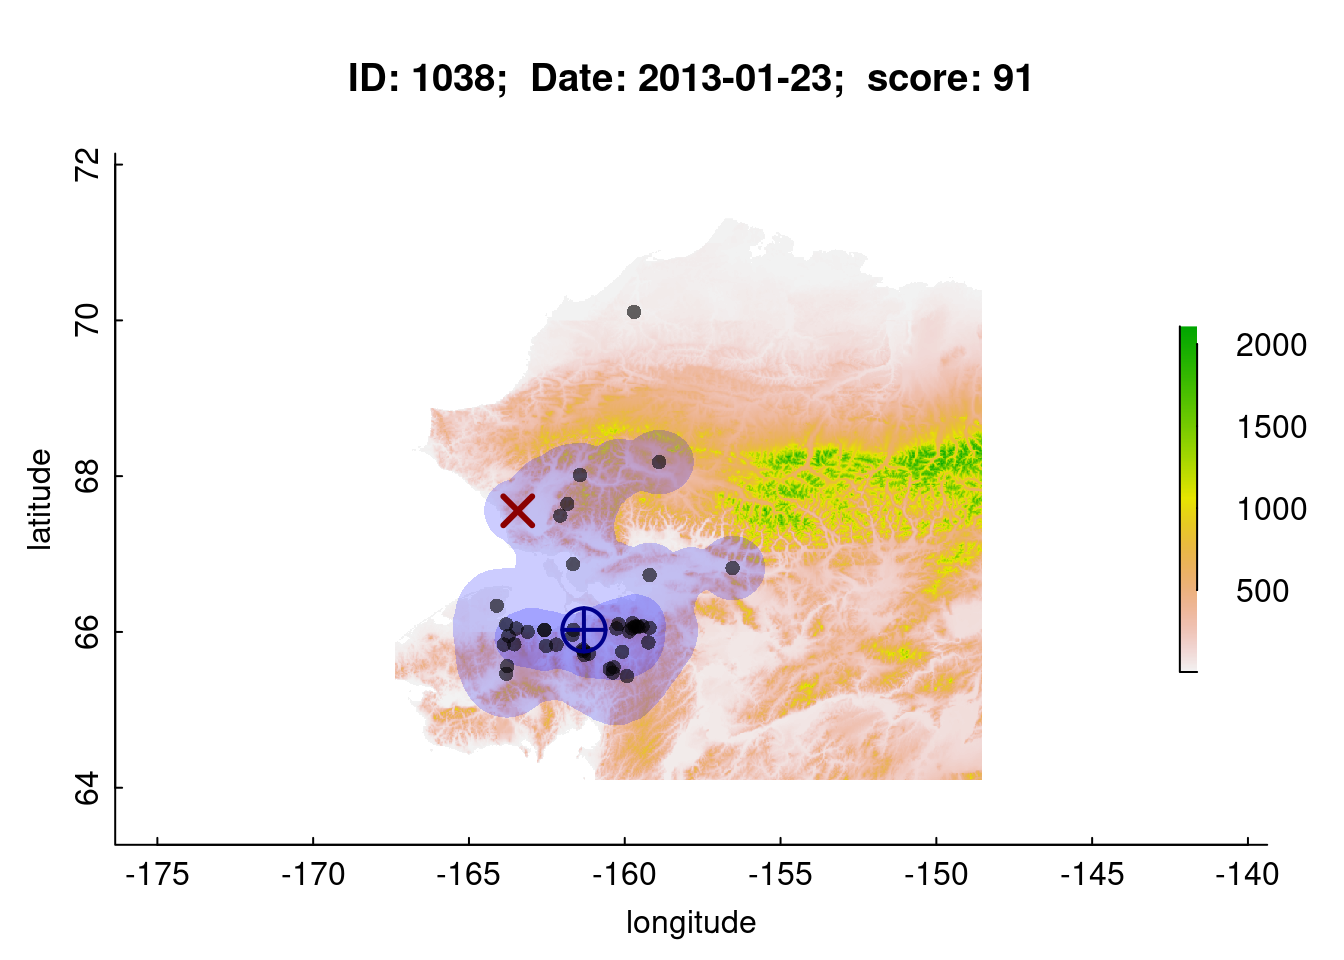
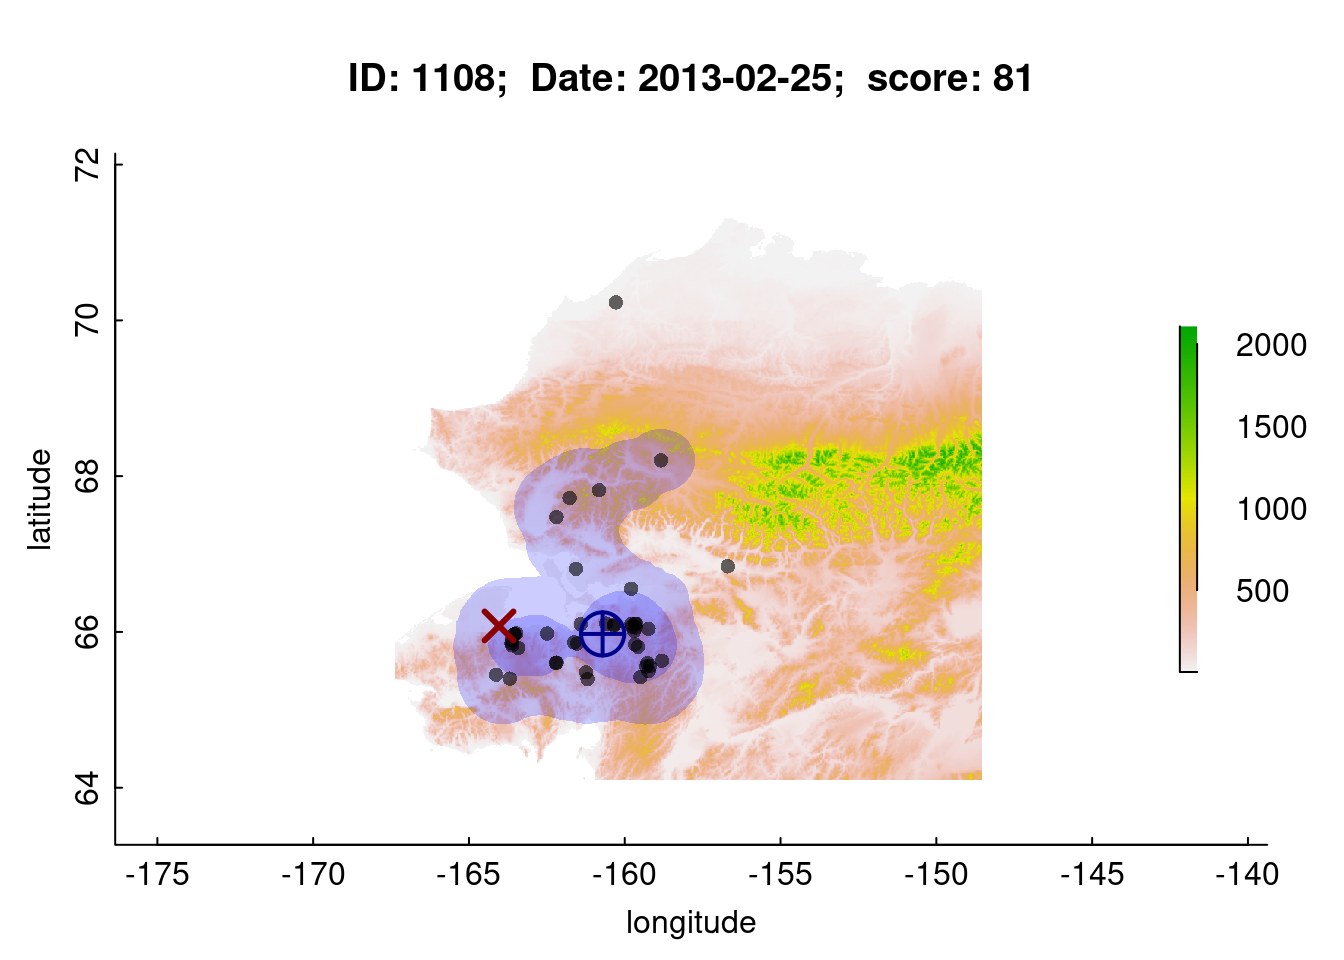
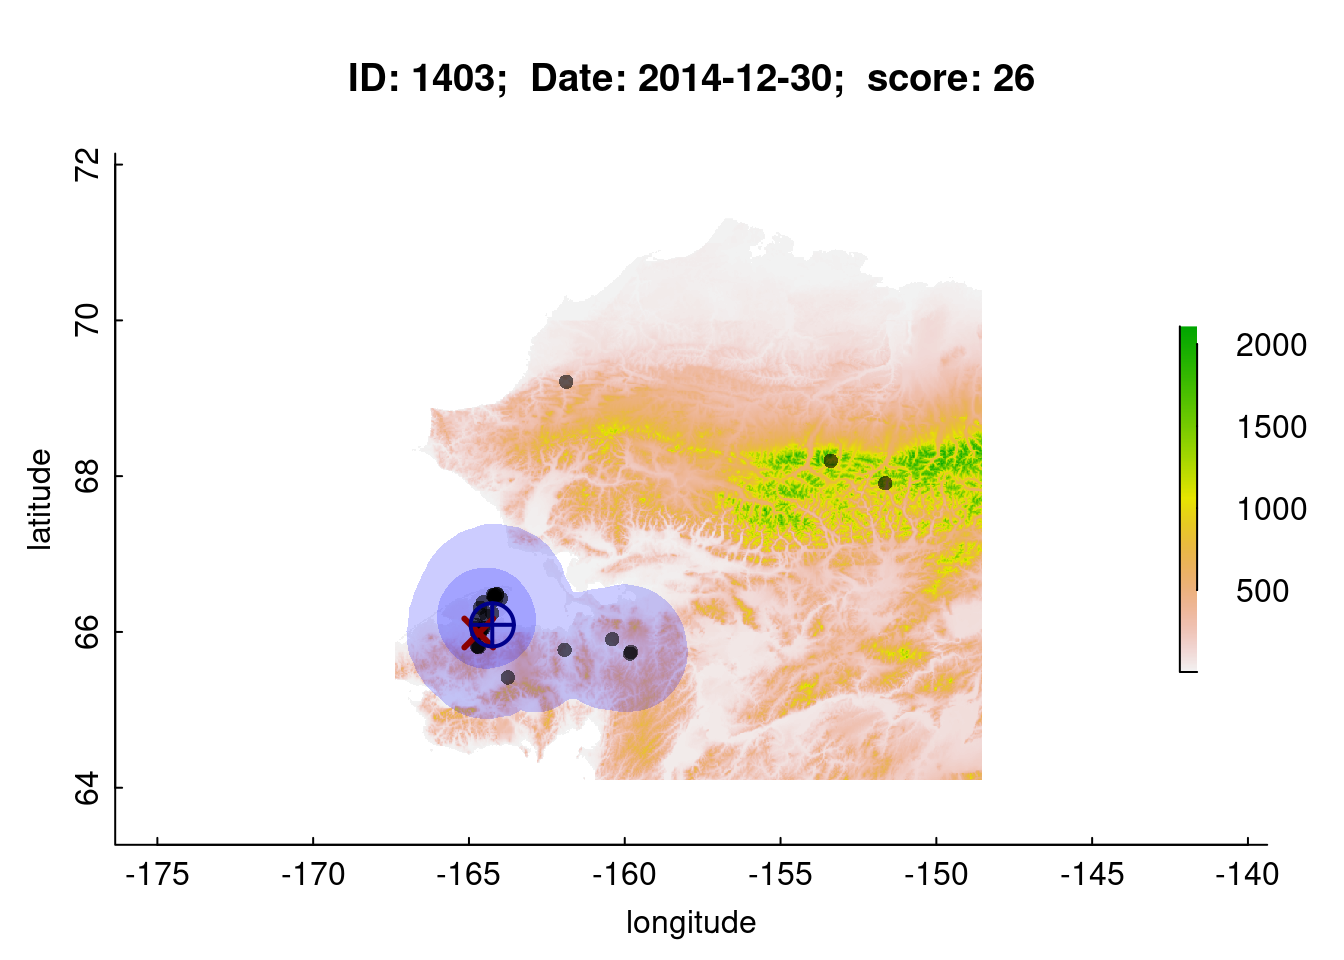
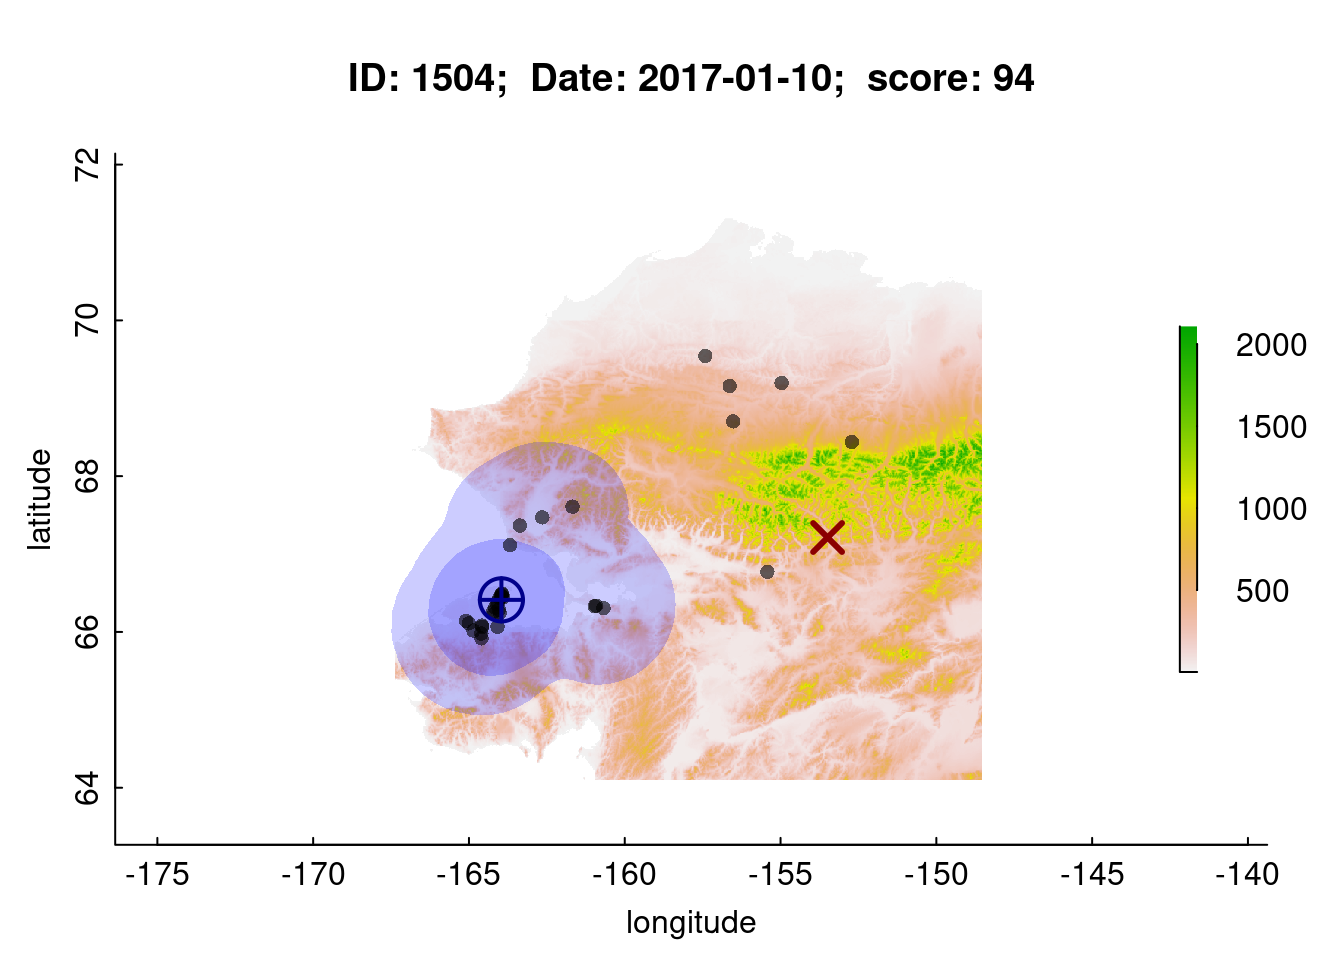
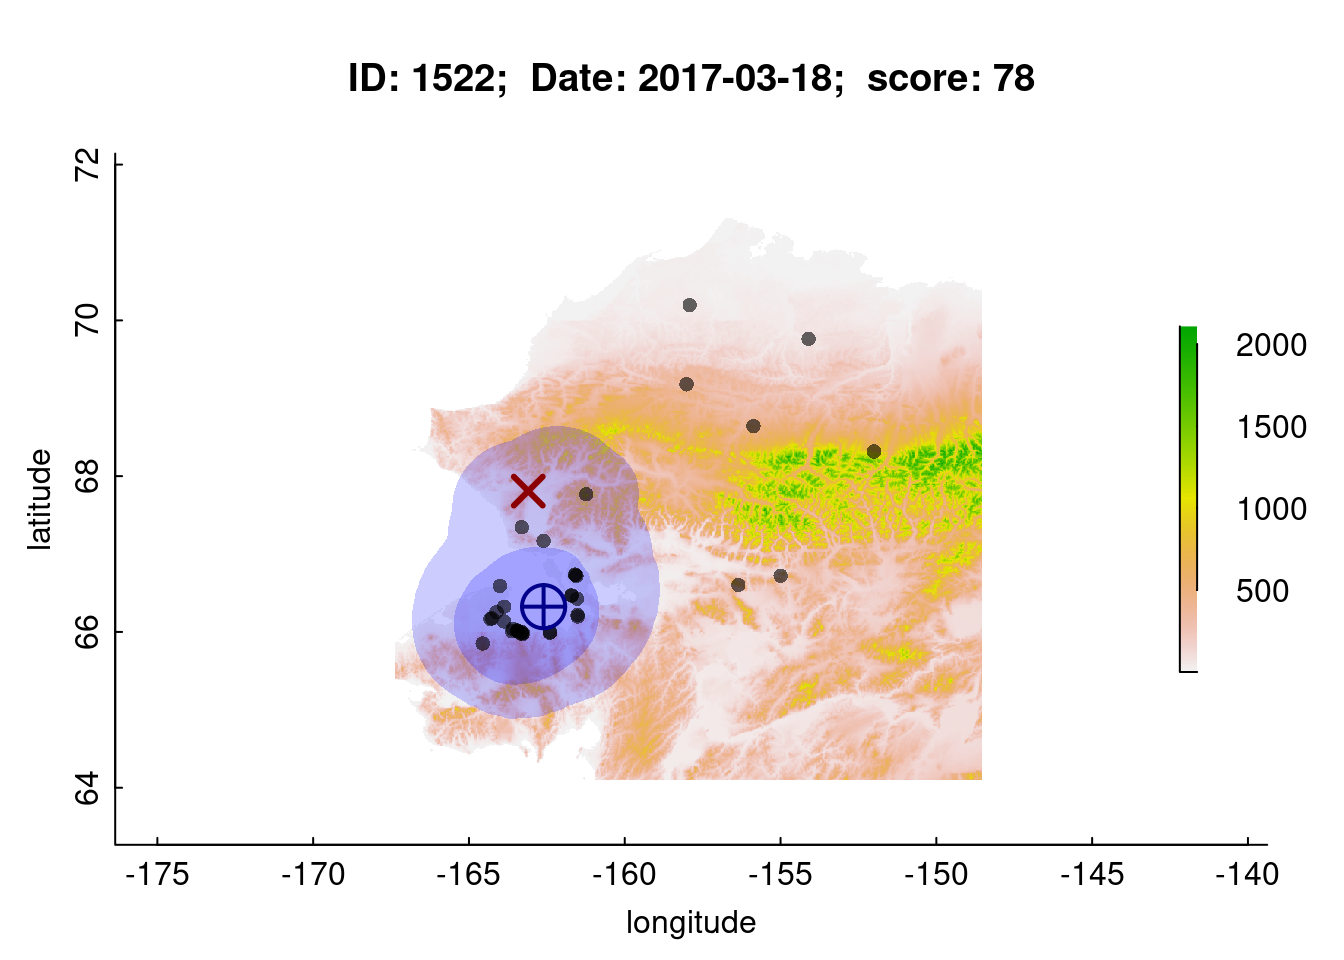
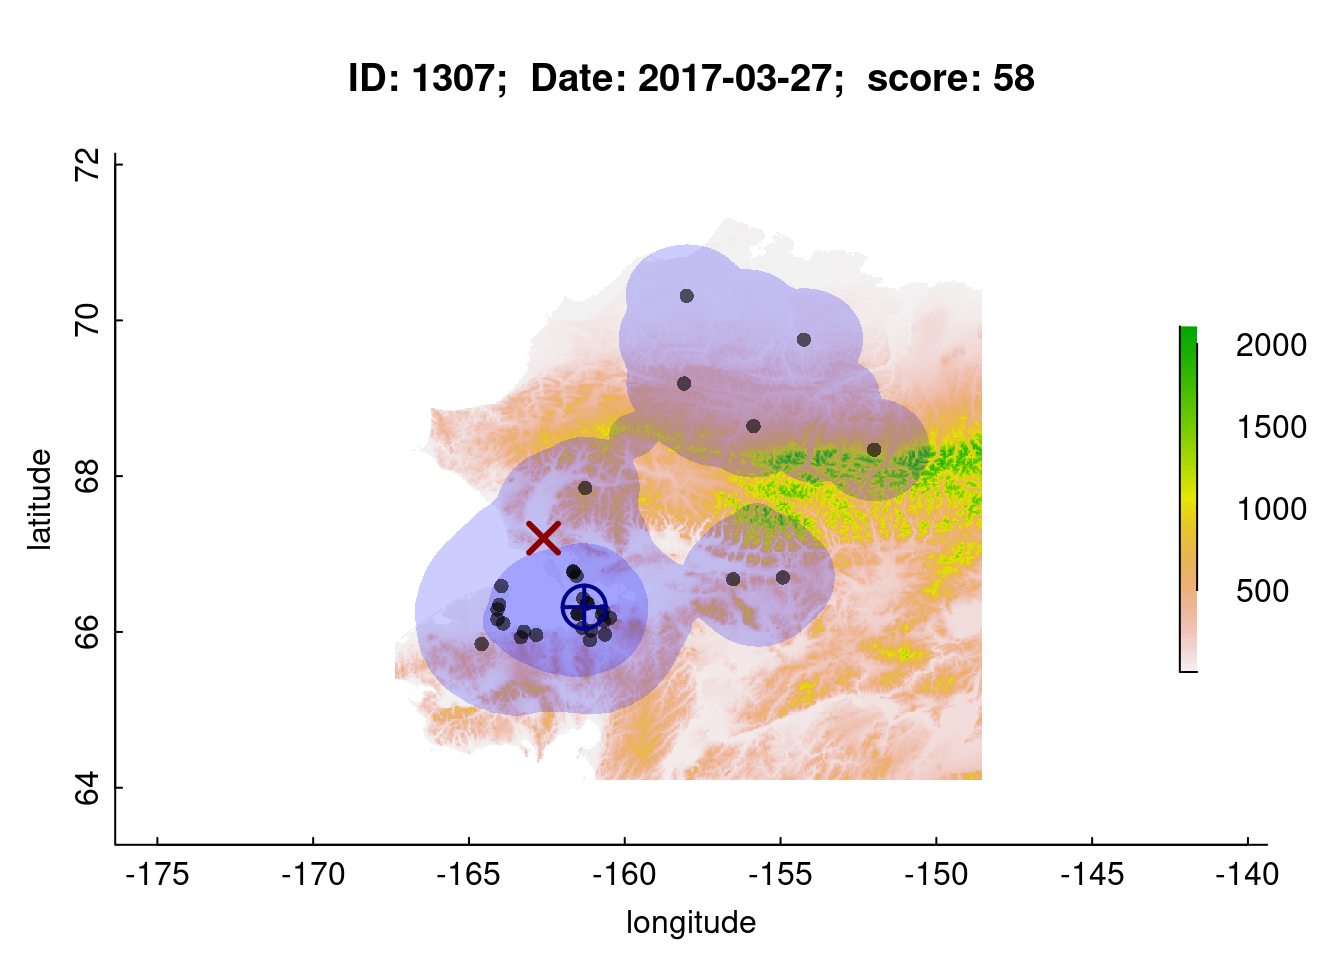
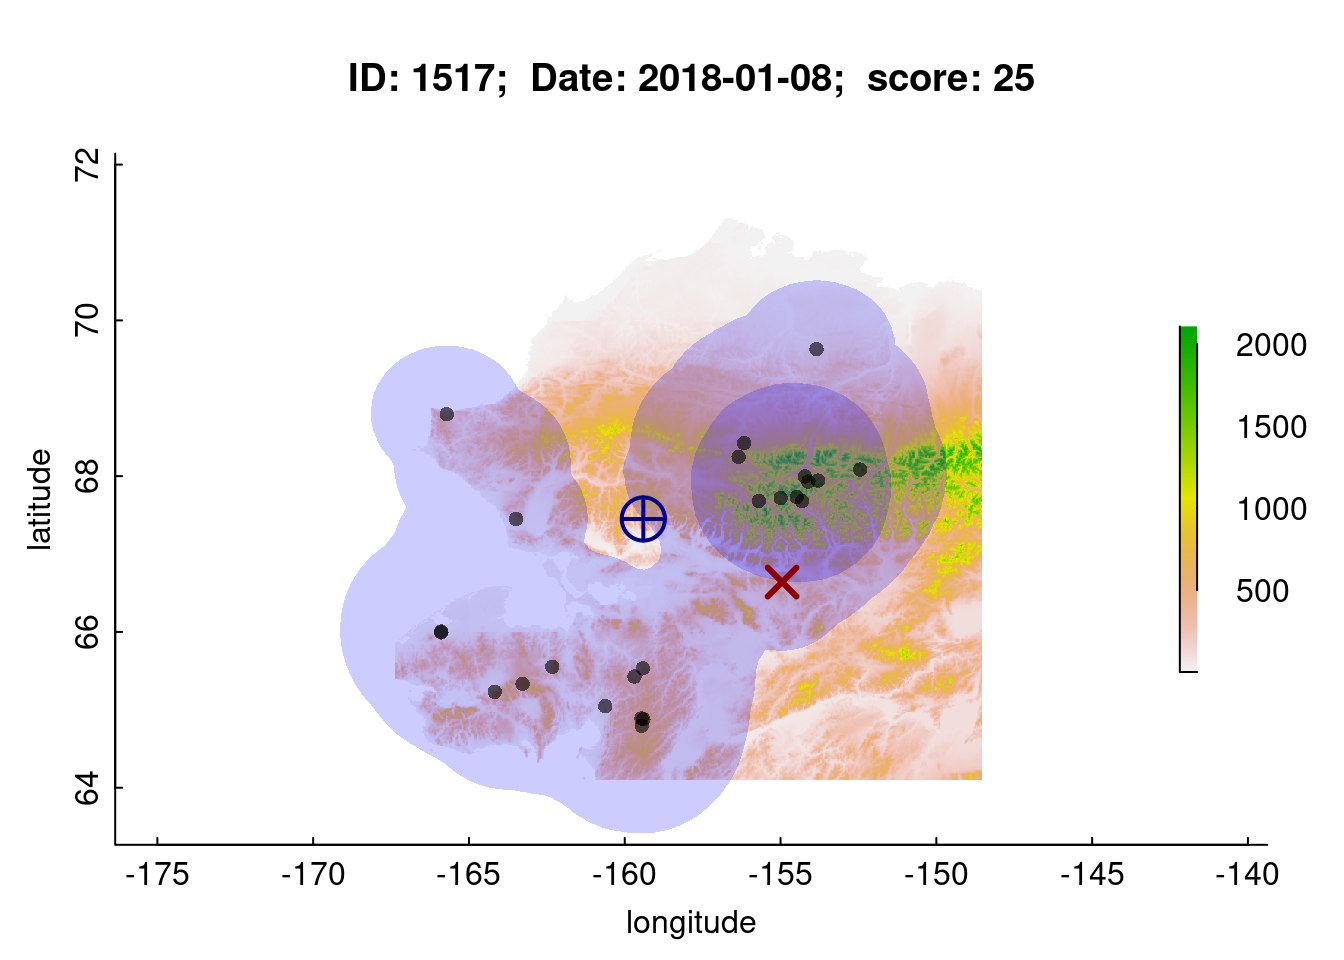
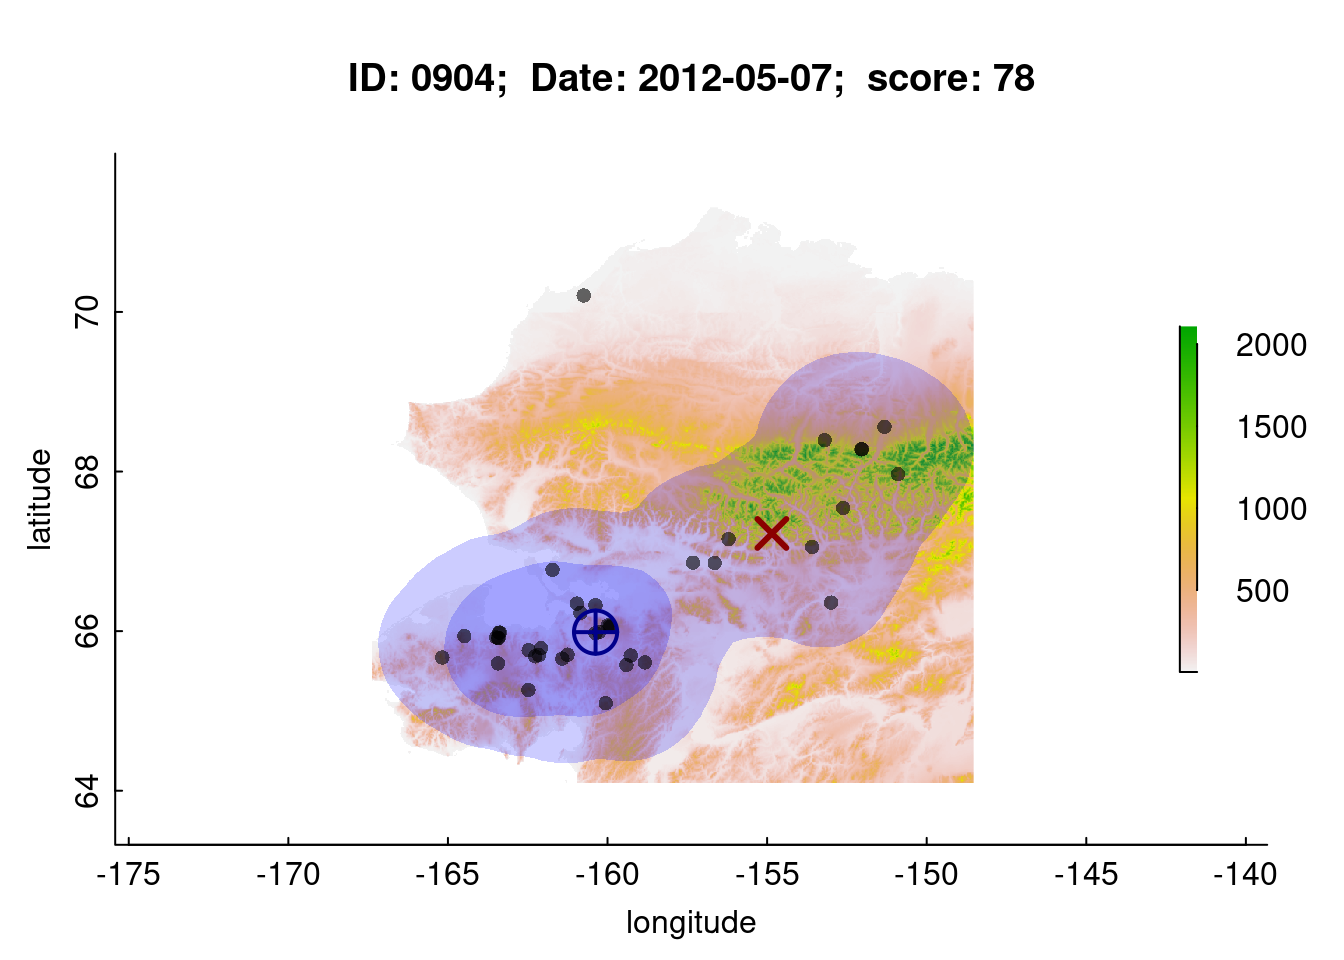
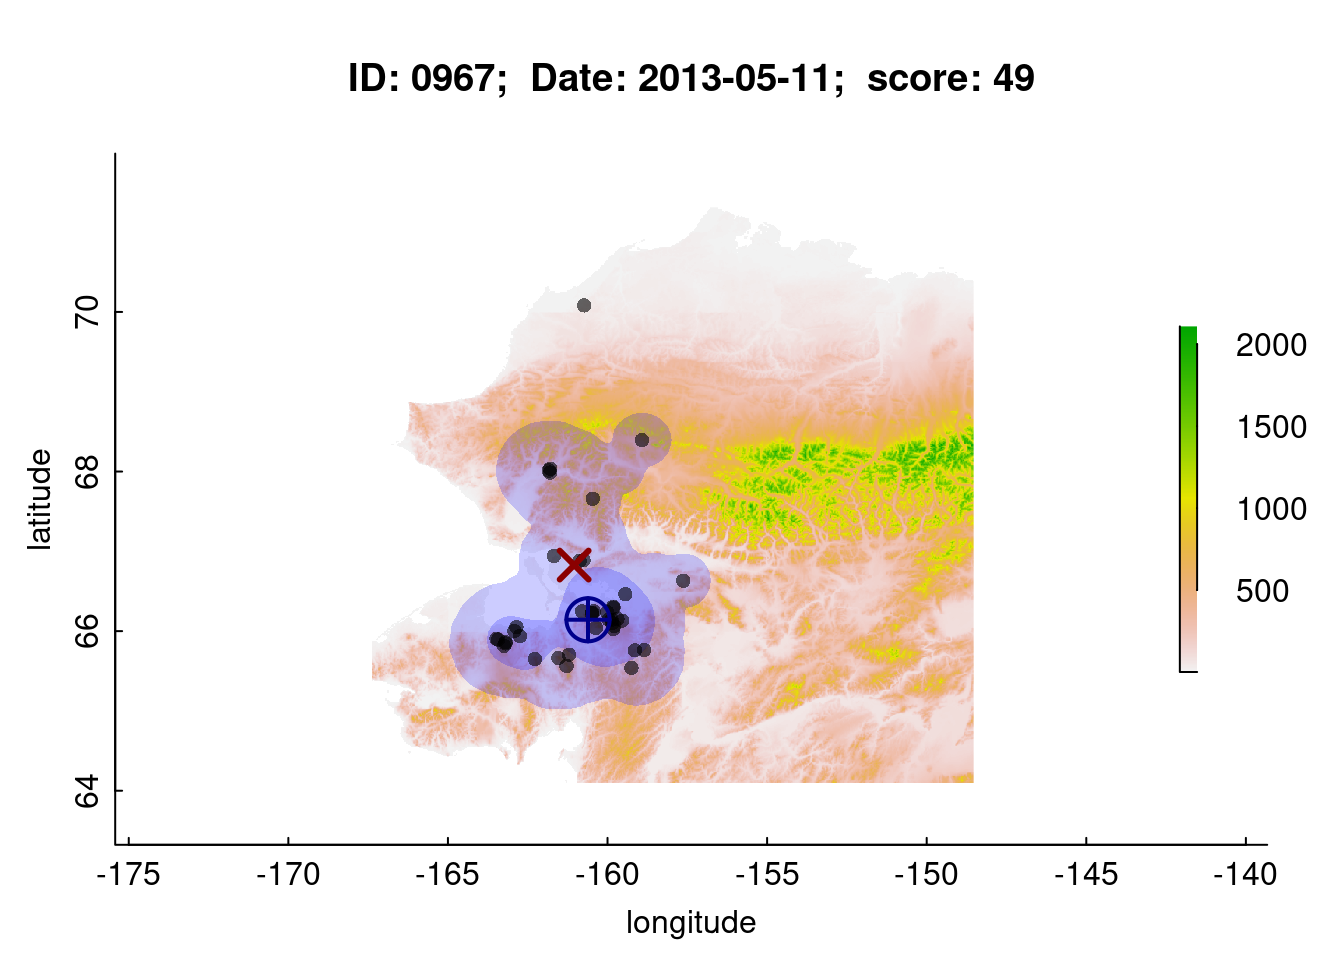
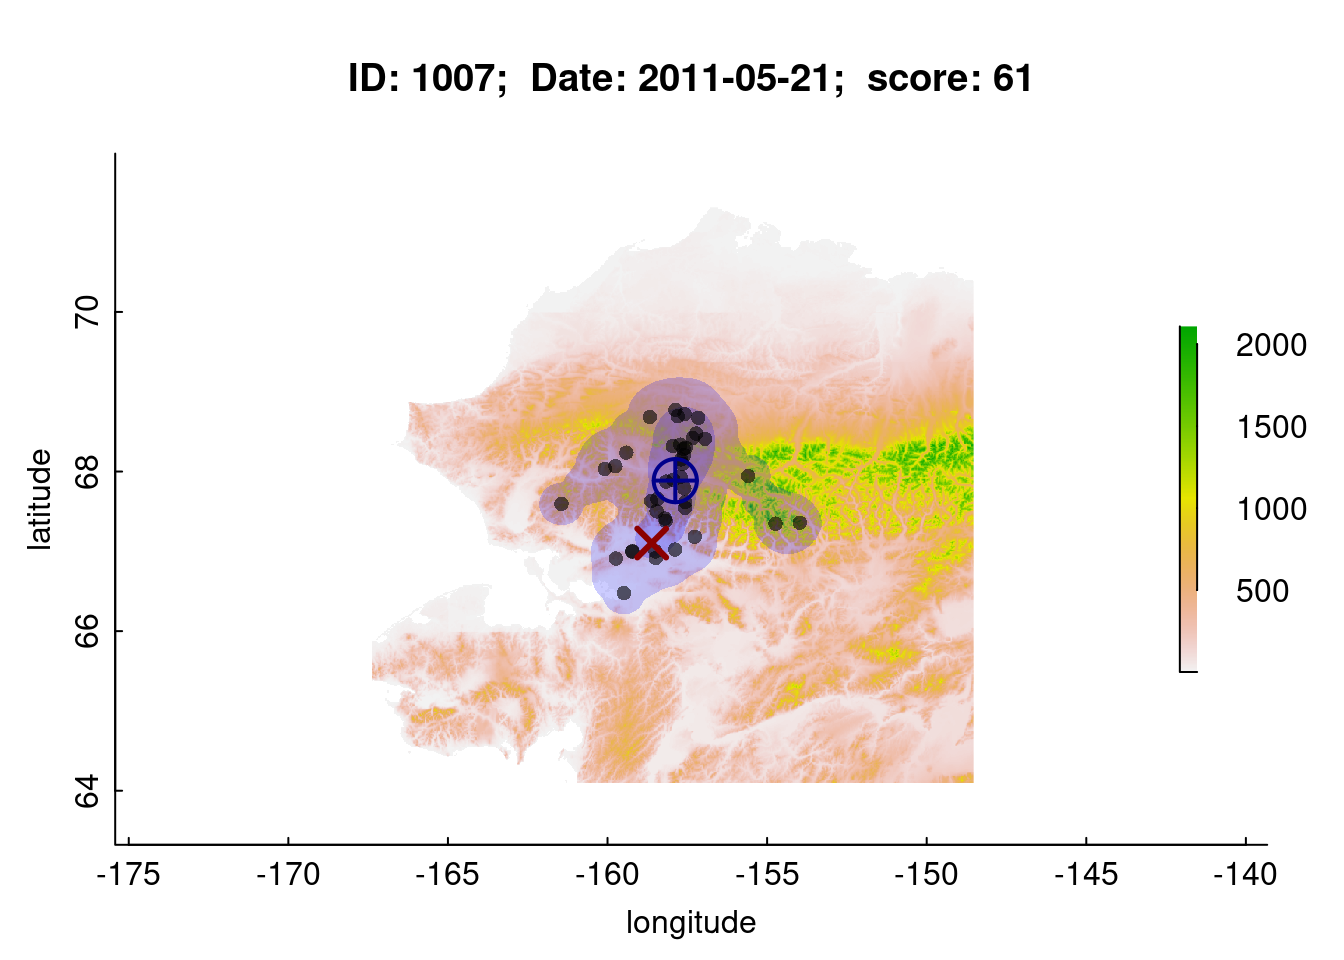
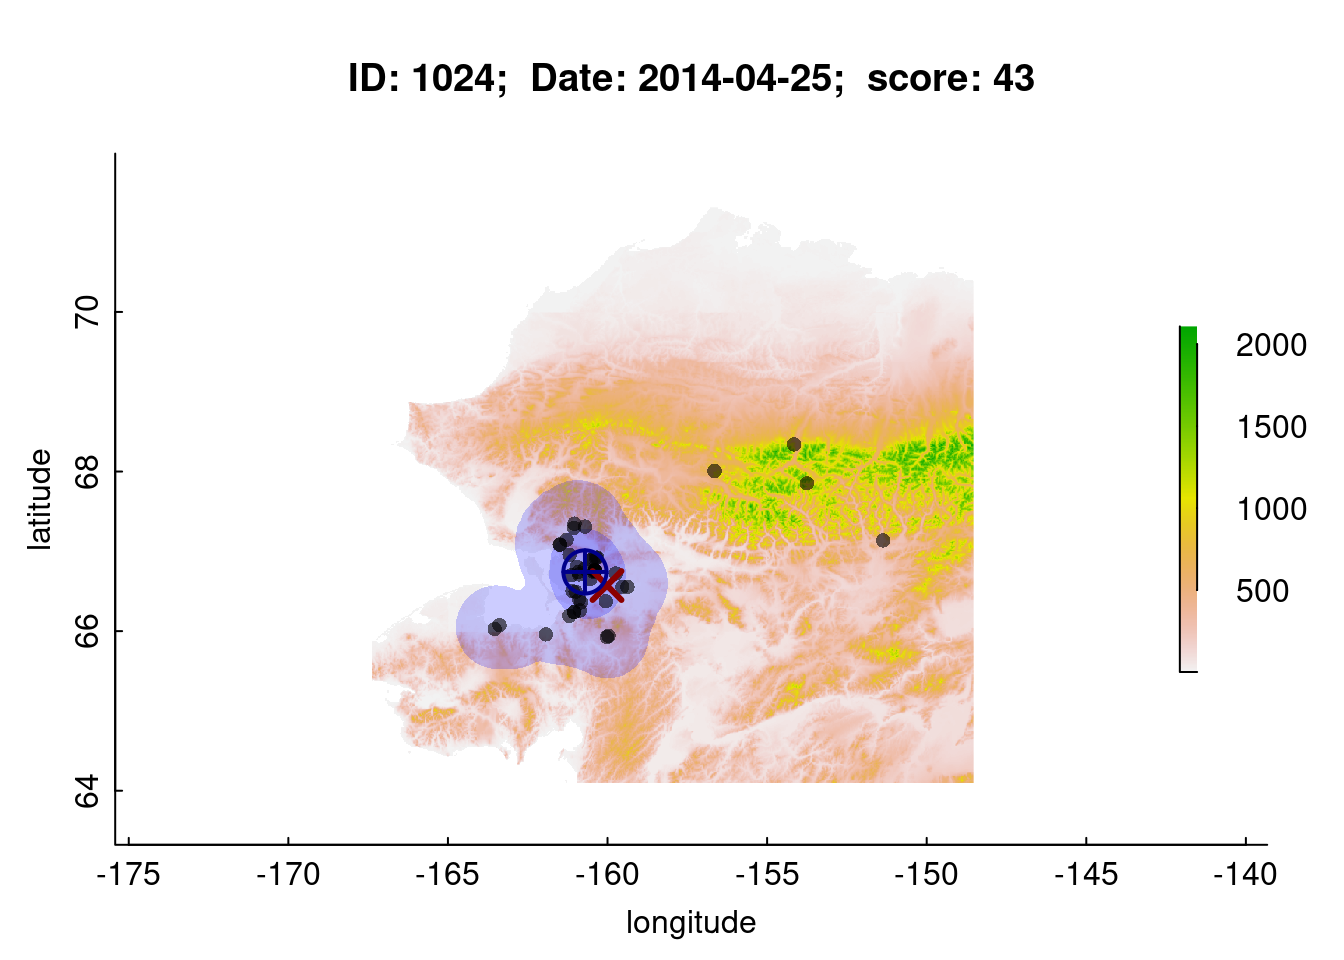
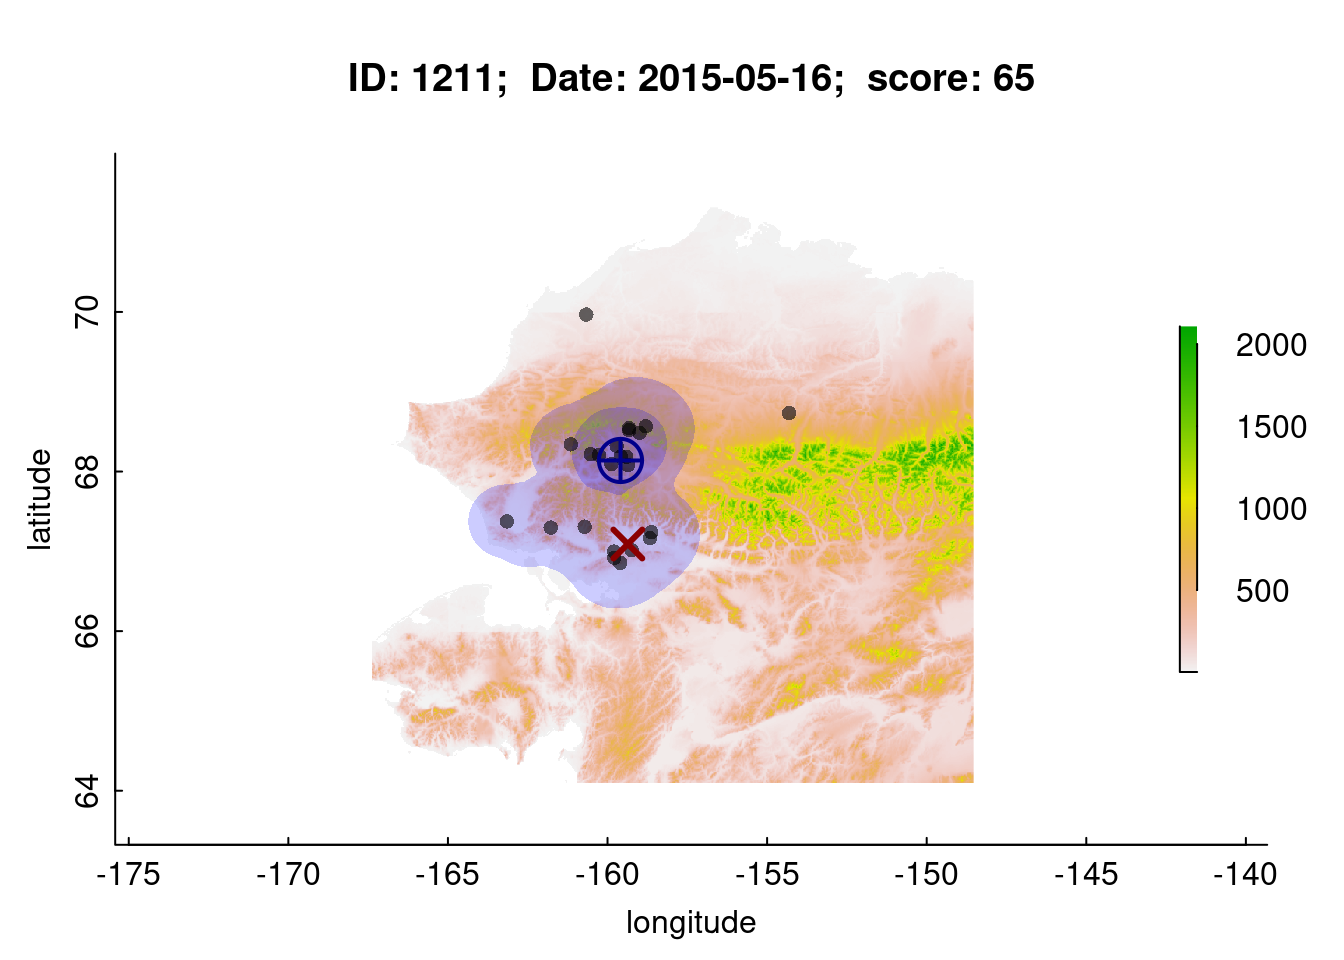
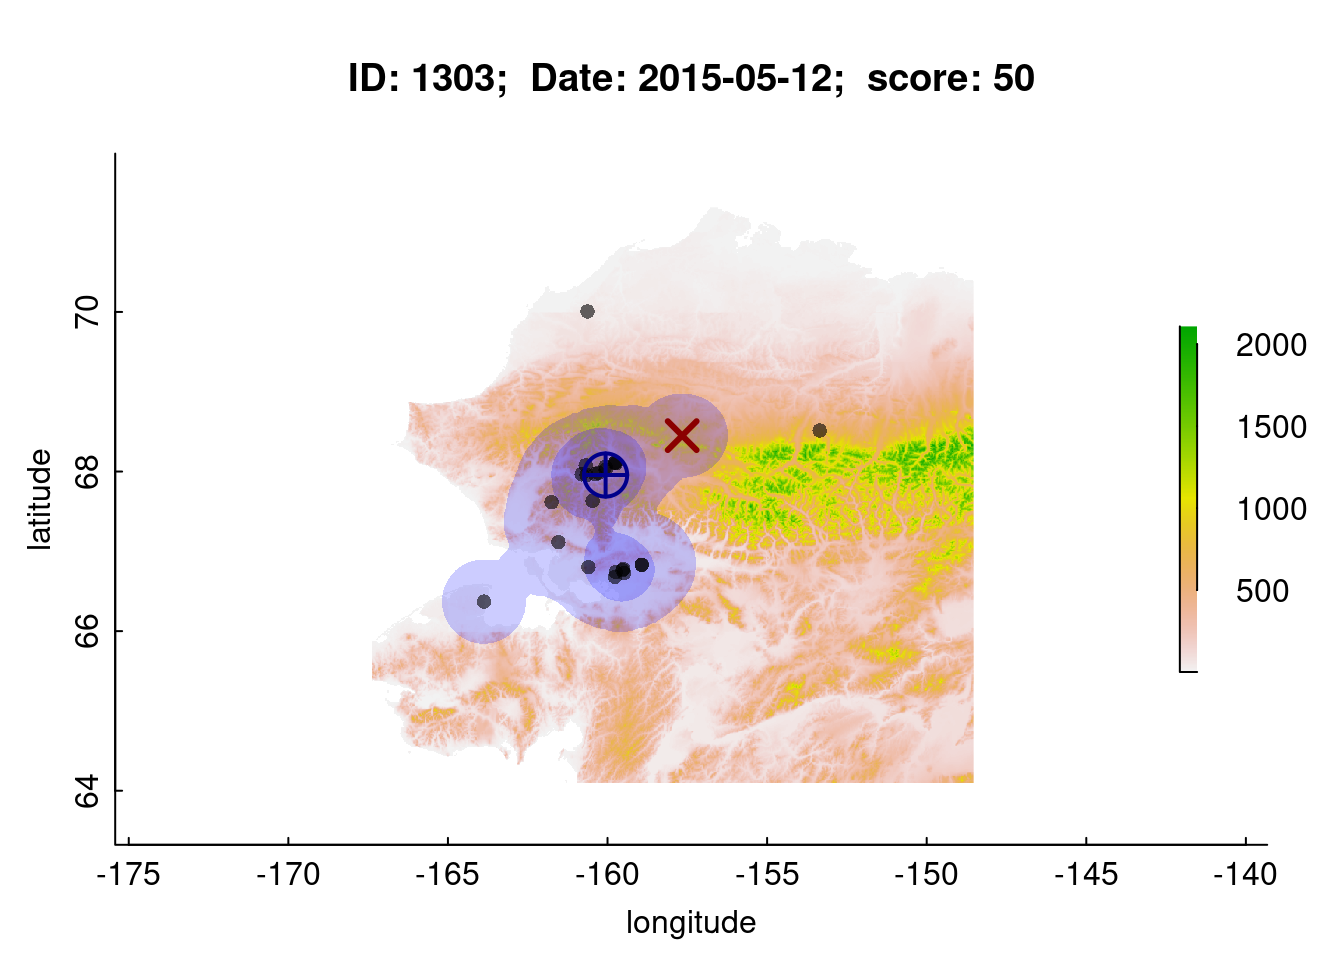
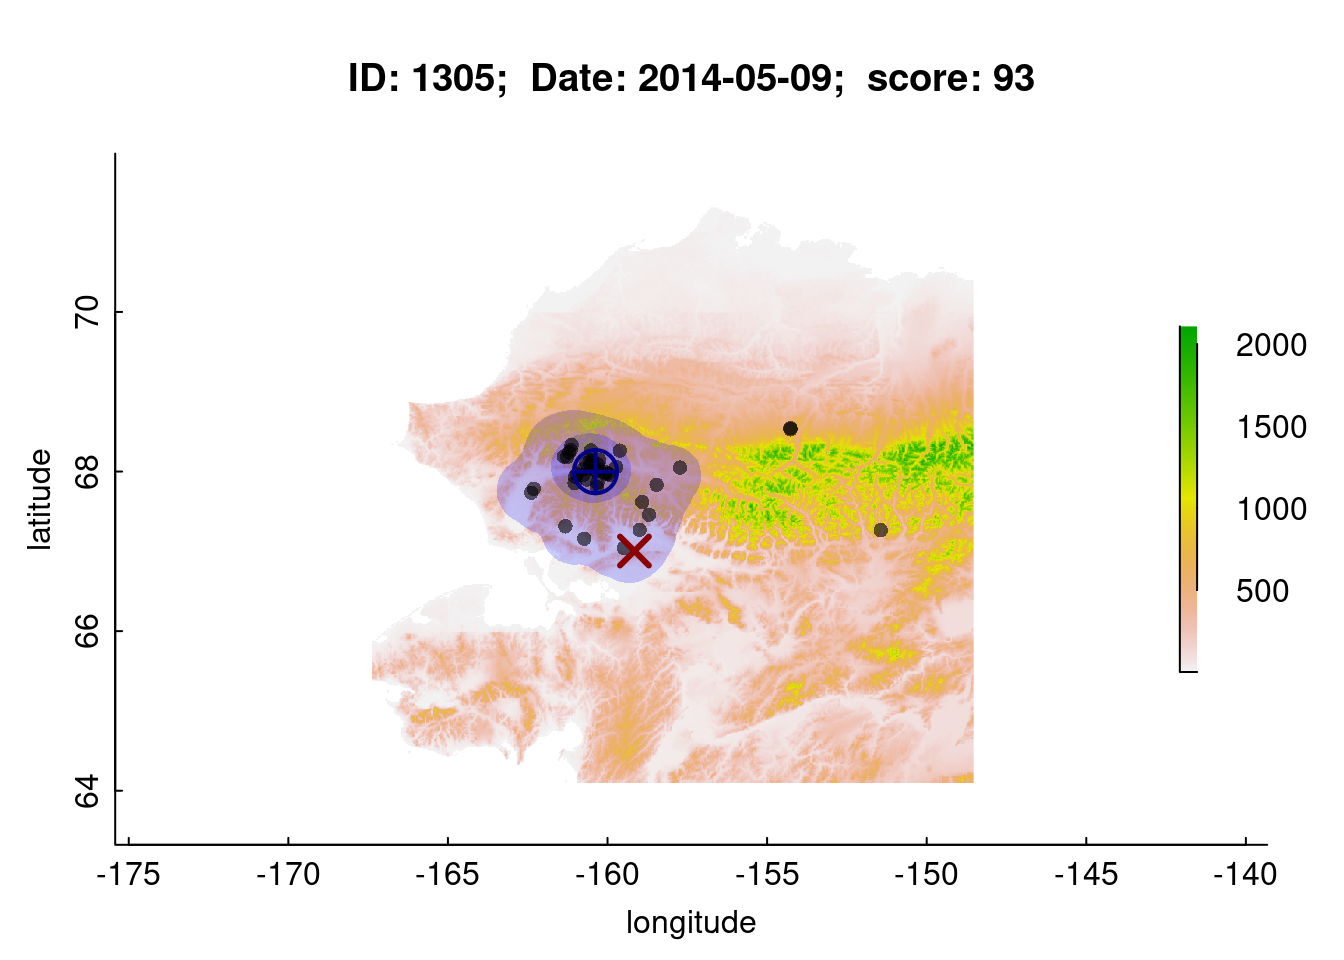
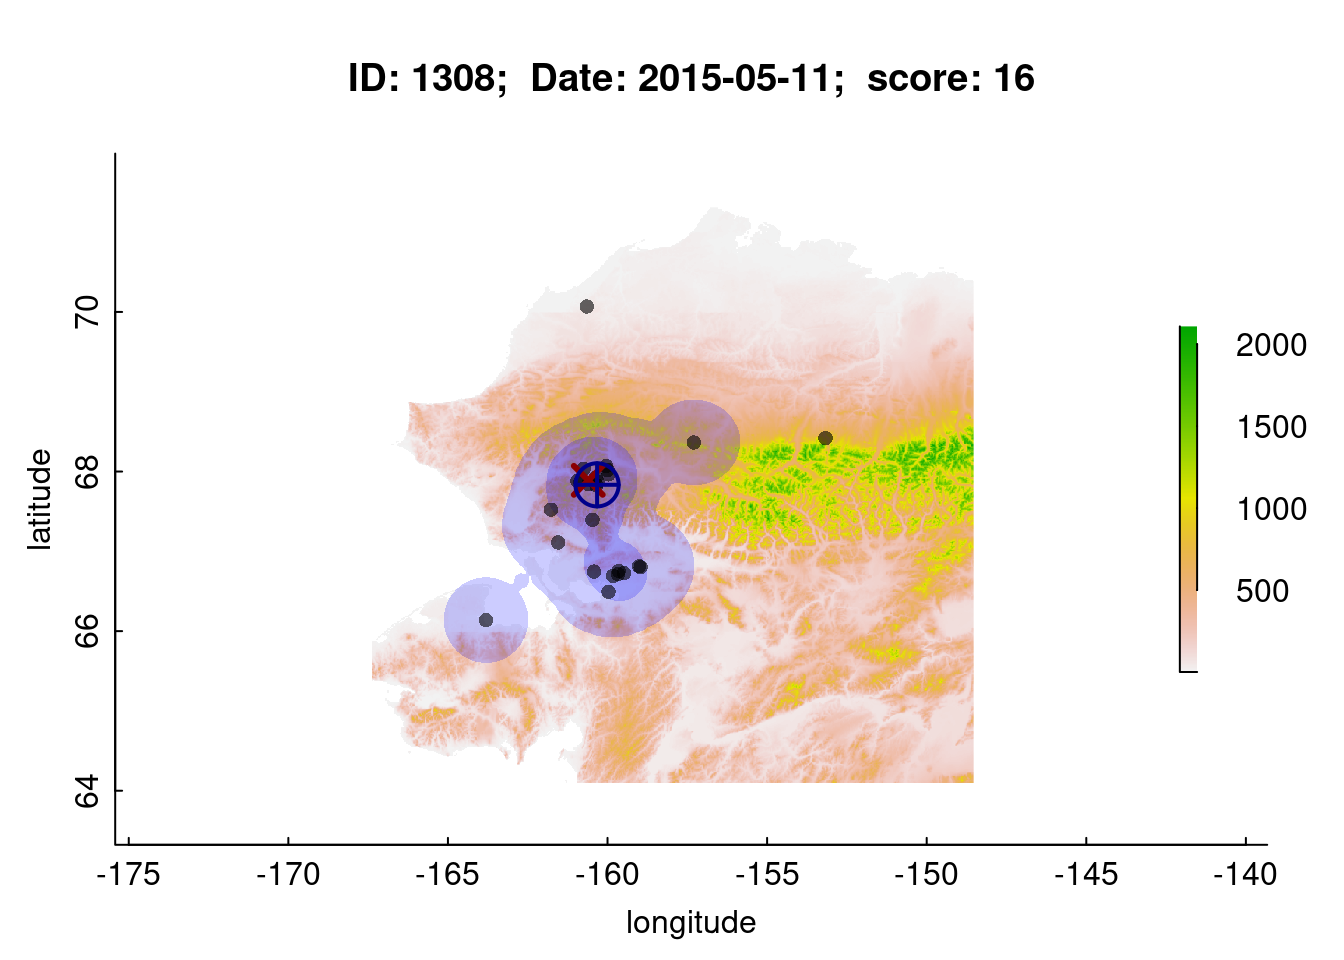
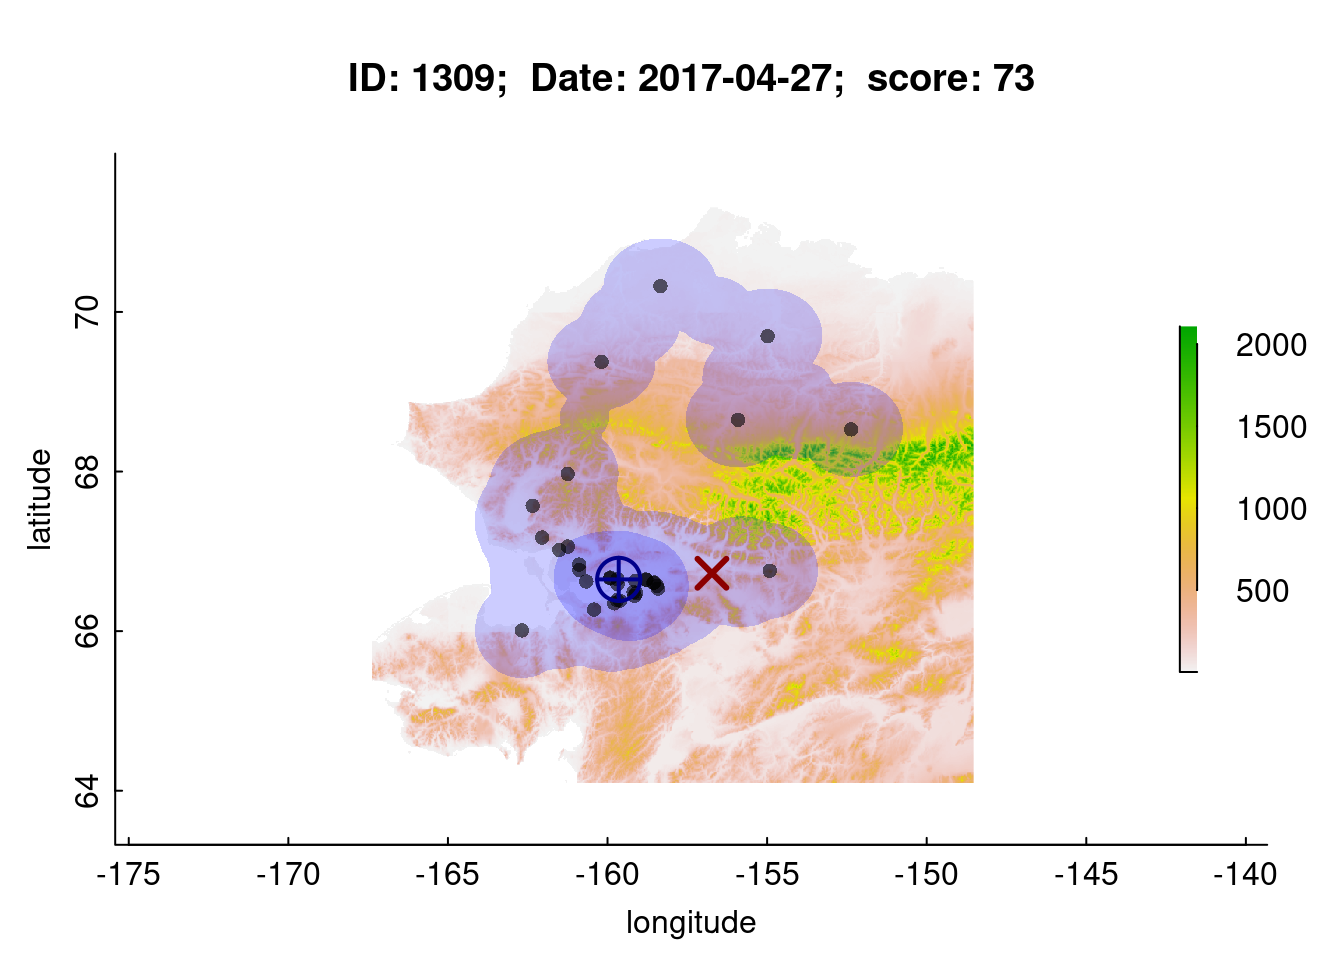
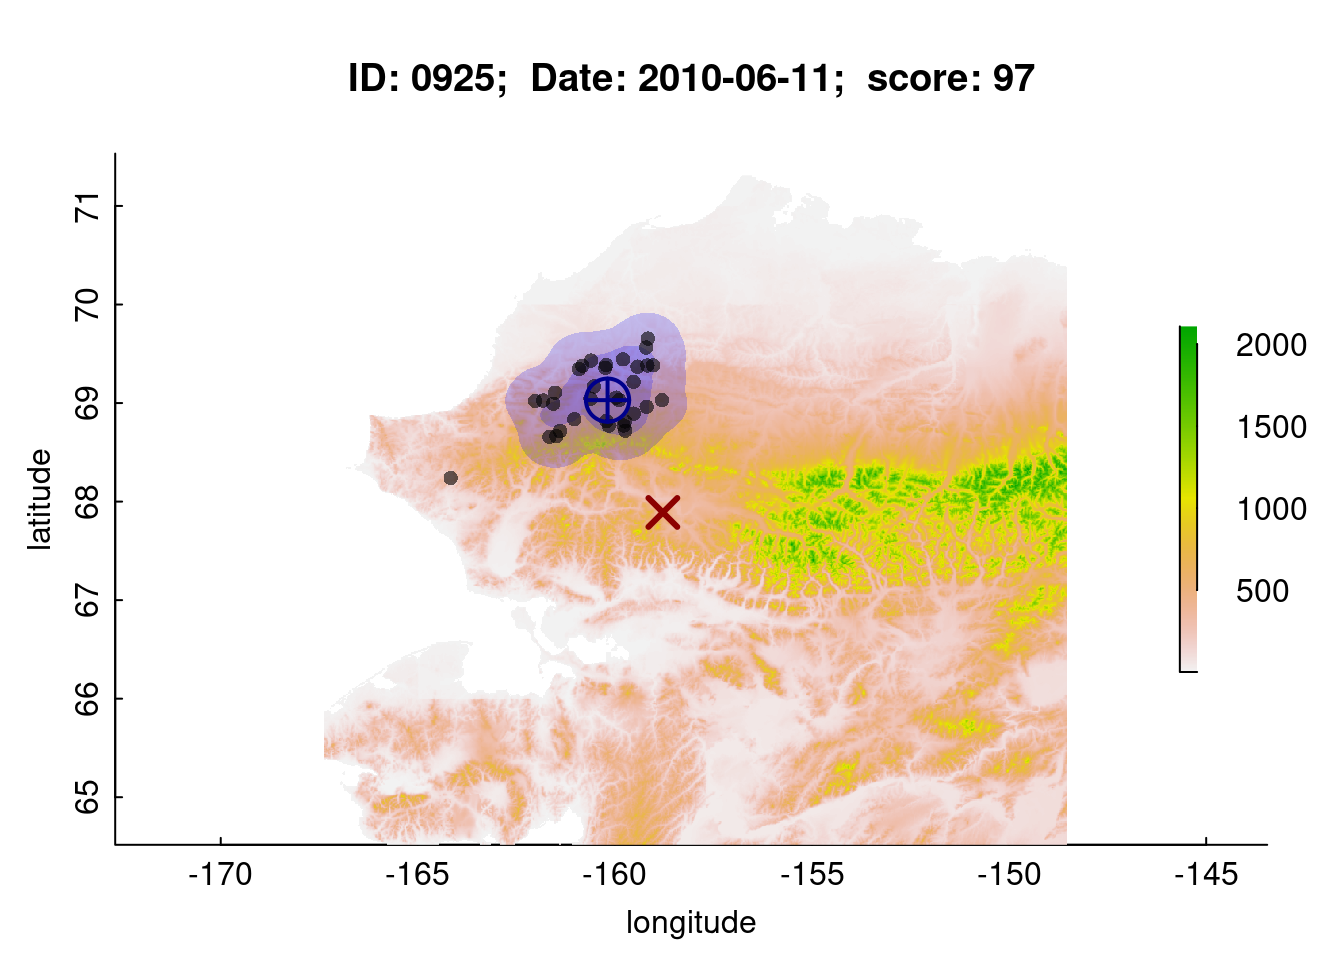
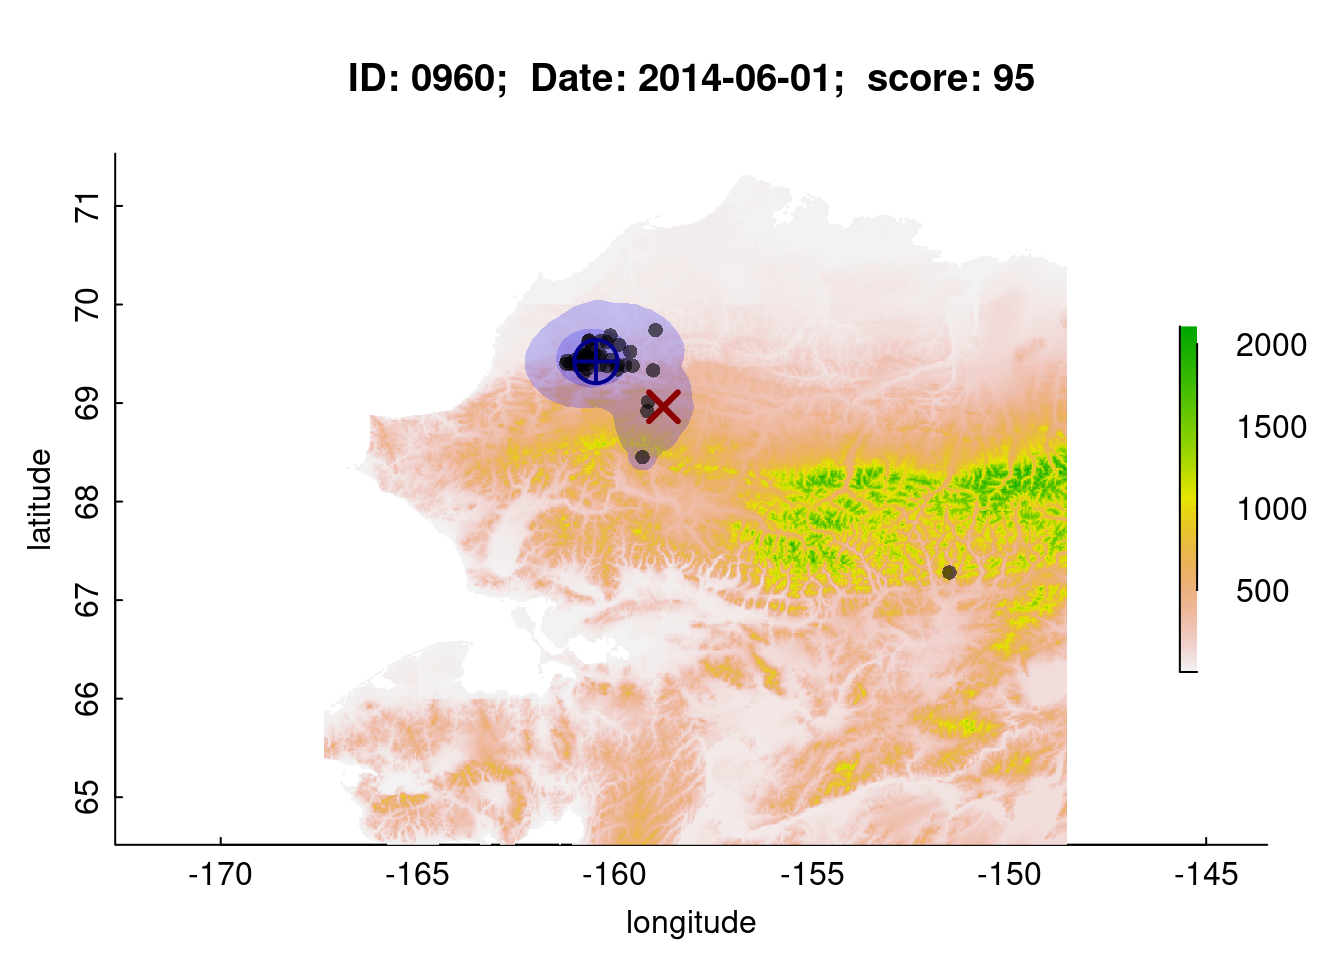
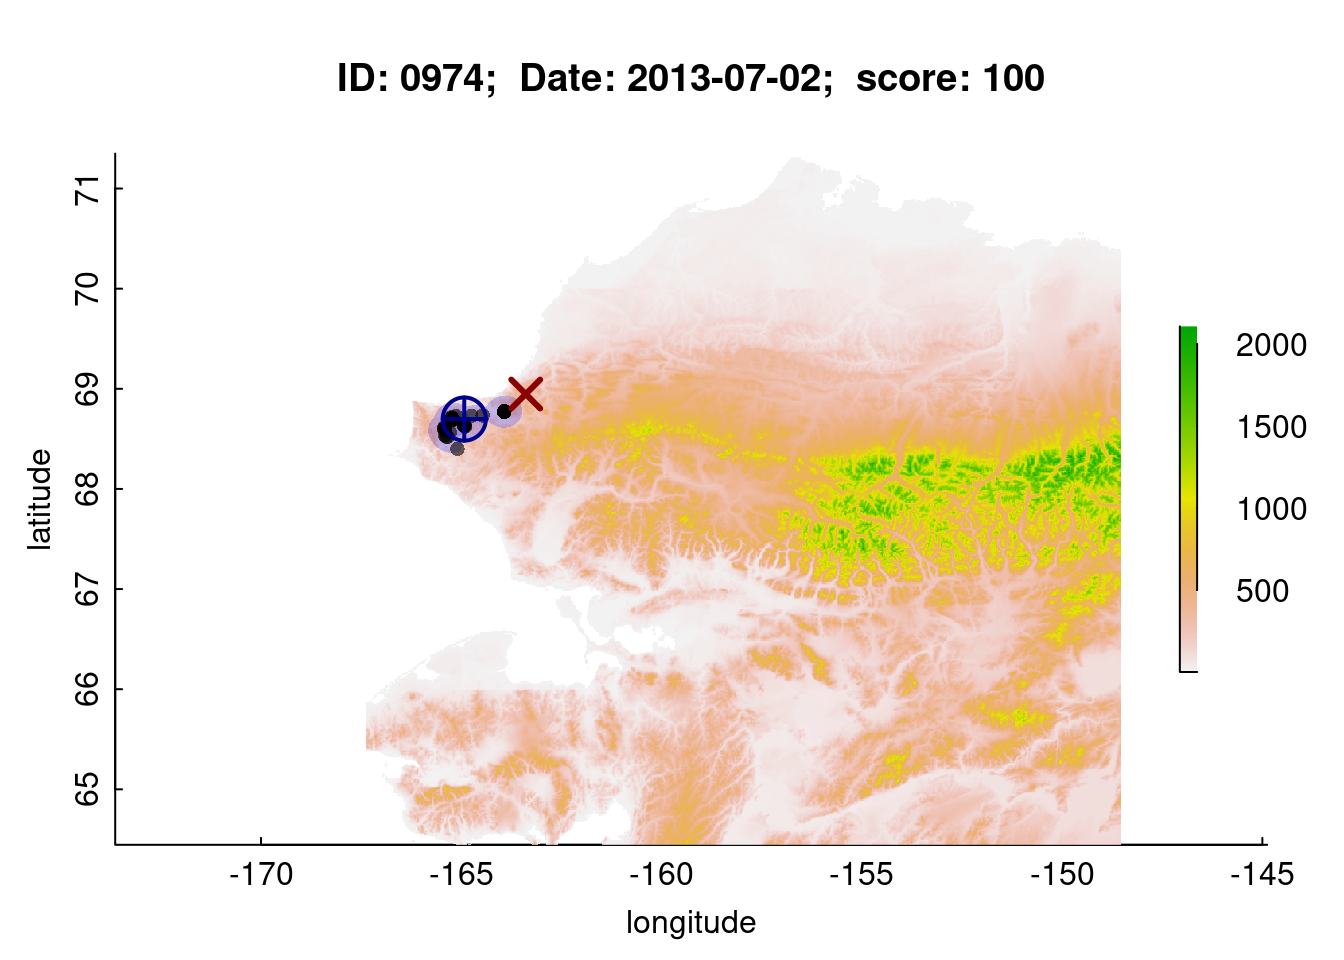
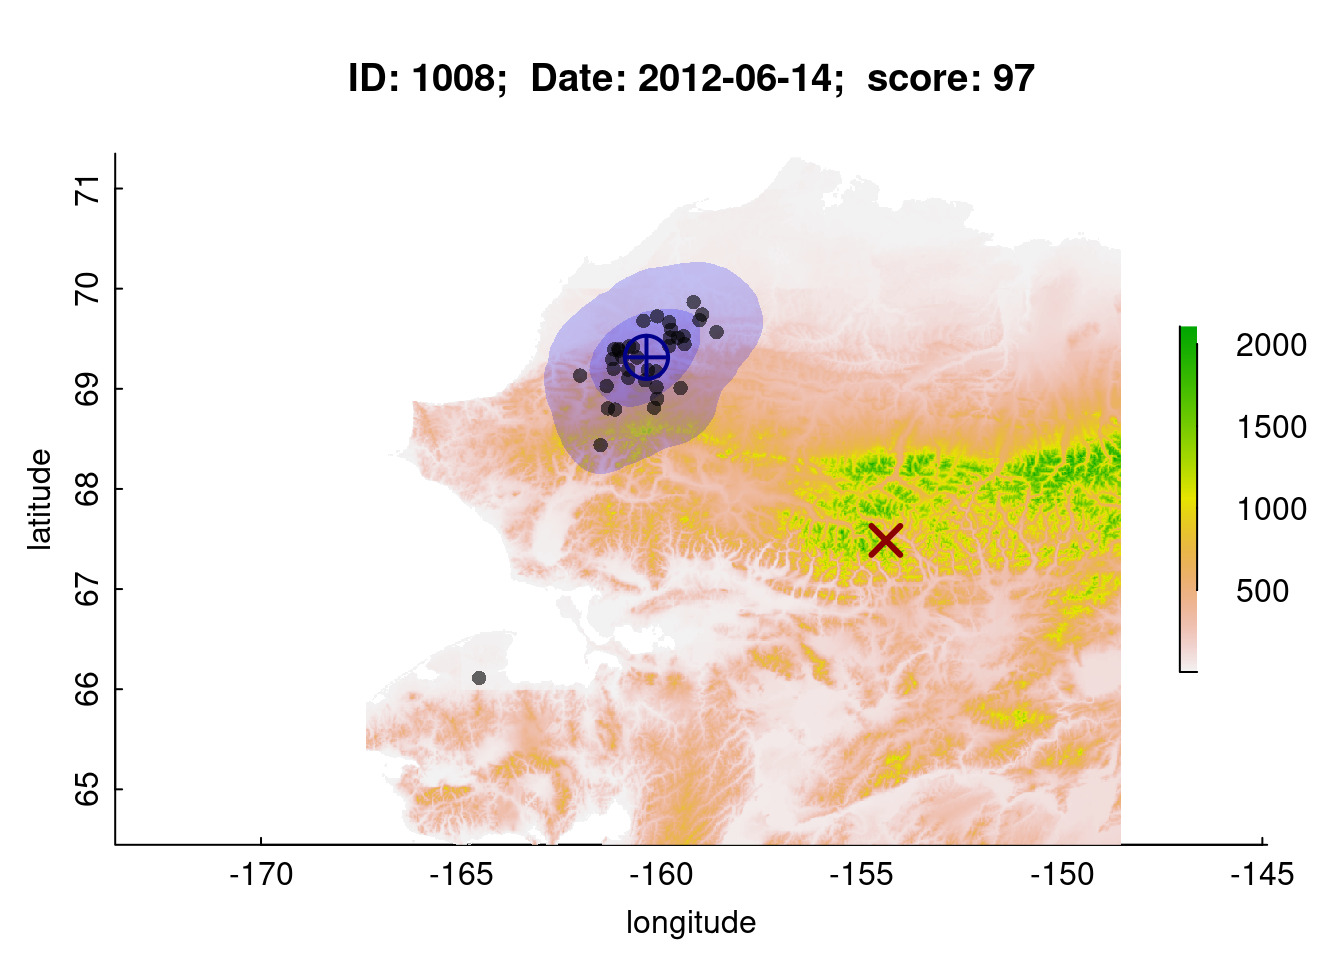
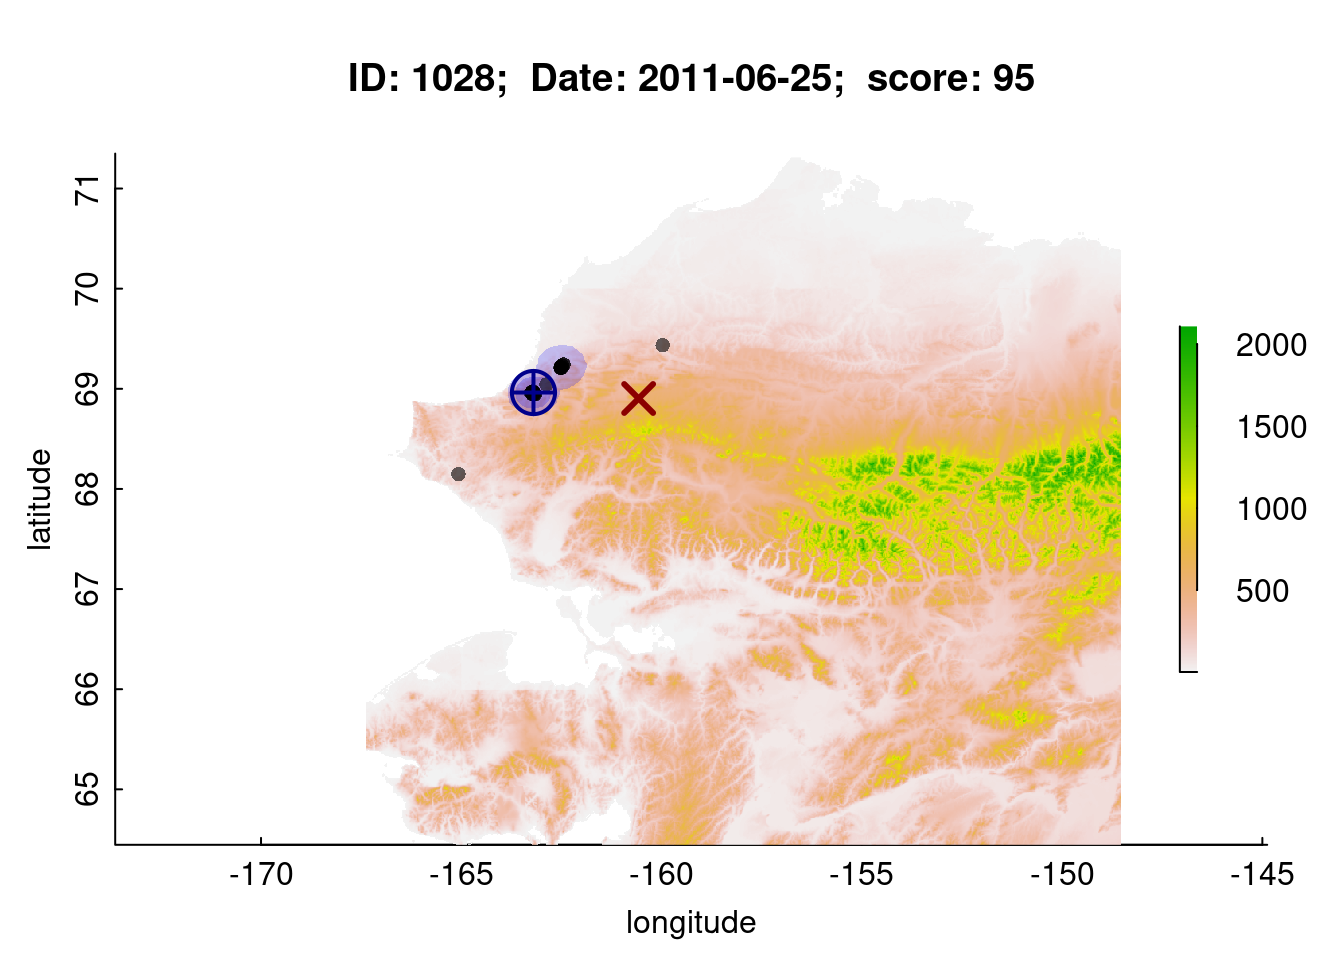
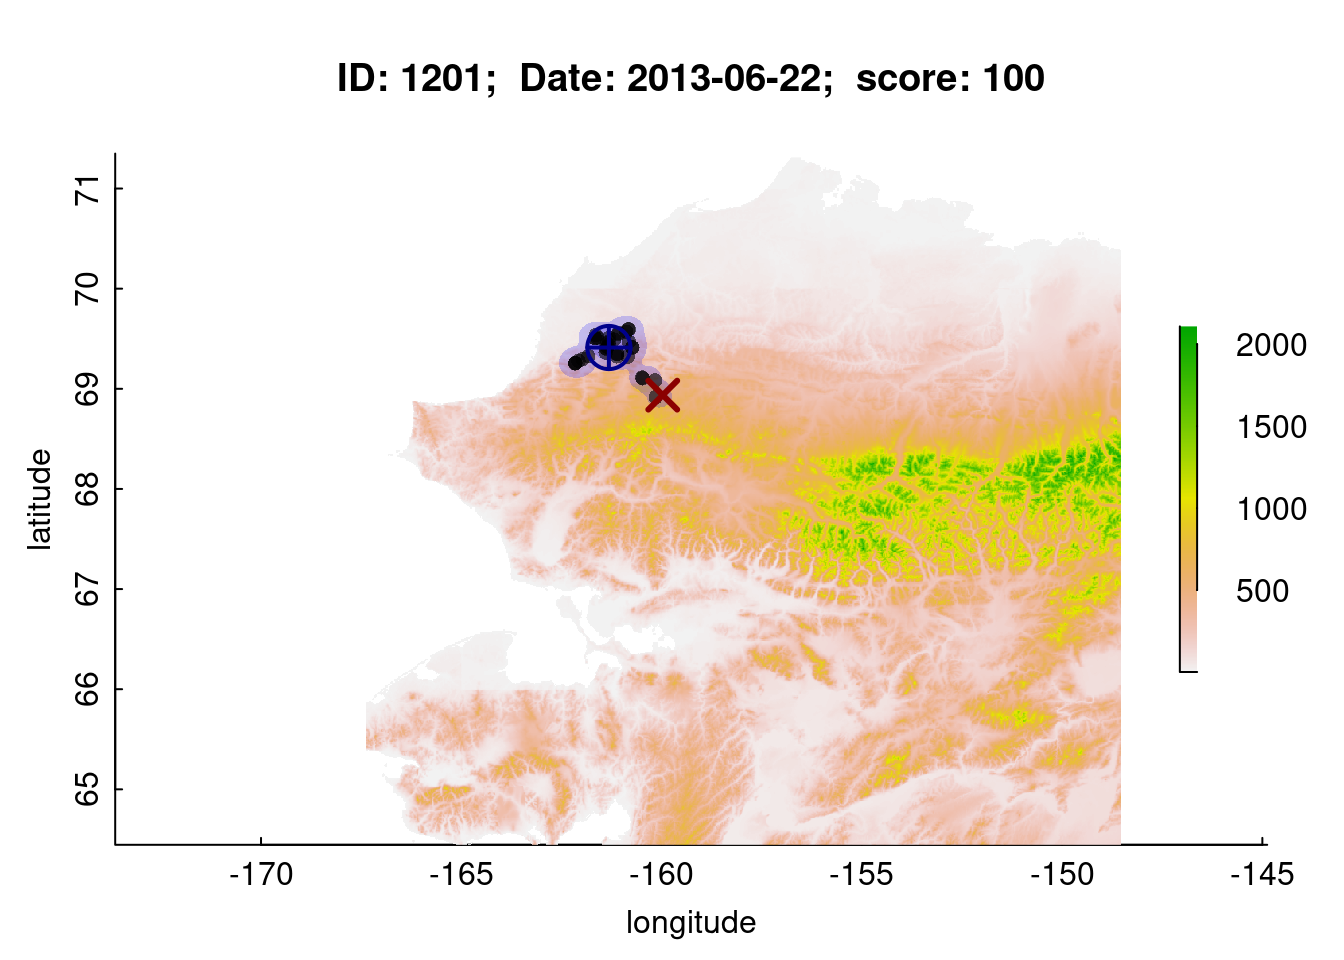
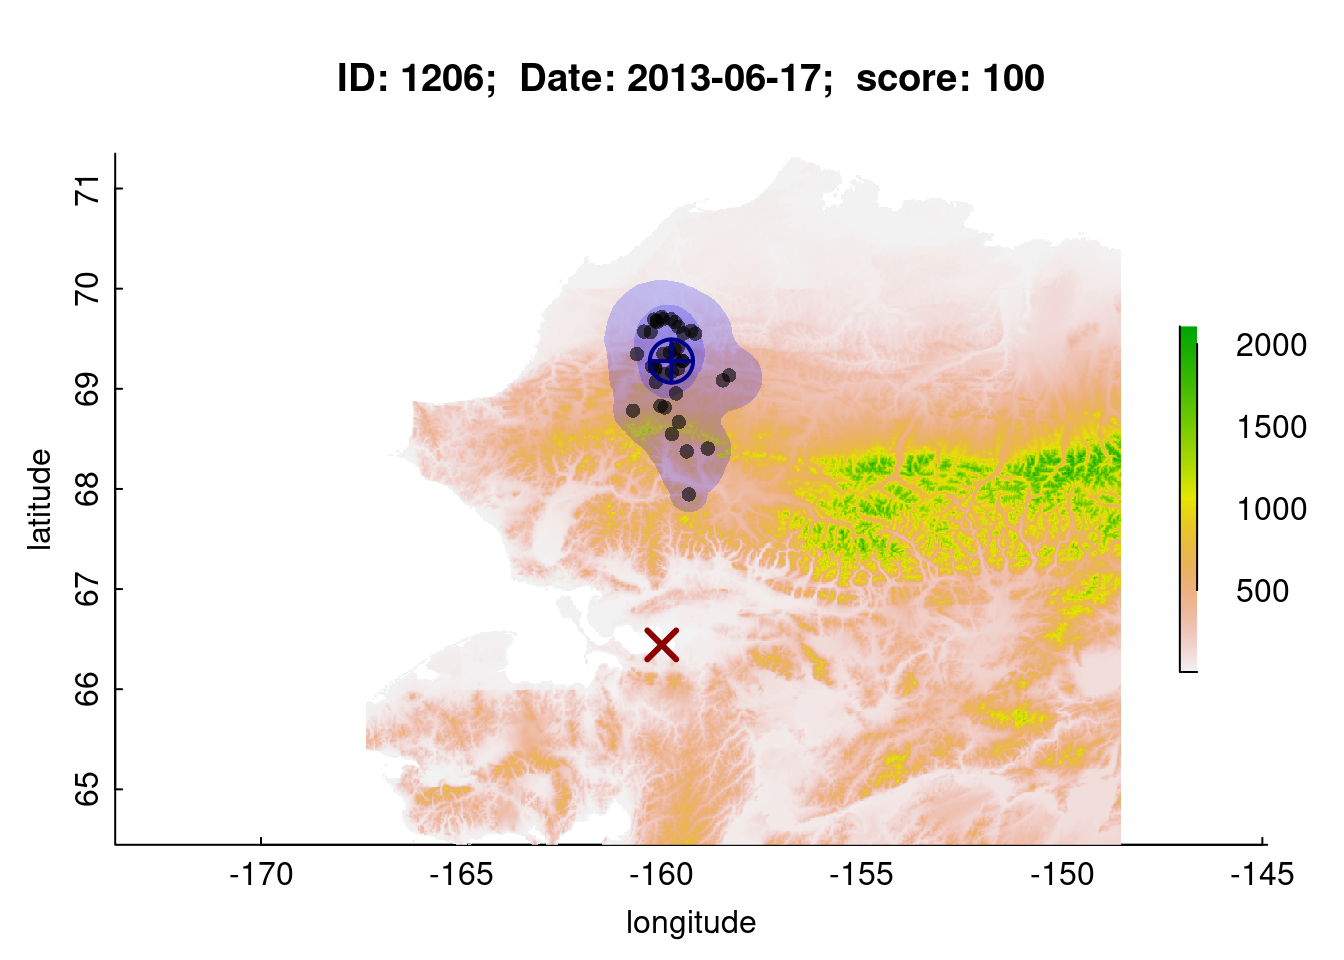
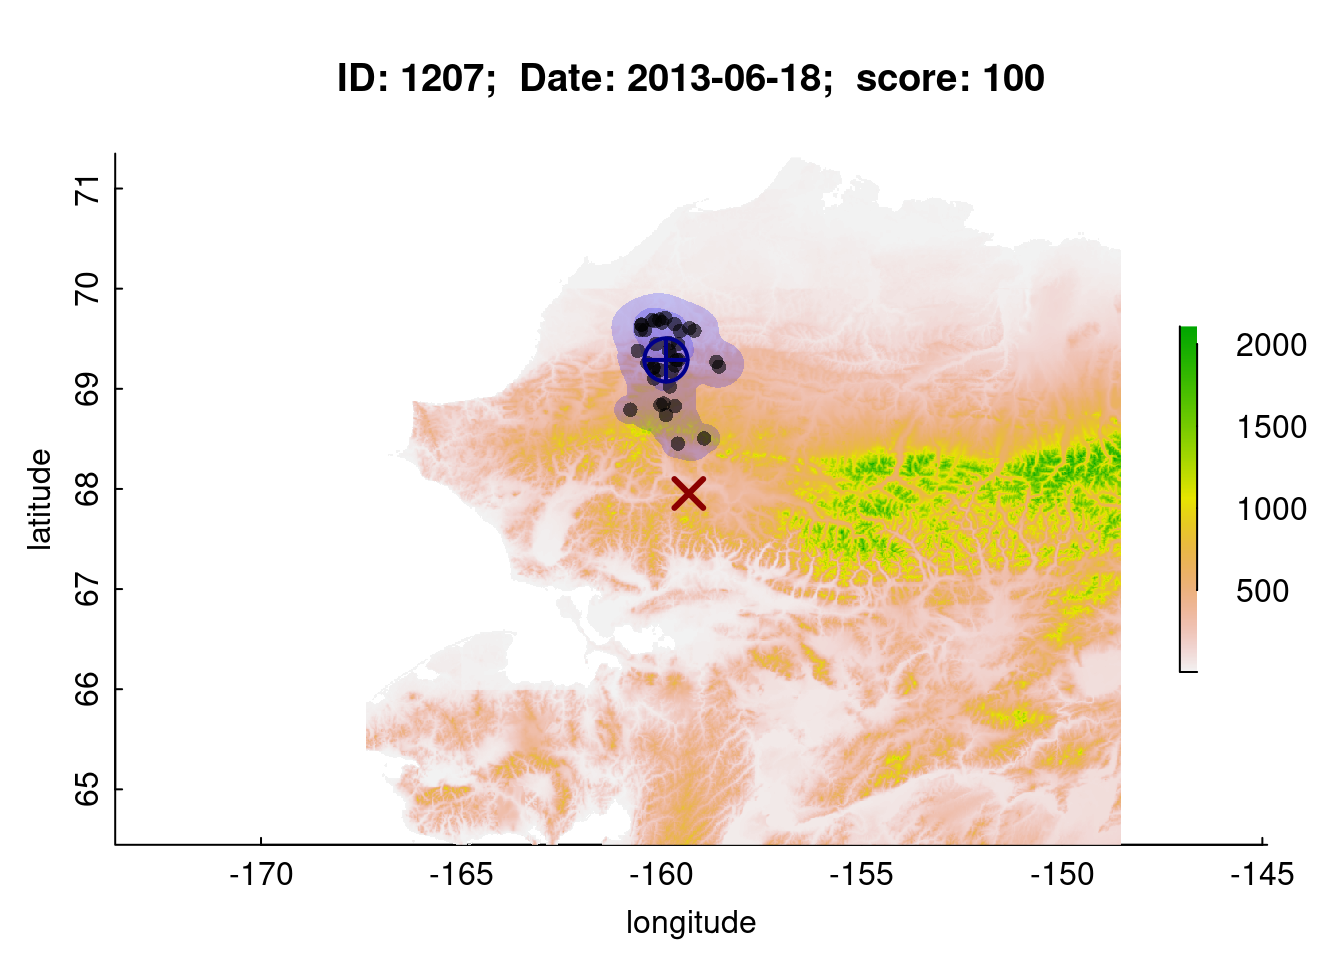
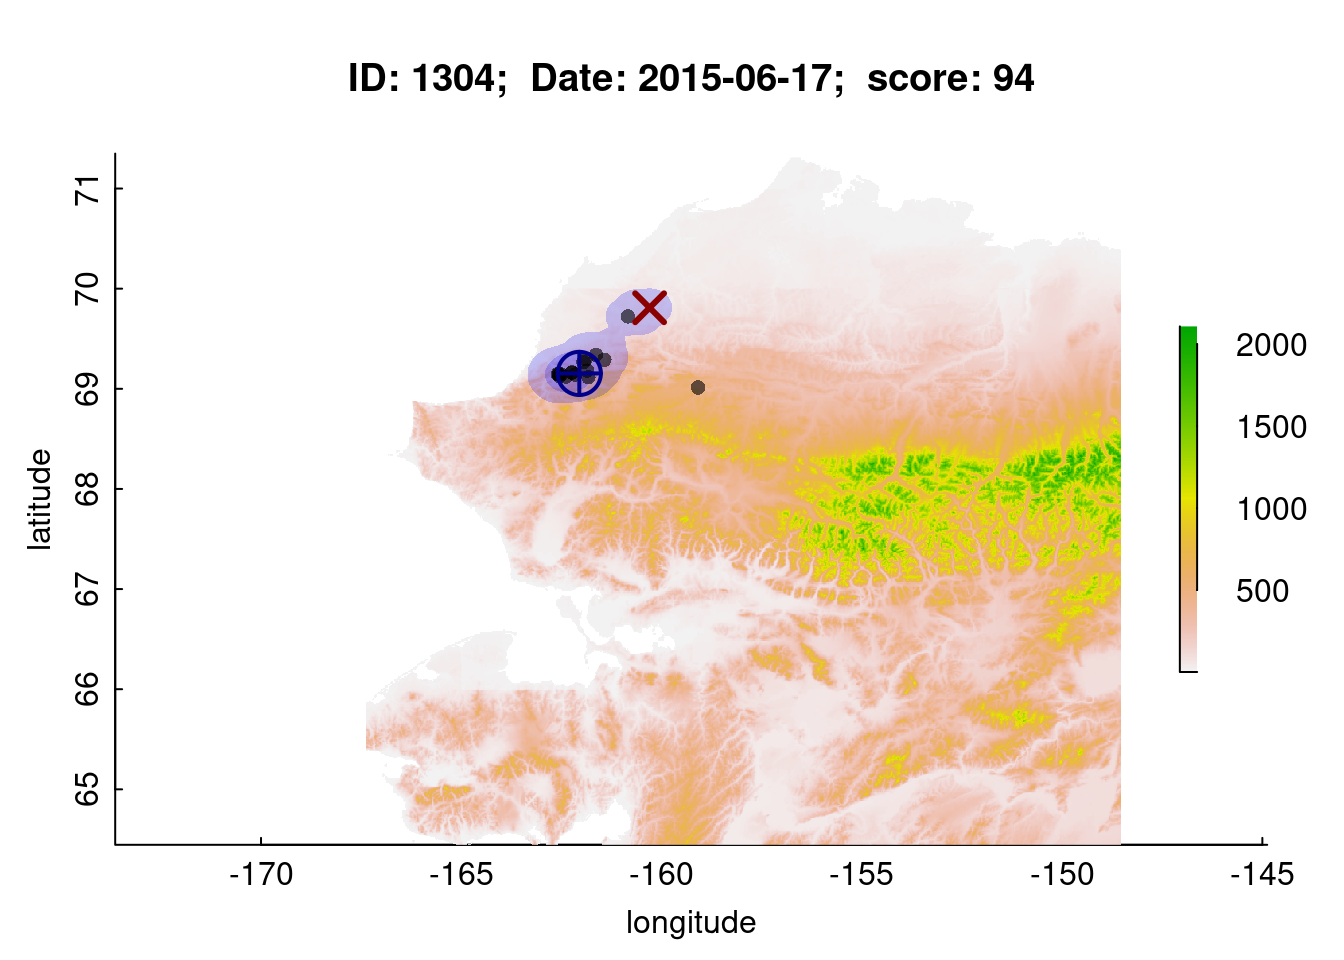
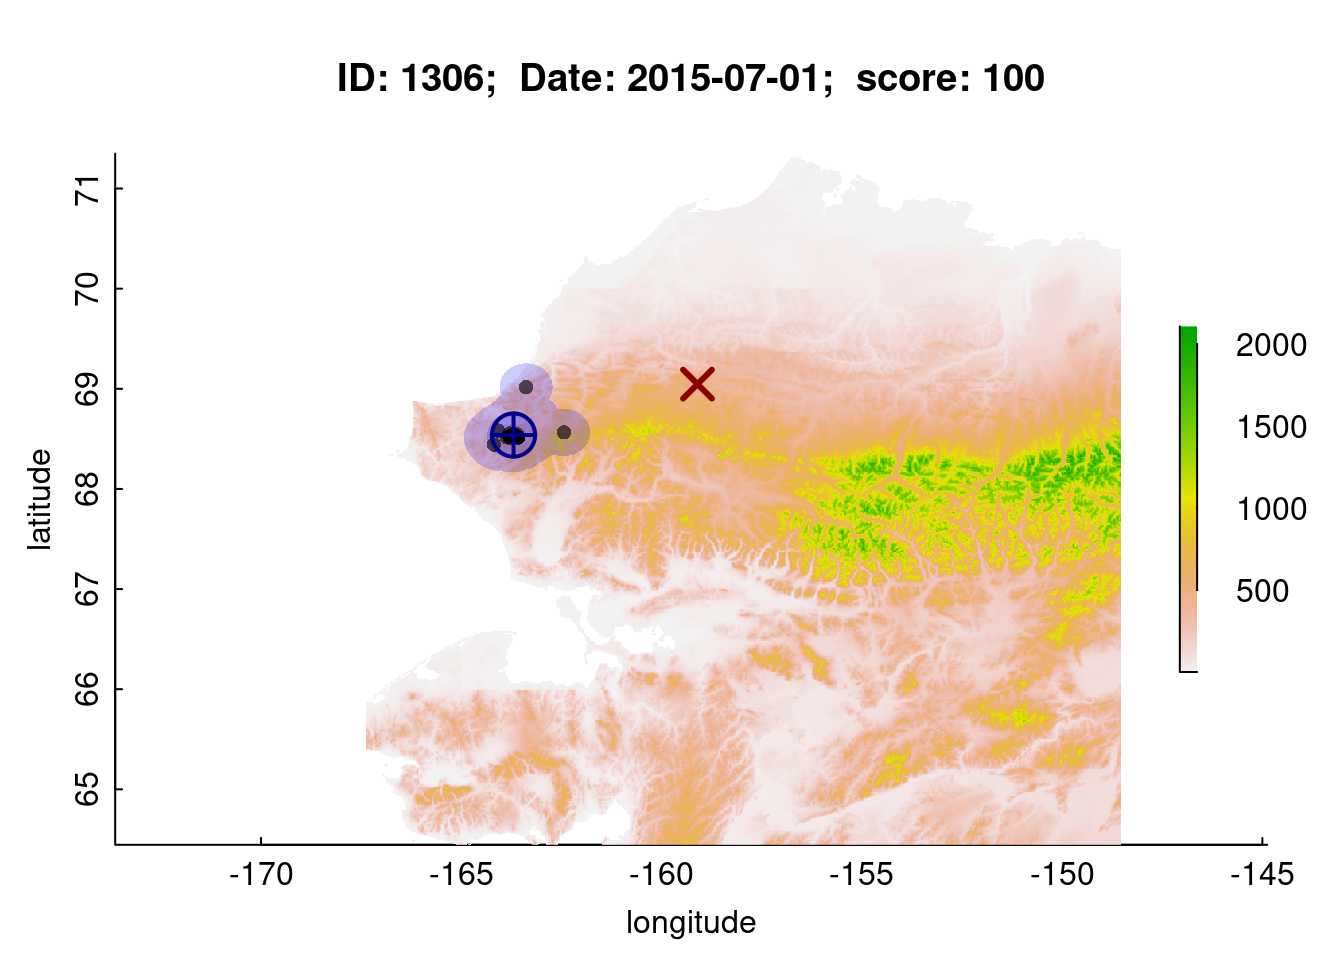
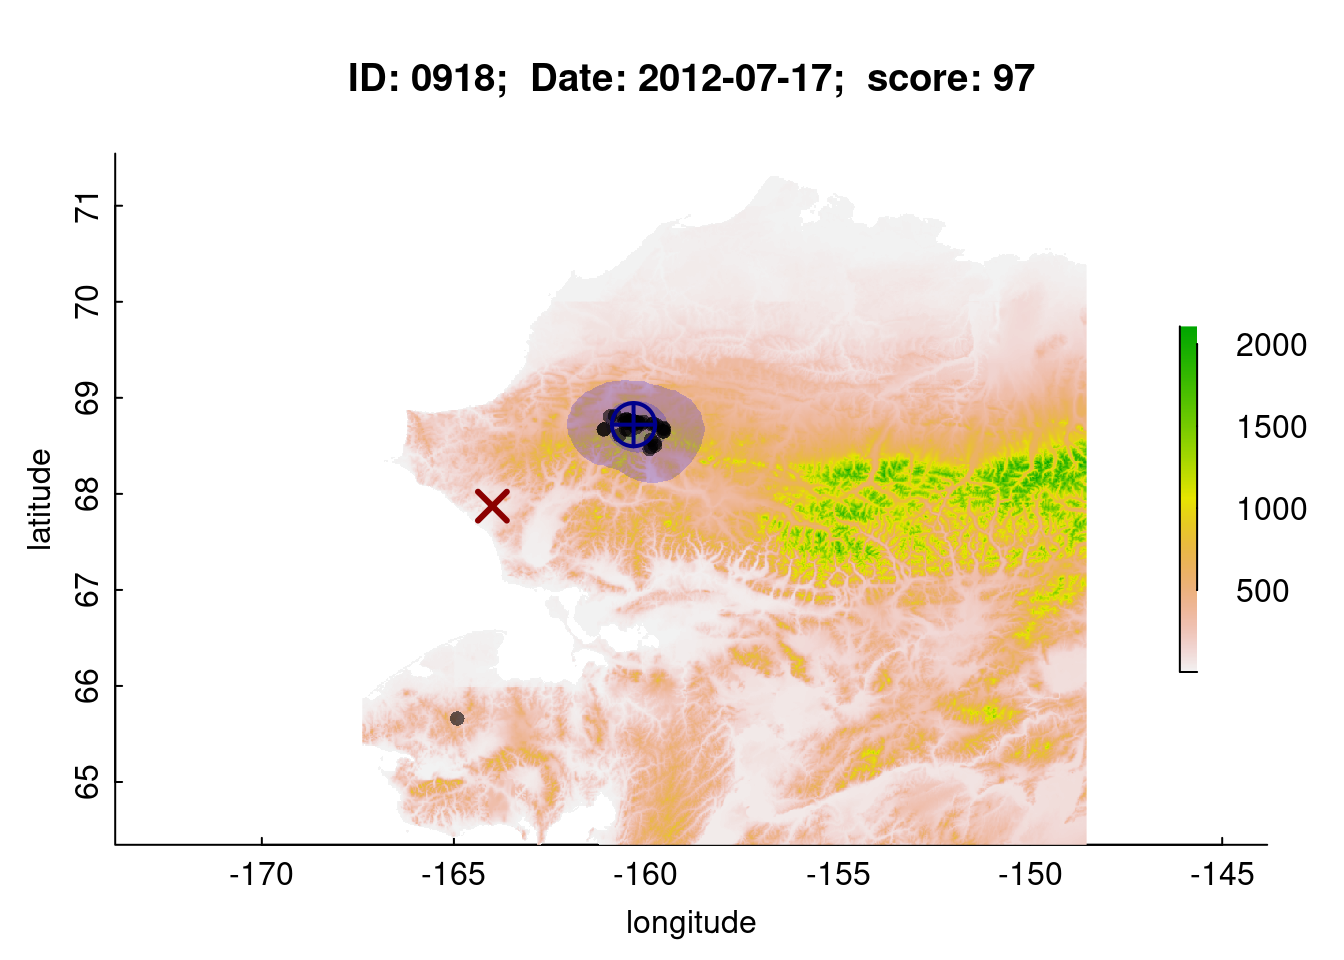
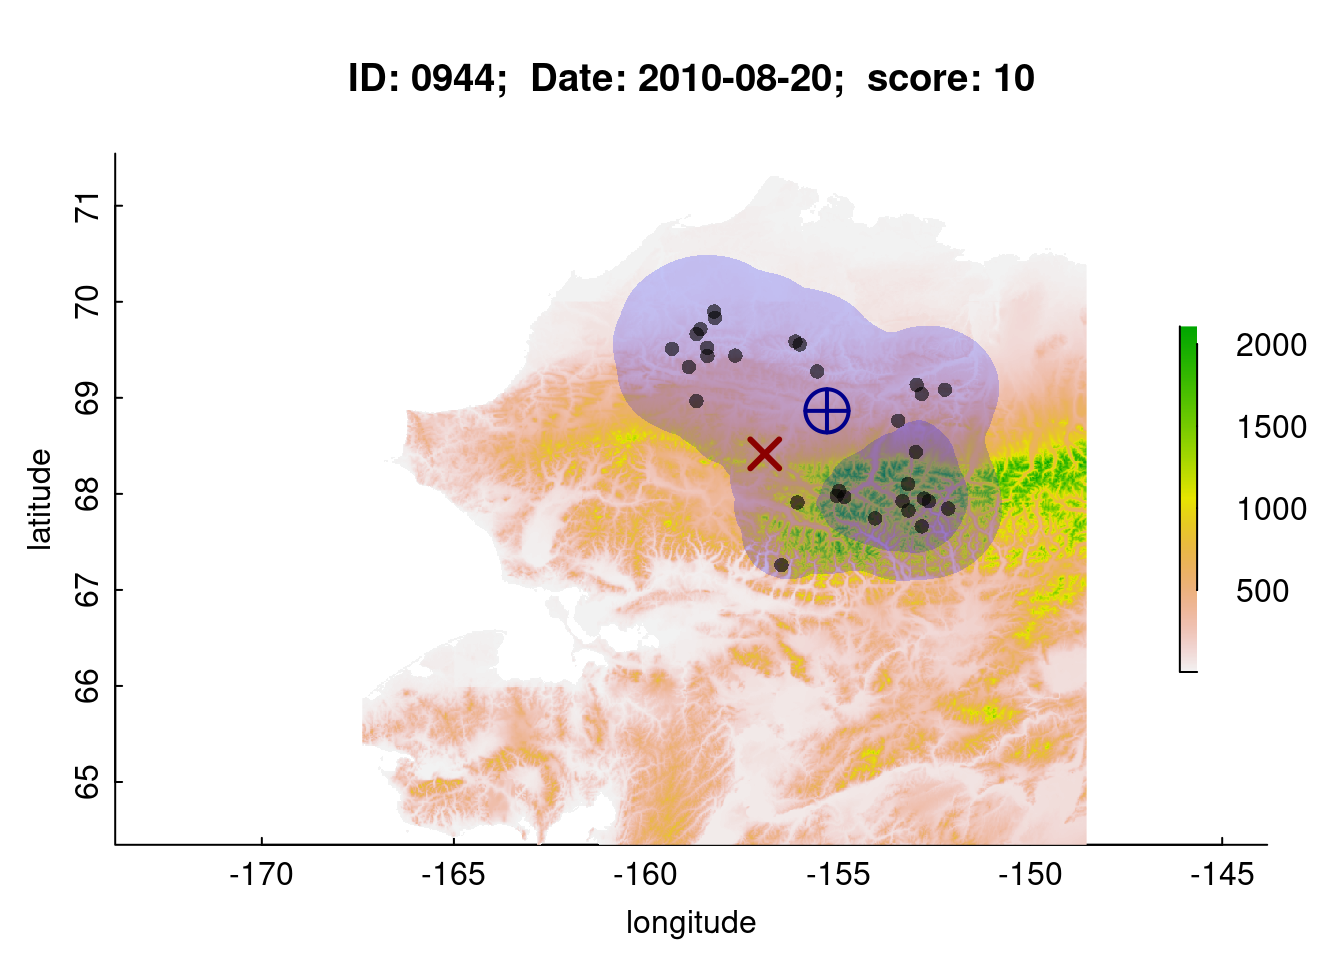
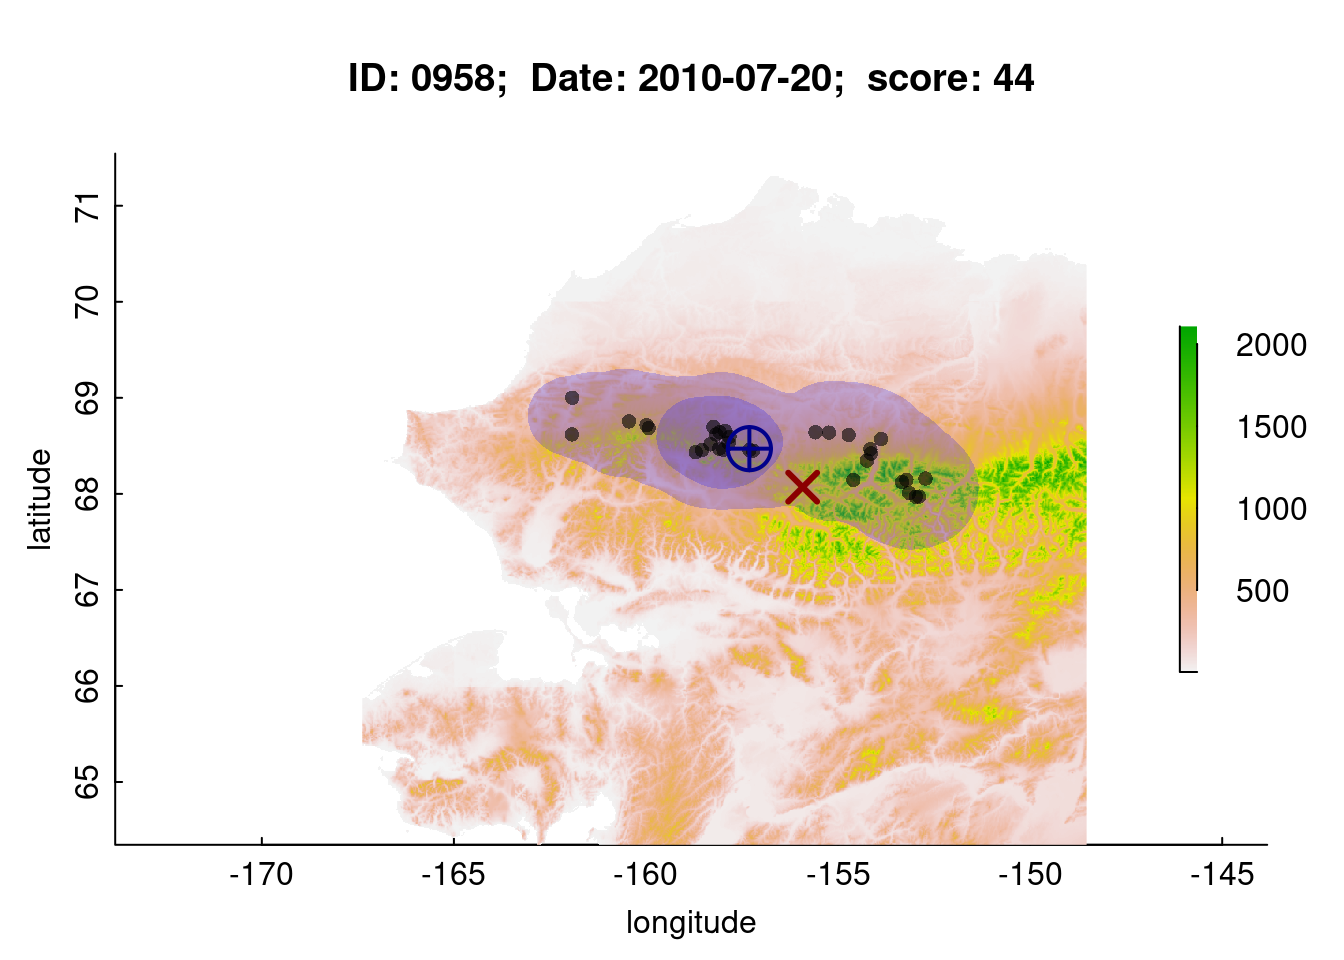
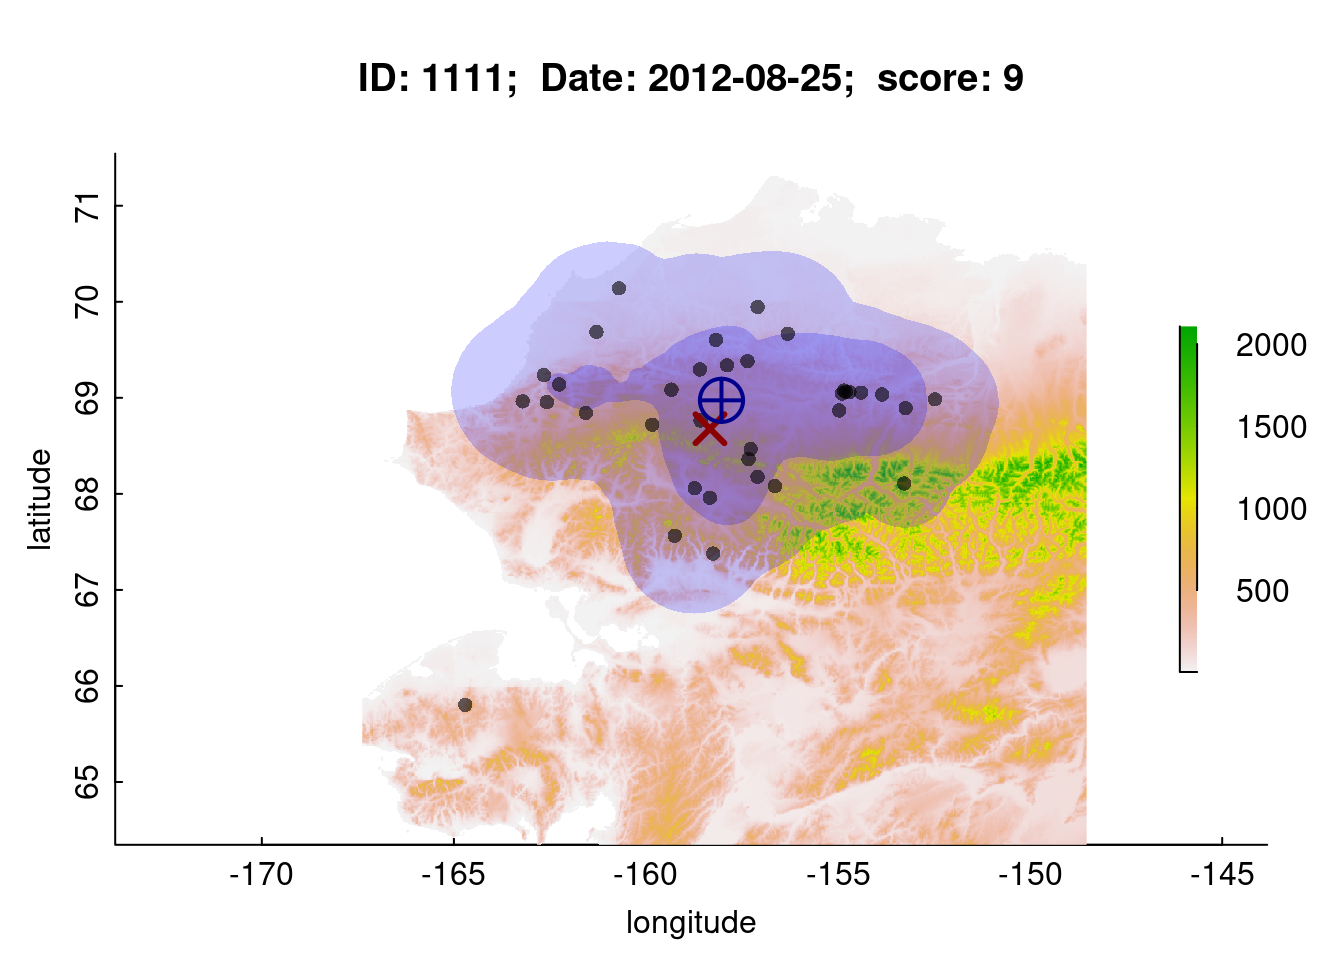
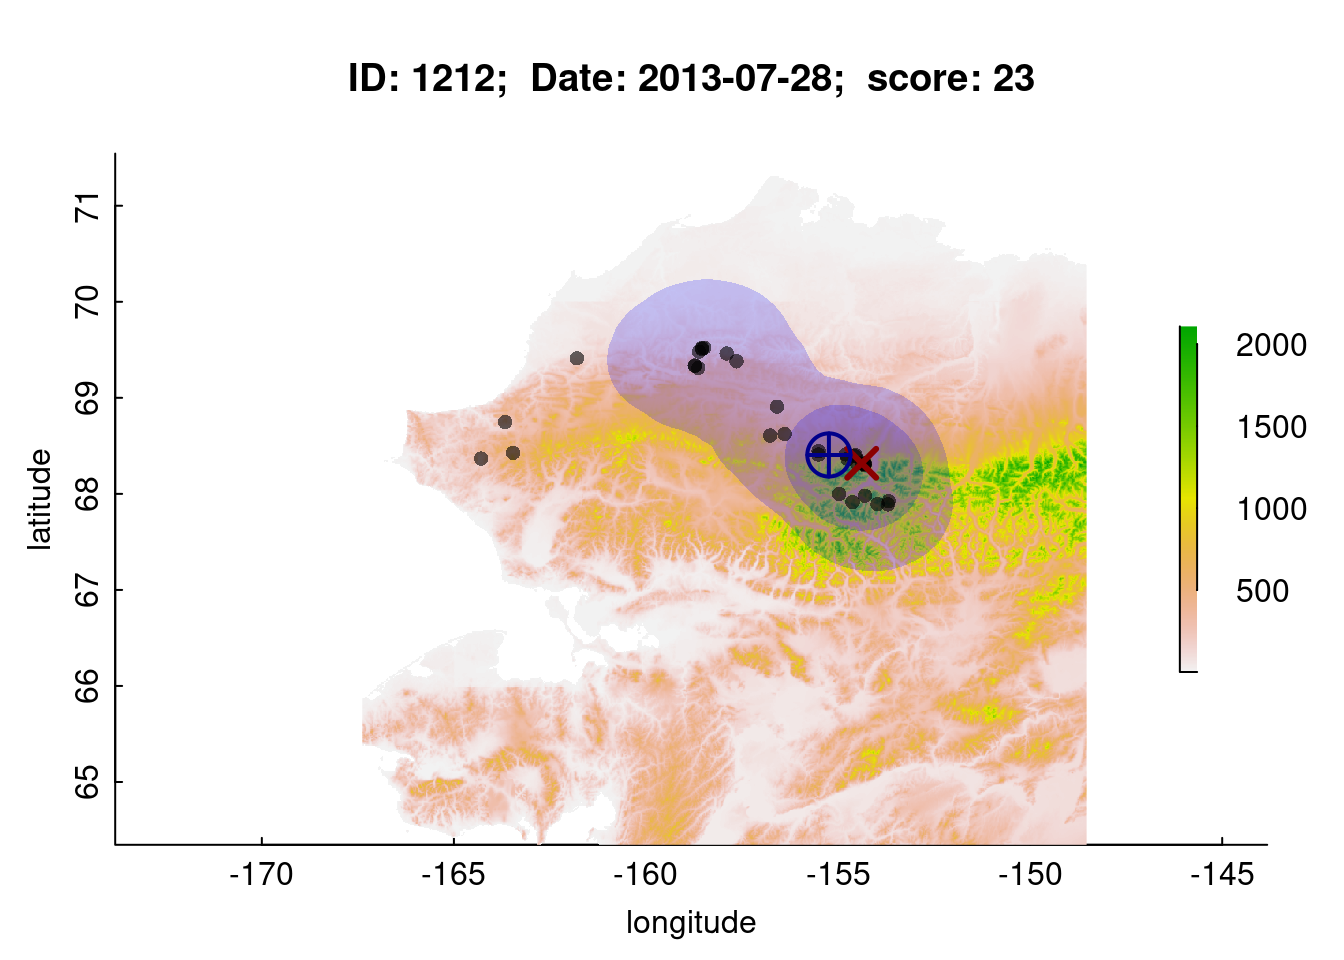
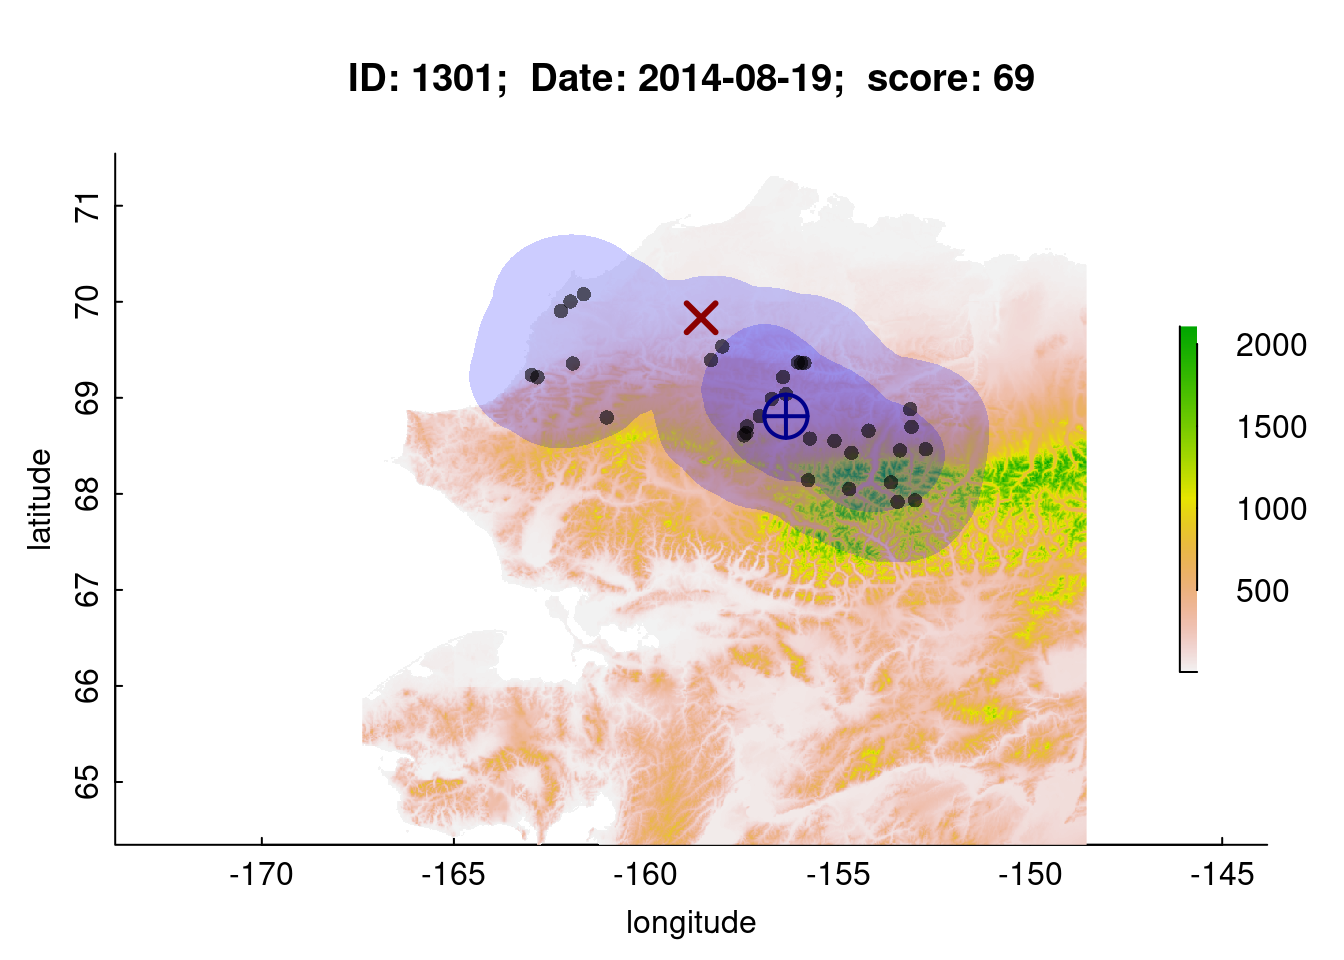
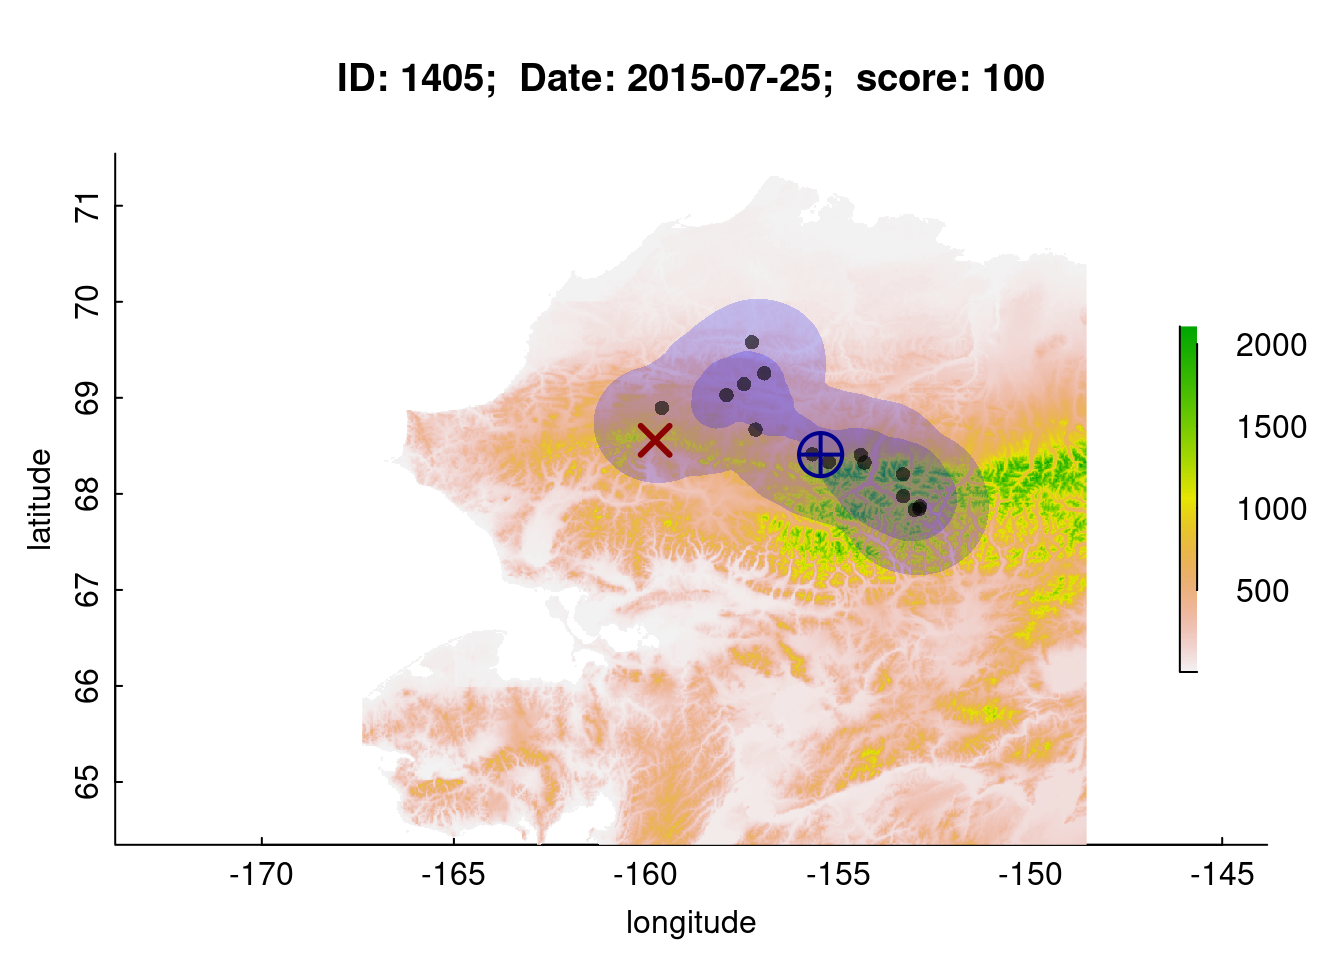
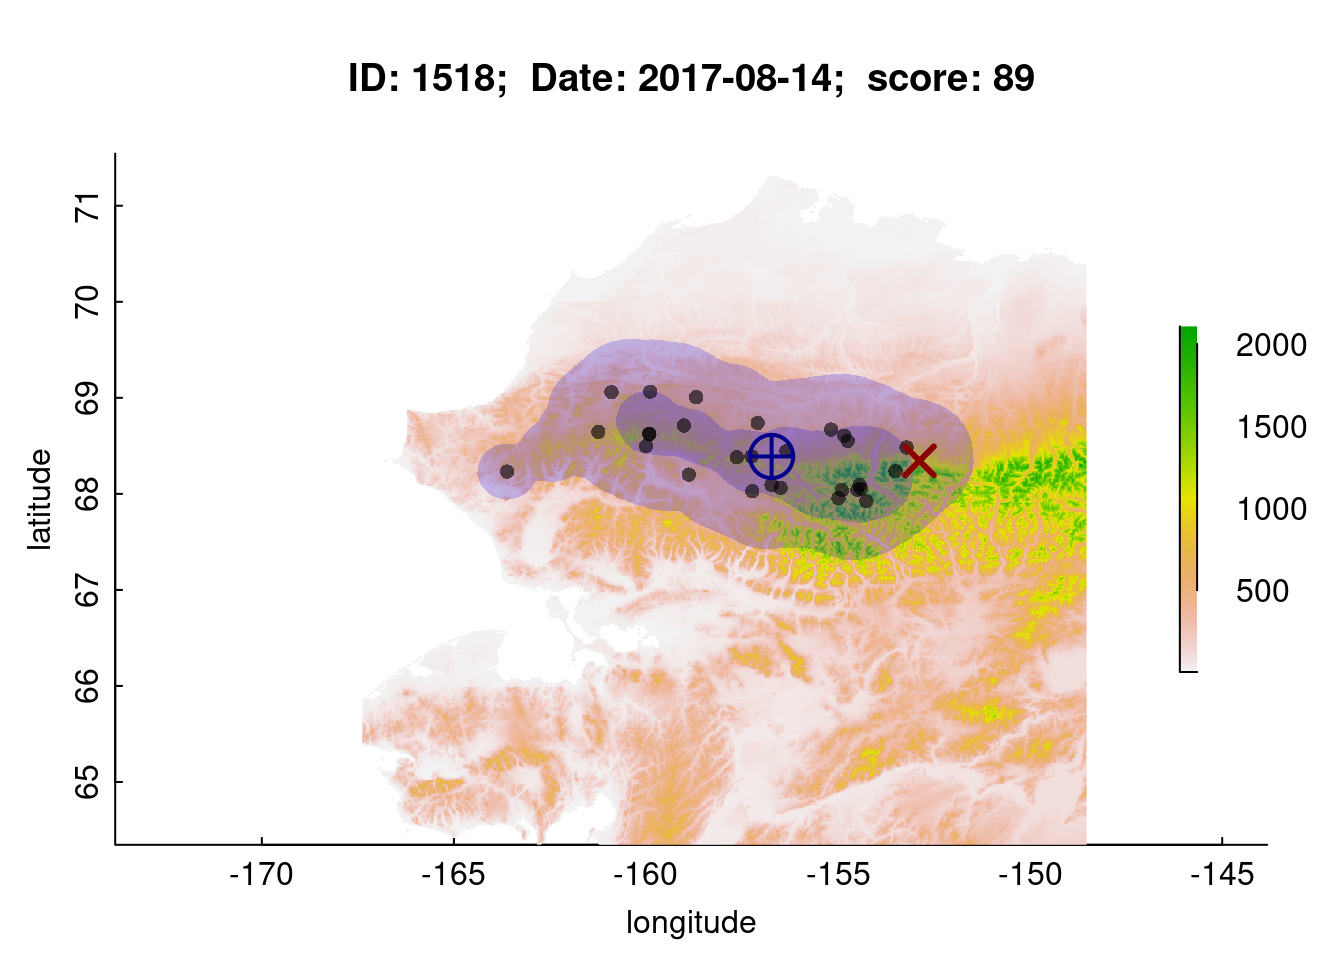
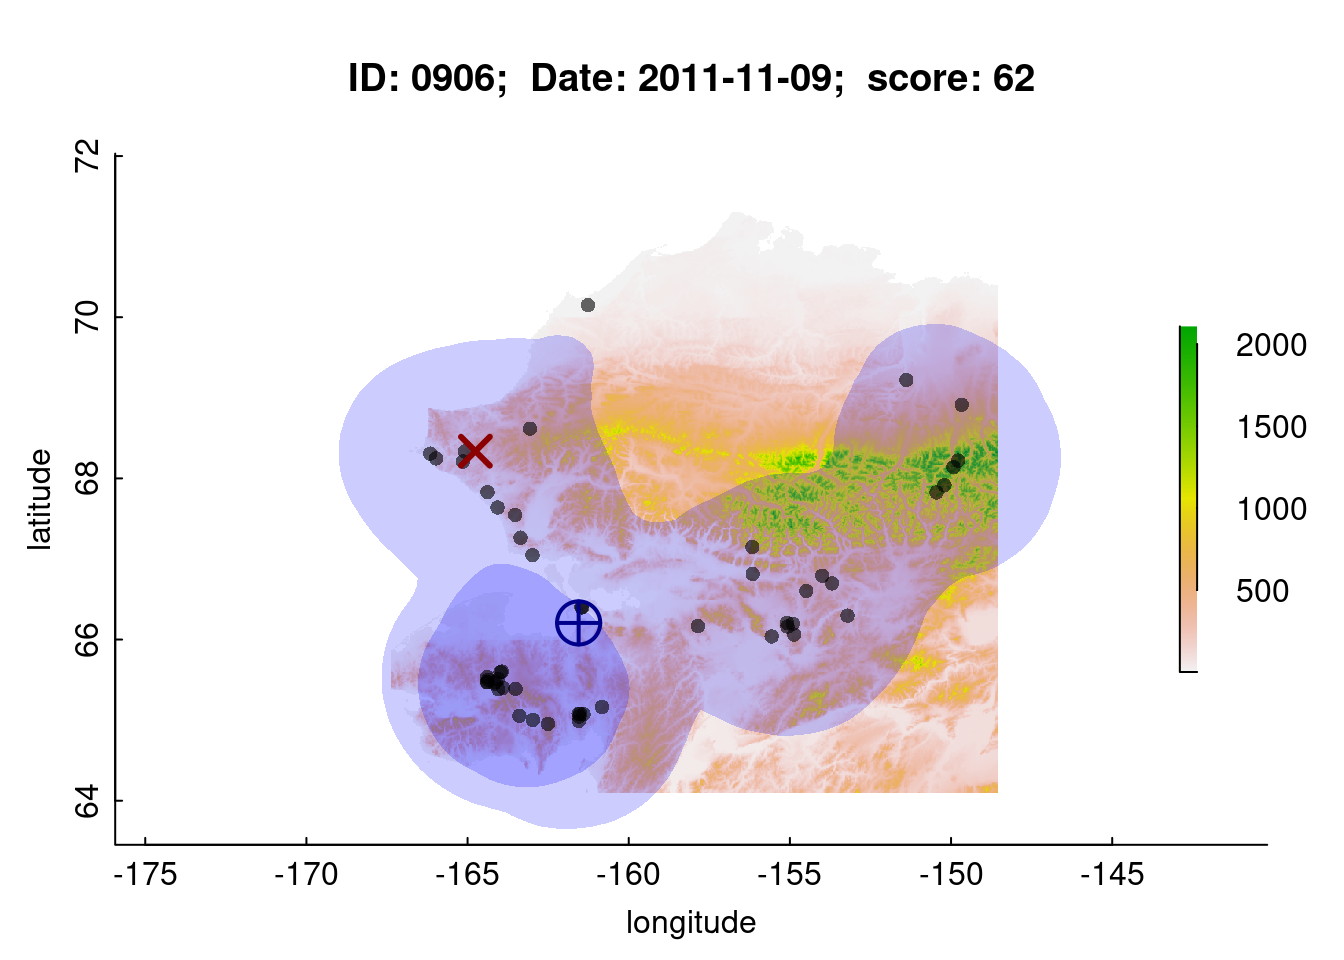
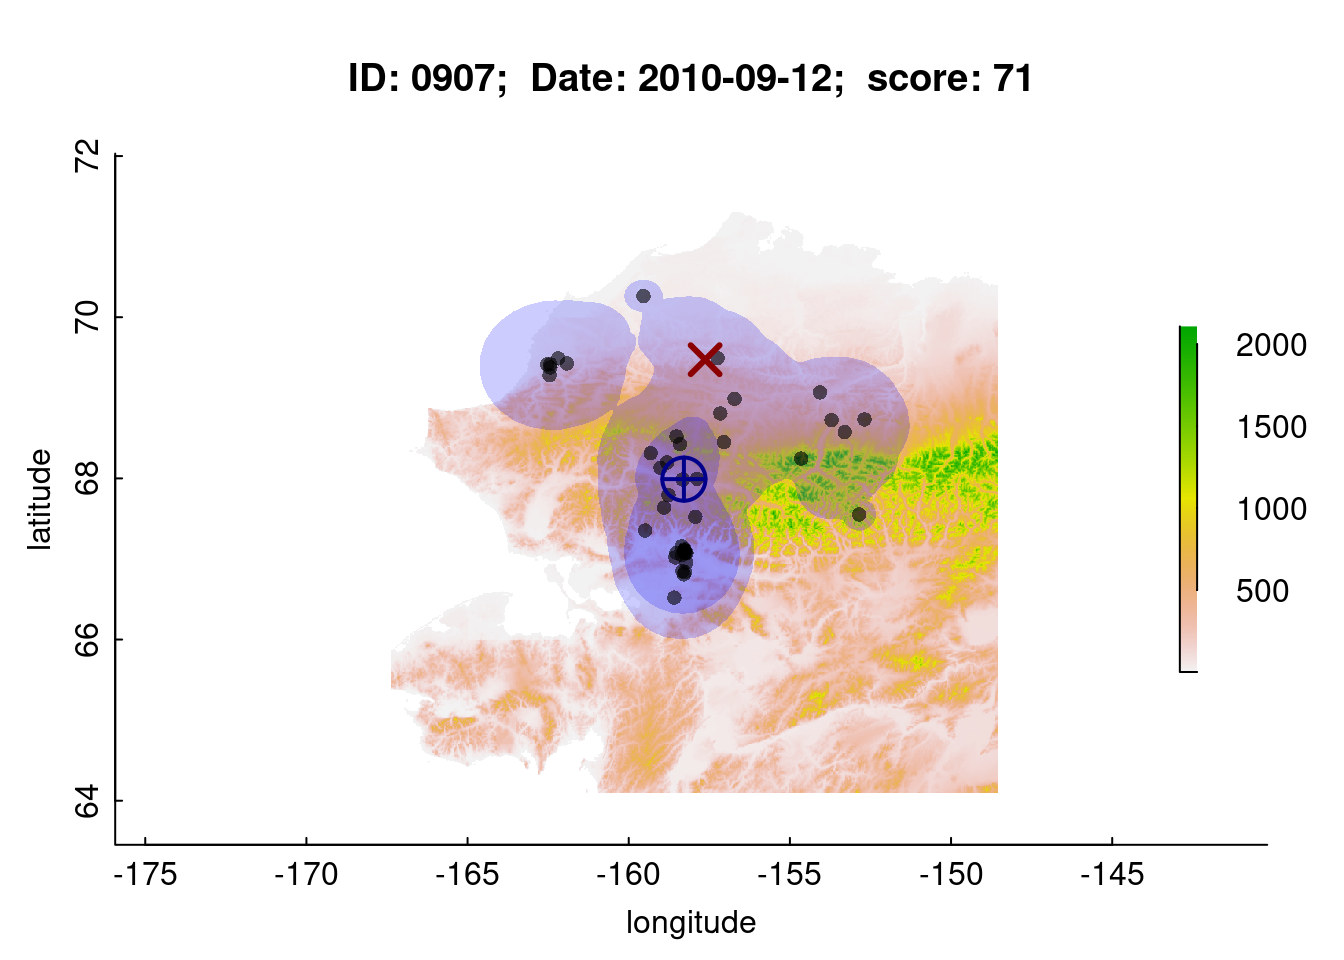
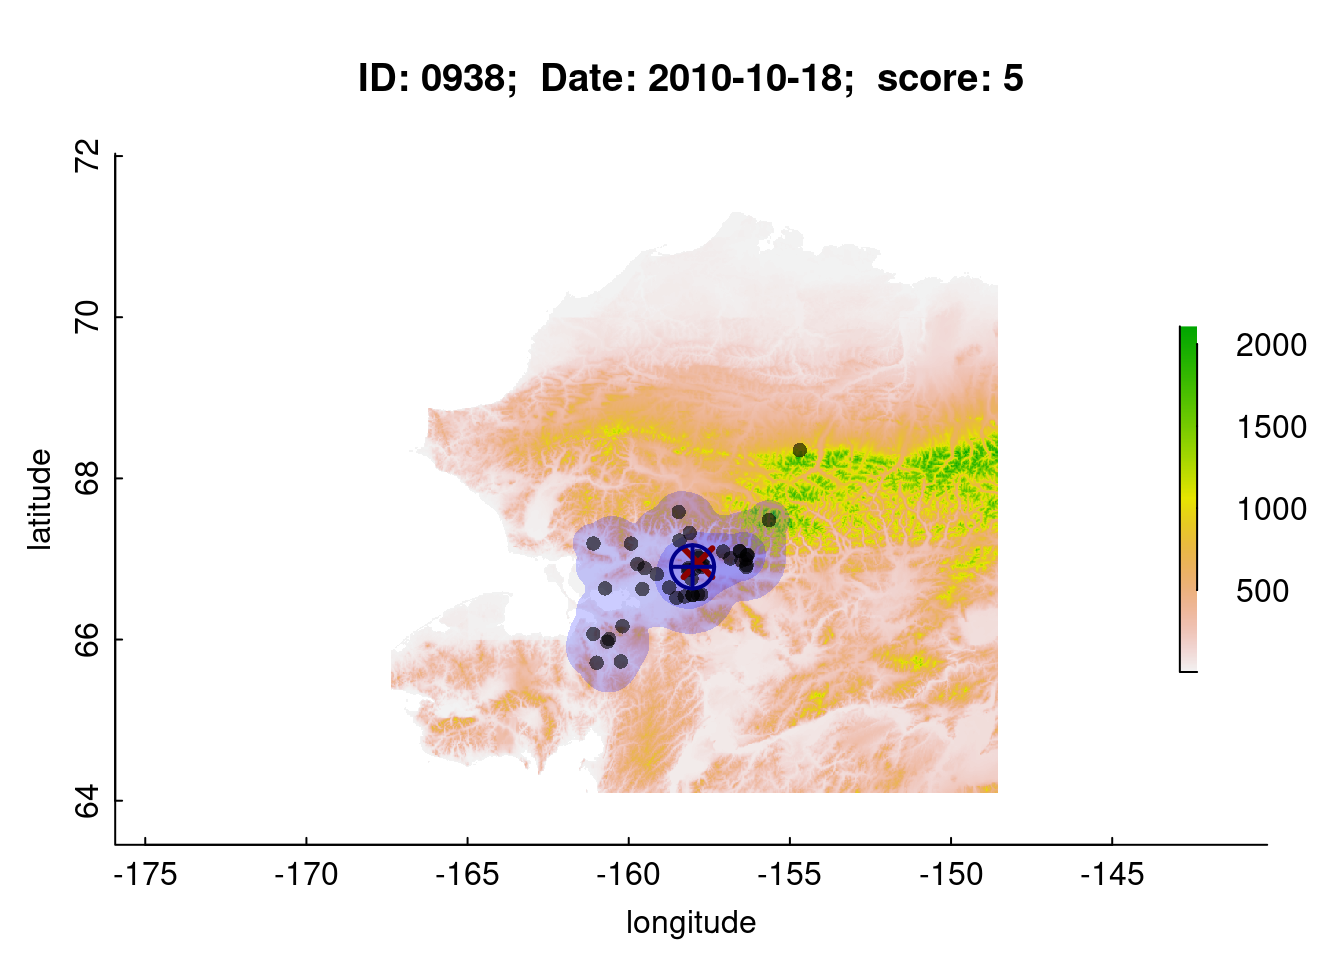
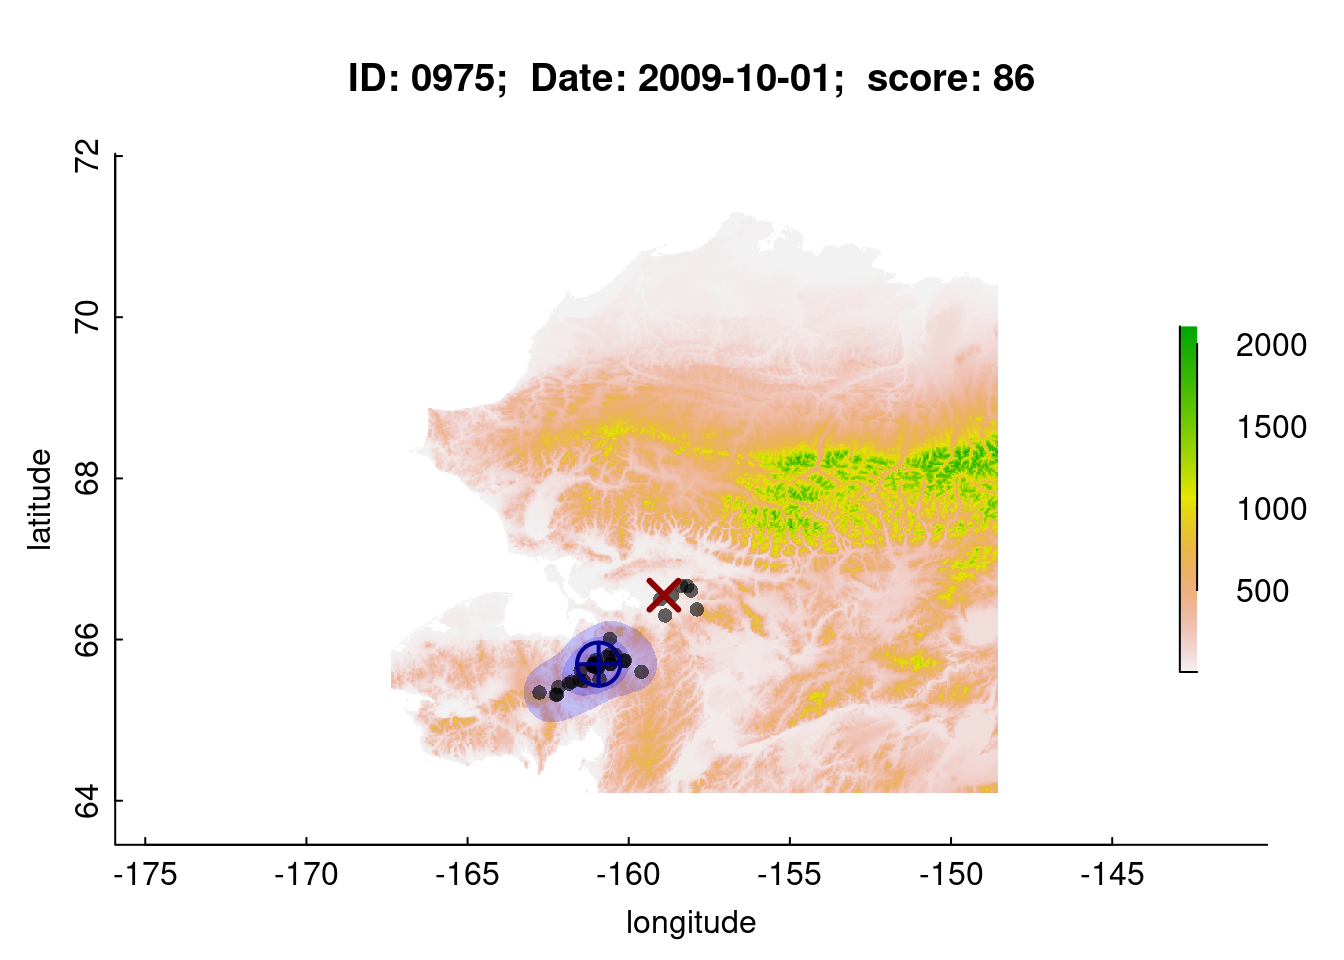
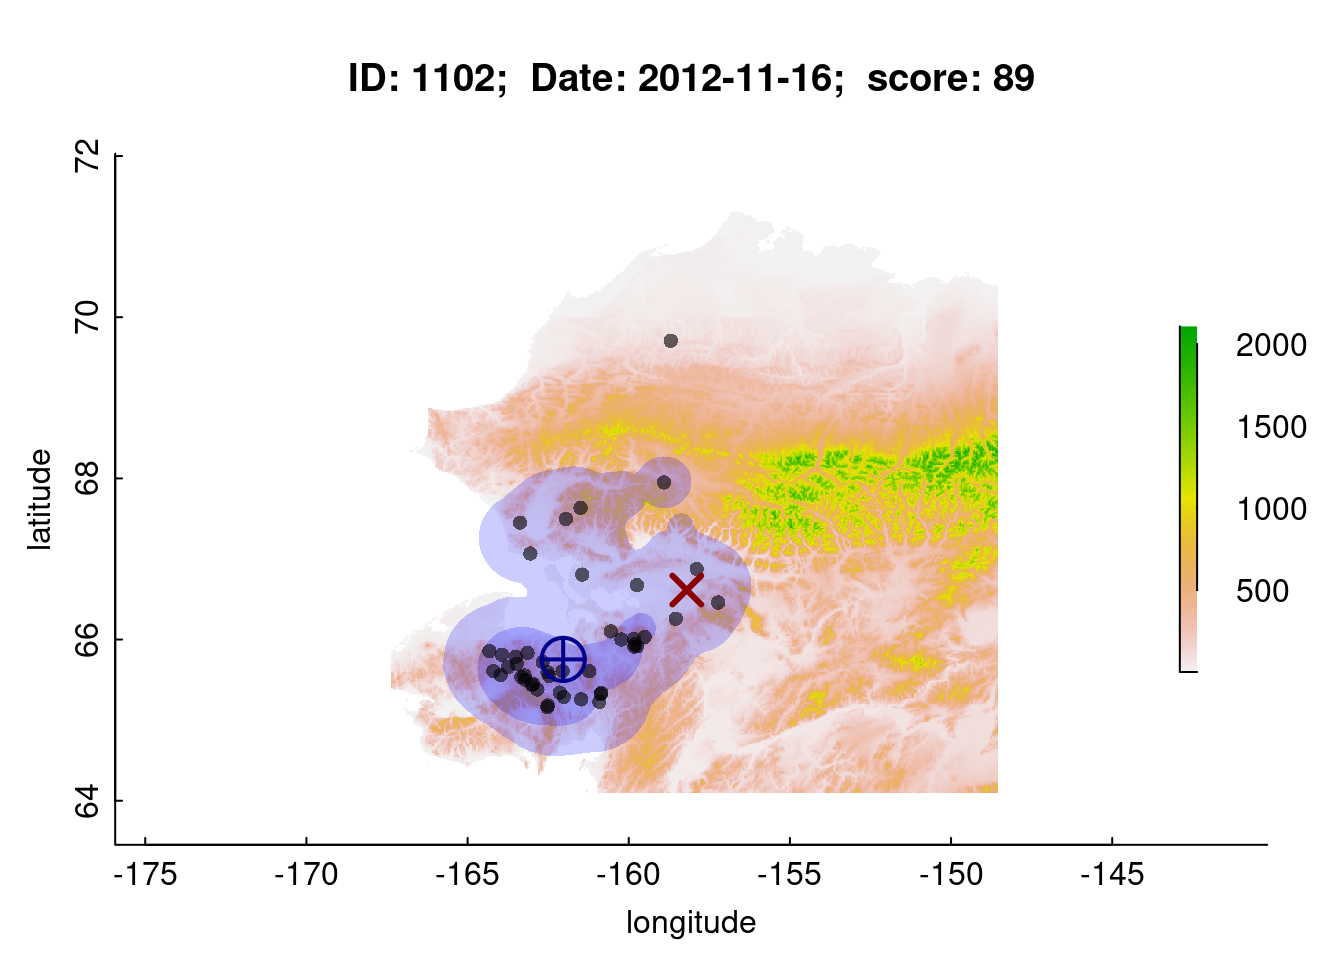
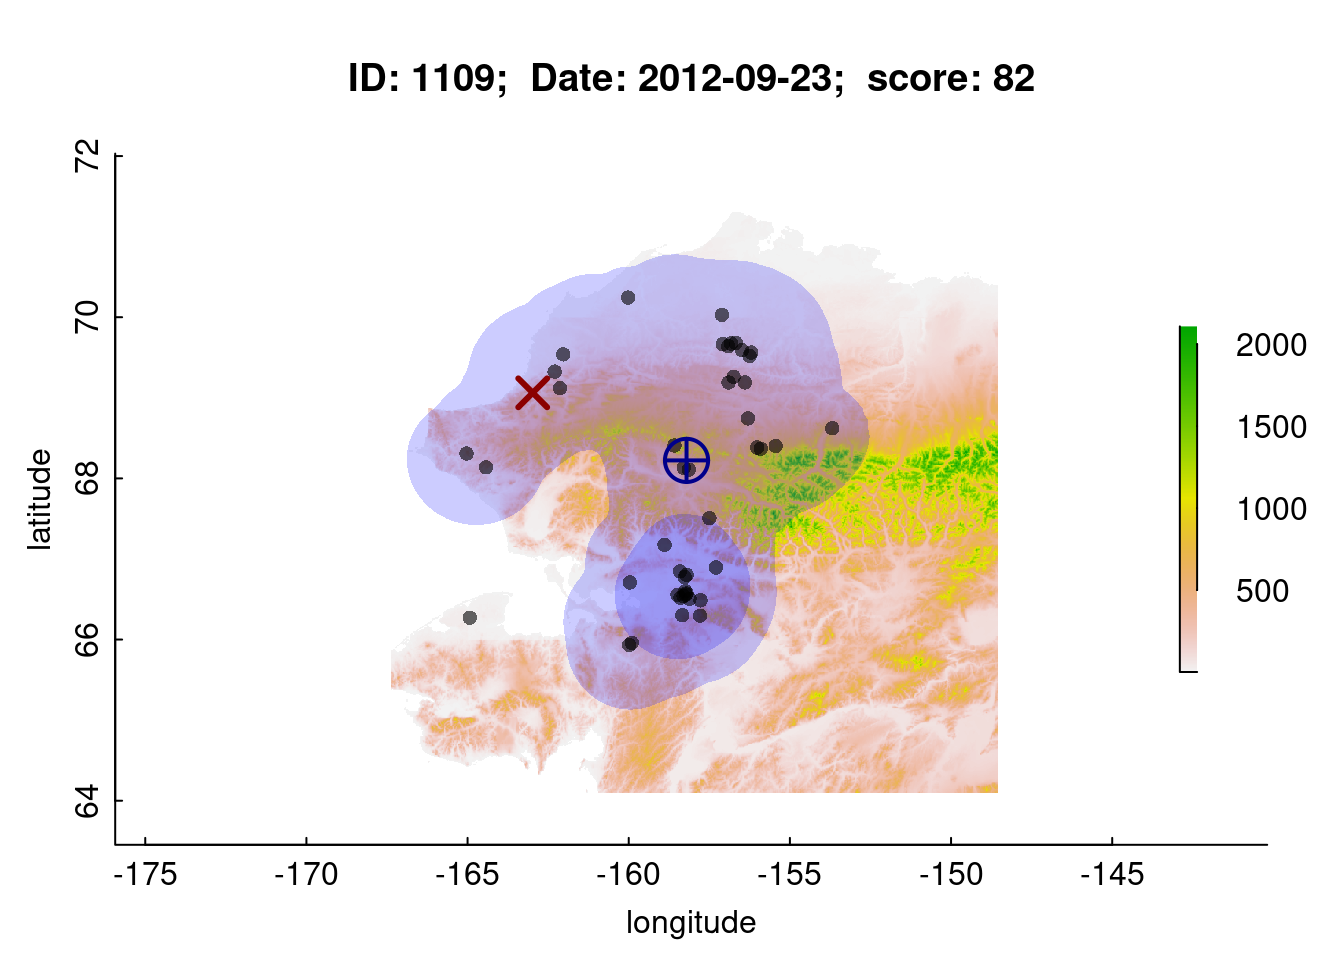
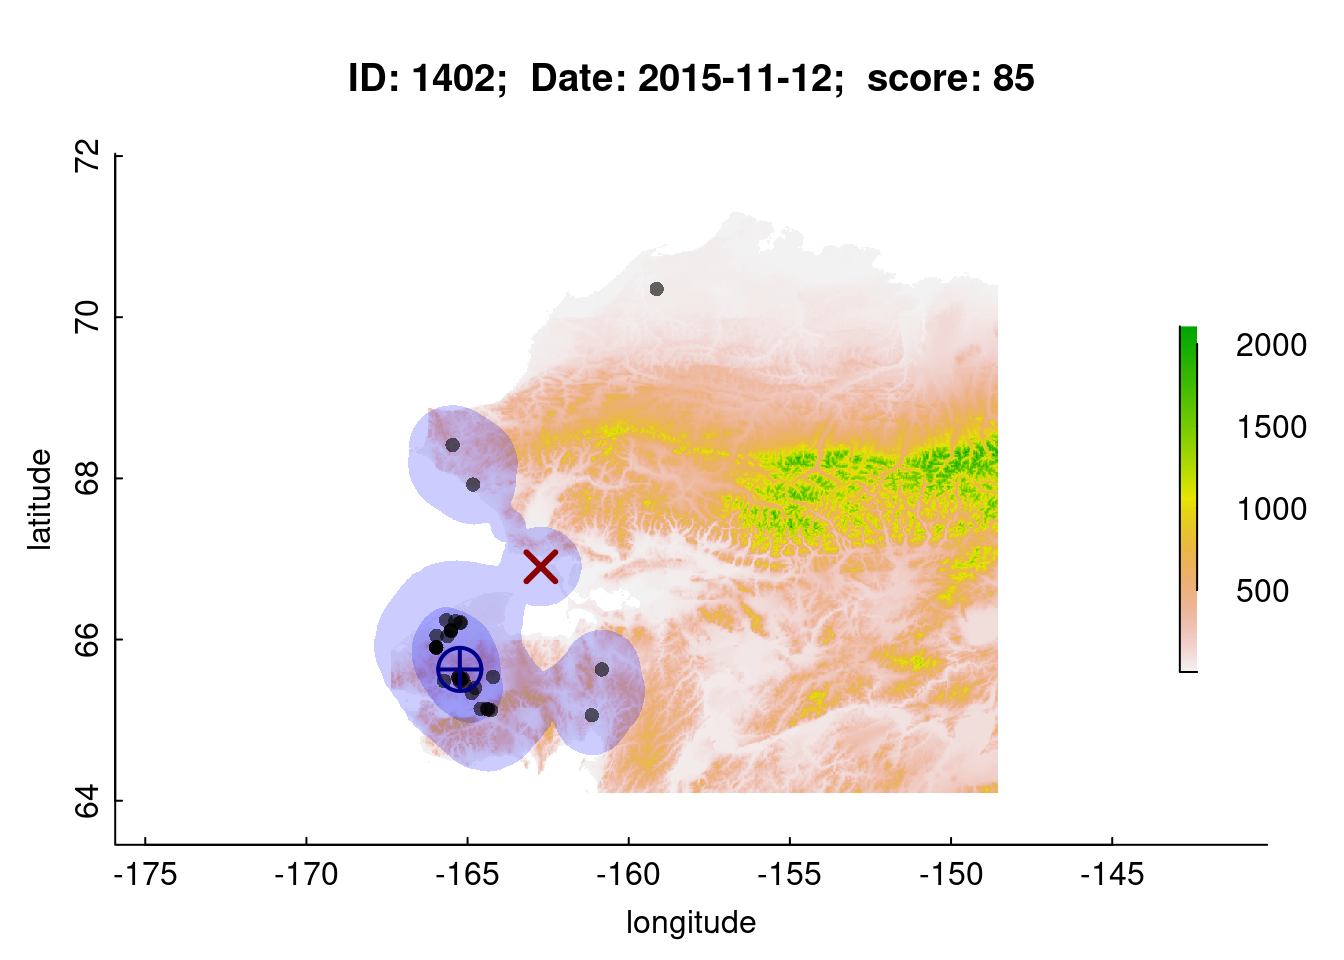
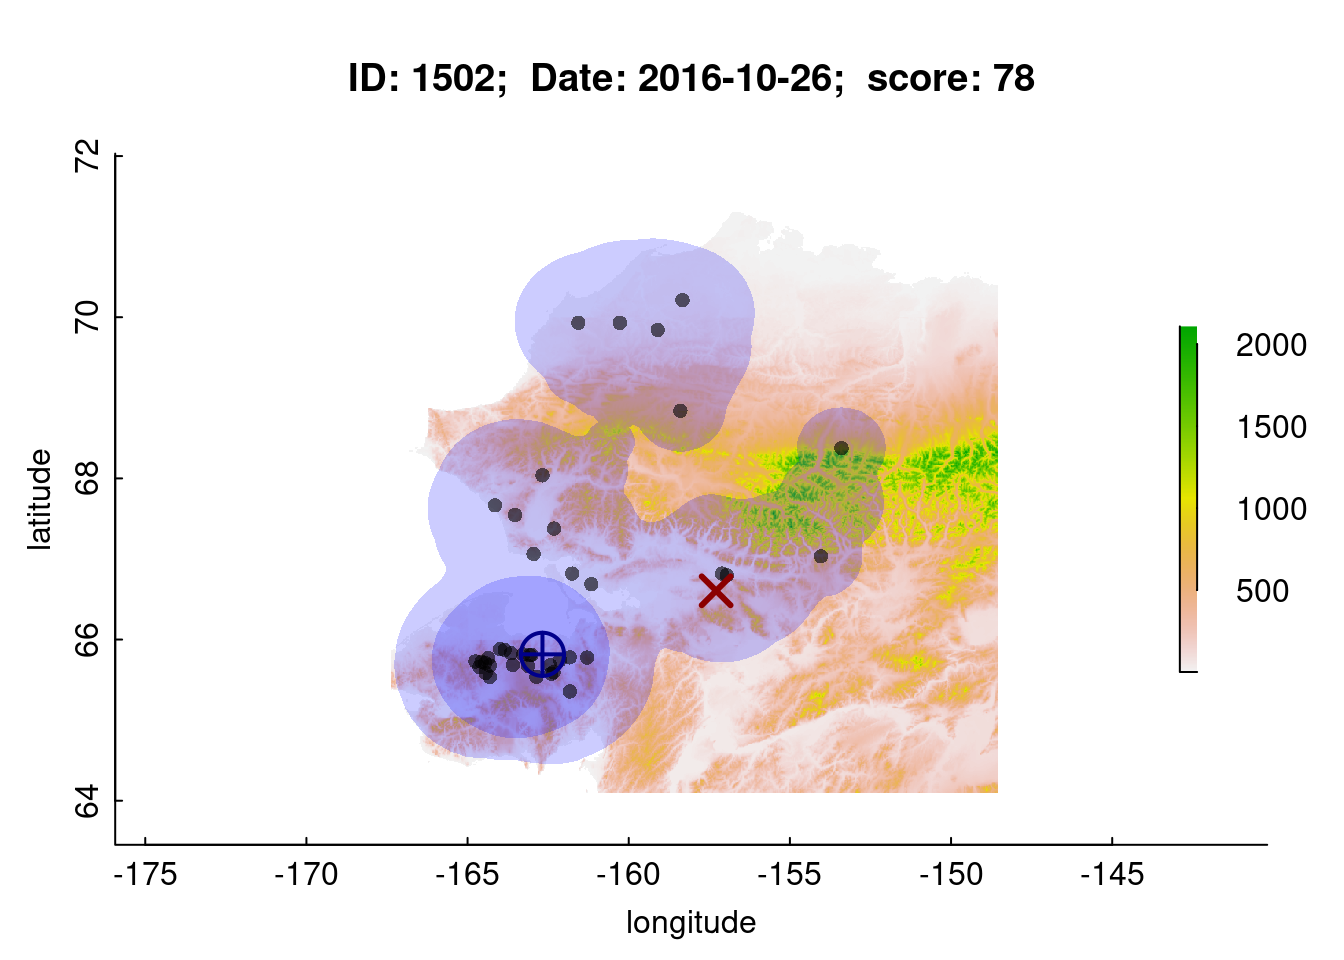
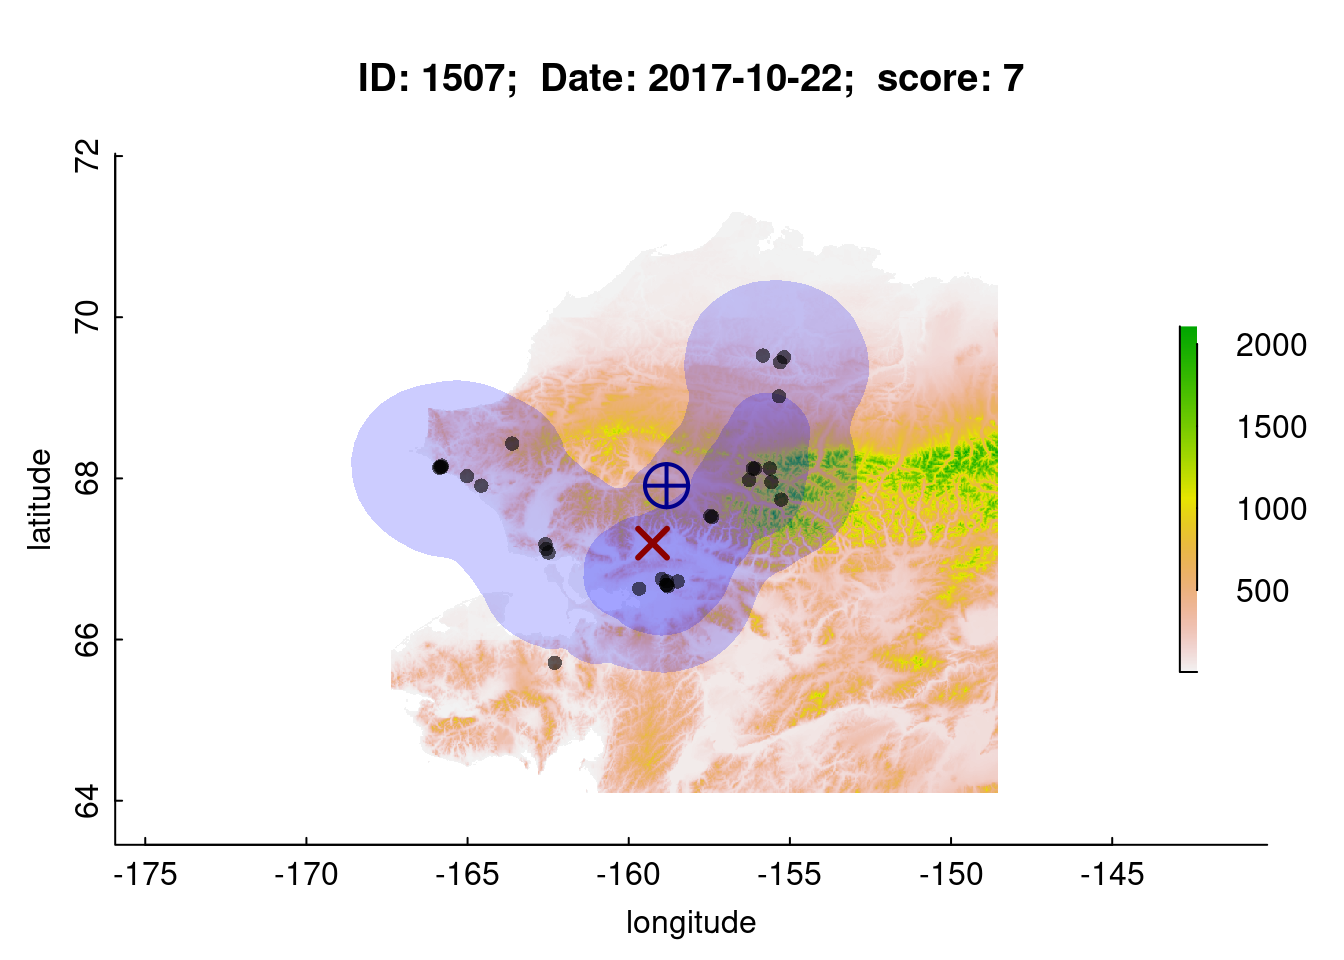
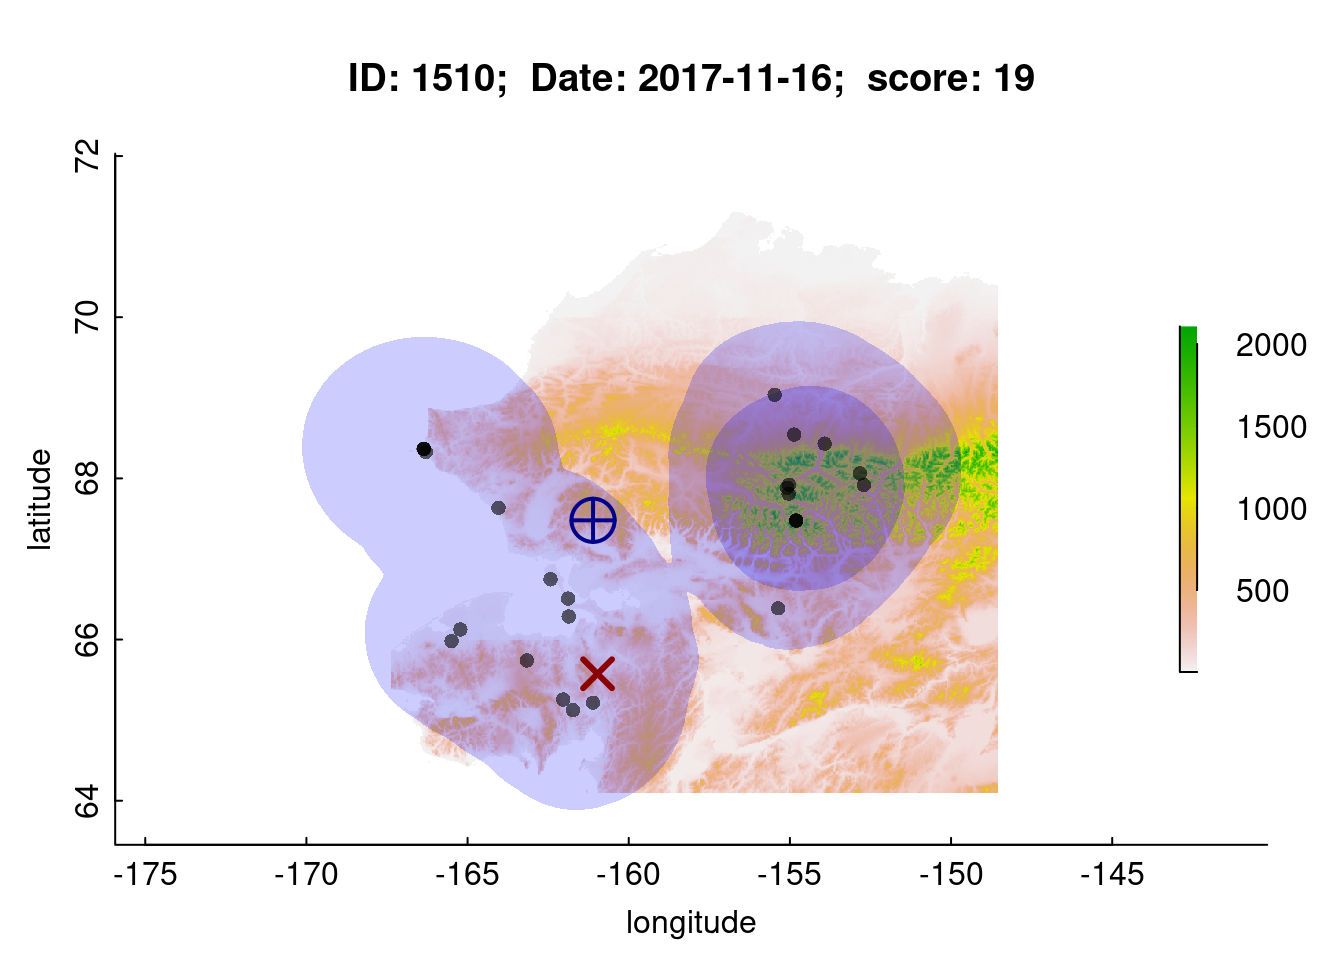
In the figures below - red X’s indicate moratlity events, shaded areas represent 50% and 95% kernel densities around the locations of other individuals at a given individual’s death date. The “score” is the percentiel of the distance of the mortality event from the (median) centroid of all locations (blue target character). Values closer to 100 indicate very great distances relative to other individuals.
Winter
0909
0936
0910
0920
0924

1101

0917

0911

1023
1038
1108
1403
1504
1522
1307
1517
1521

Spring
0904
0967
1007
1024
1104

1211
1303
1305
1308
1309
Calving
0925
0960
Insect Relief
0974
1008
1028
1201
1206
1207
1304
1306
Late summer
0918
0944
0958
1111
1212
1301
1405
1518
Fall
0906
0907
0938
0969

0975
1102
1109
1402
1502
1507
1510
1512