Visualizing WAH mortalities across Seasons and Years
Mannat Singh and Elie Gurarie
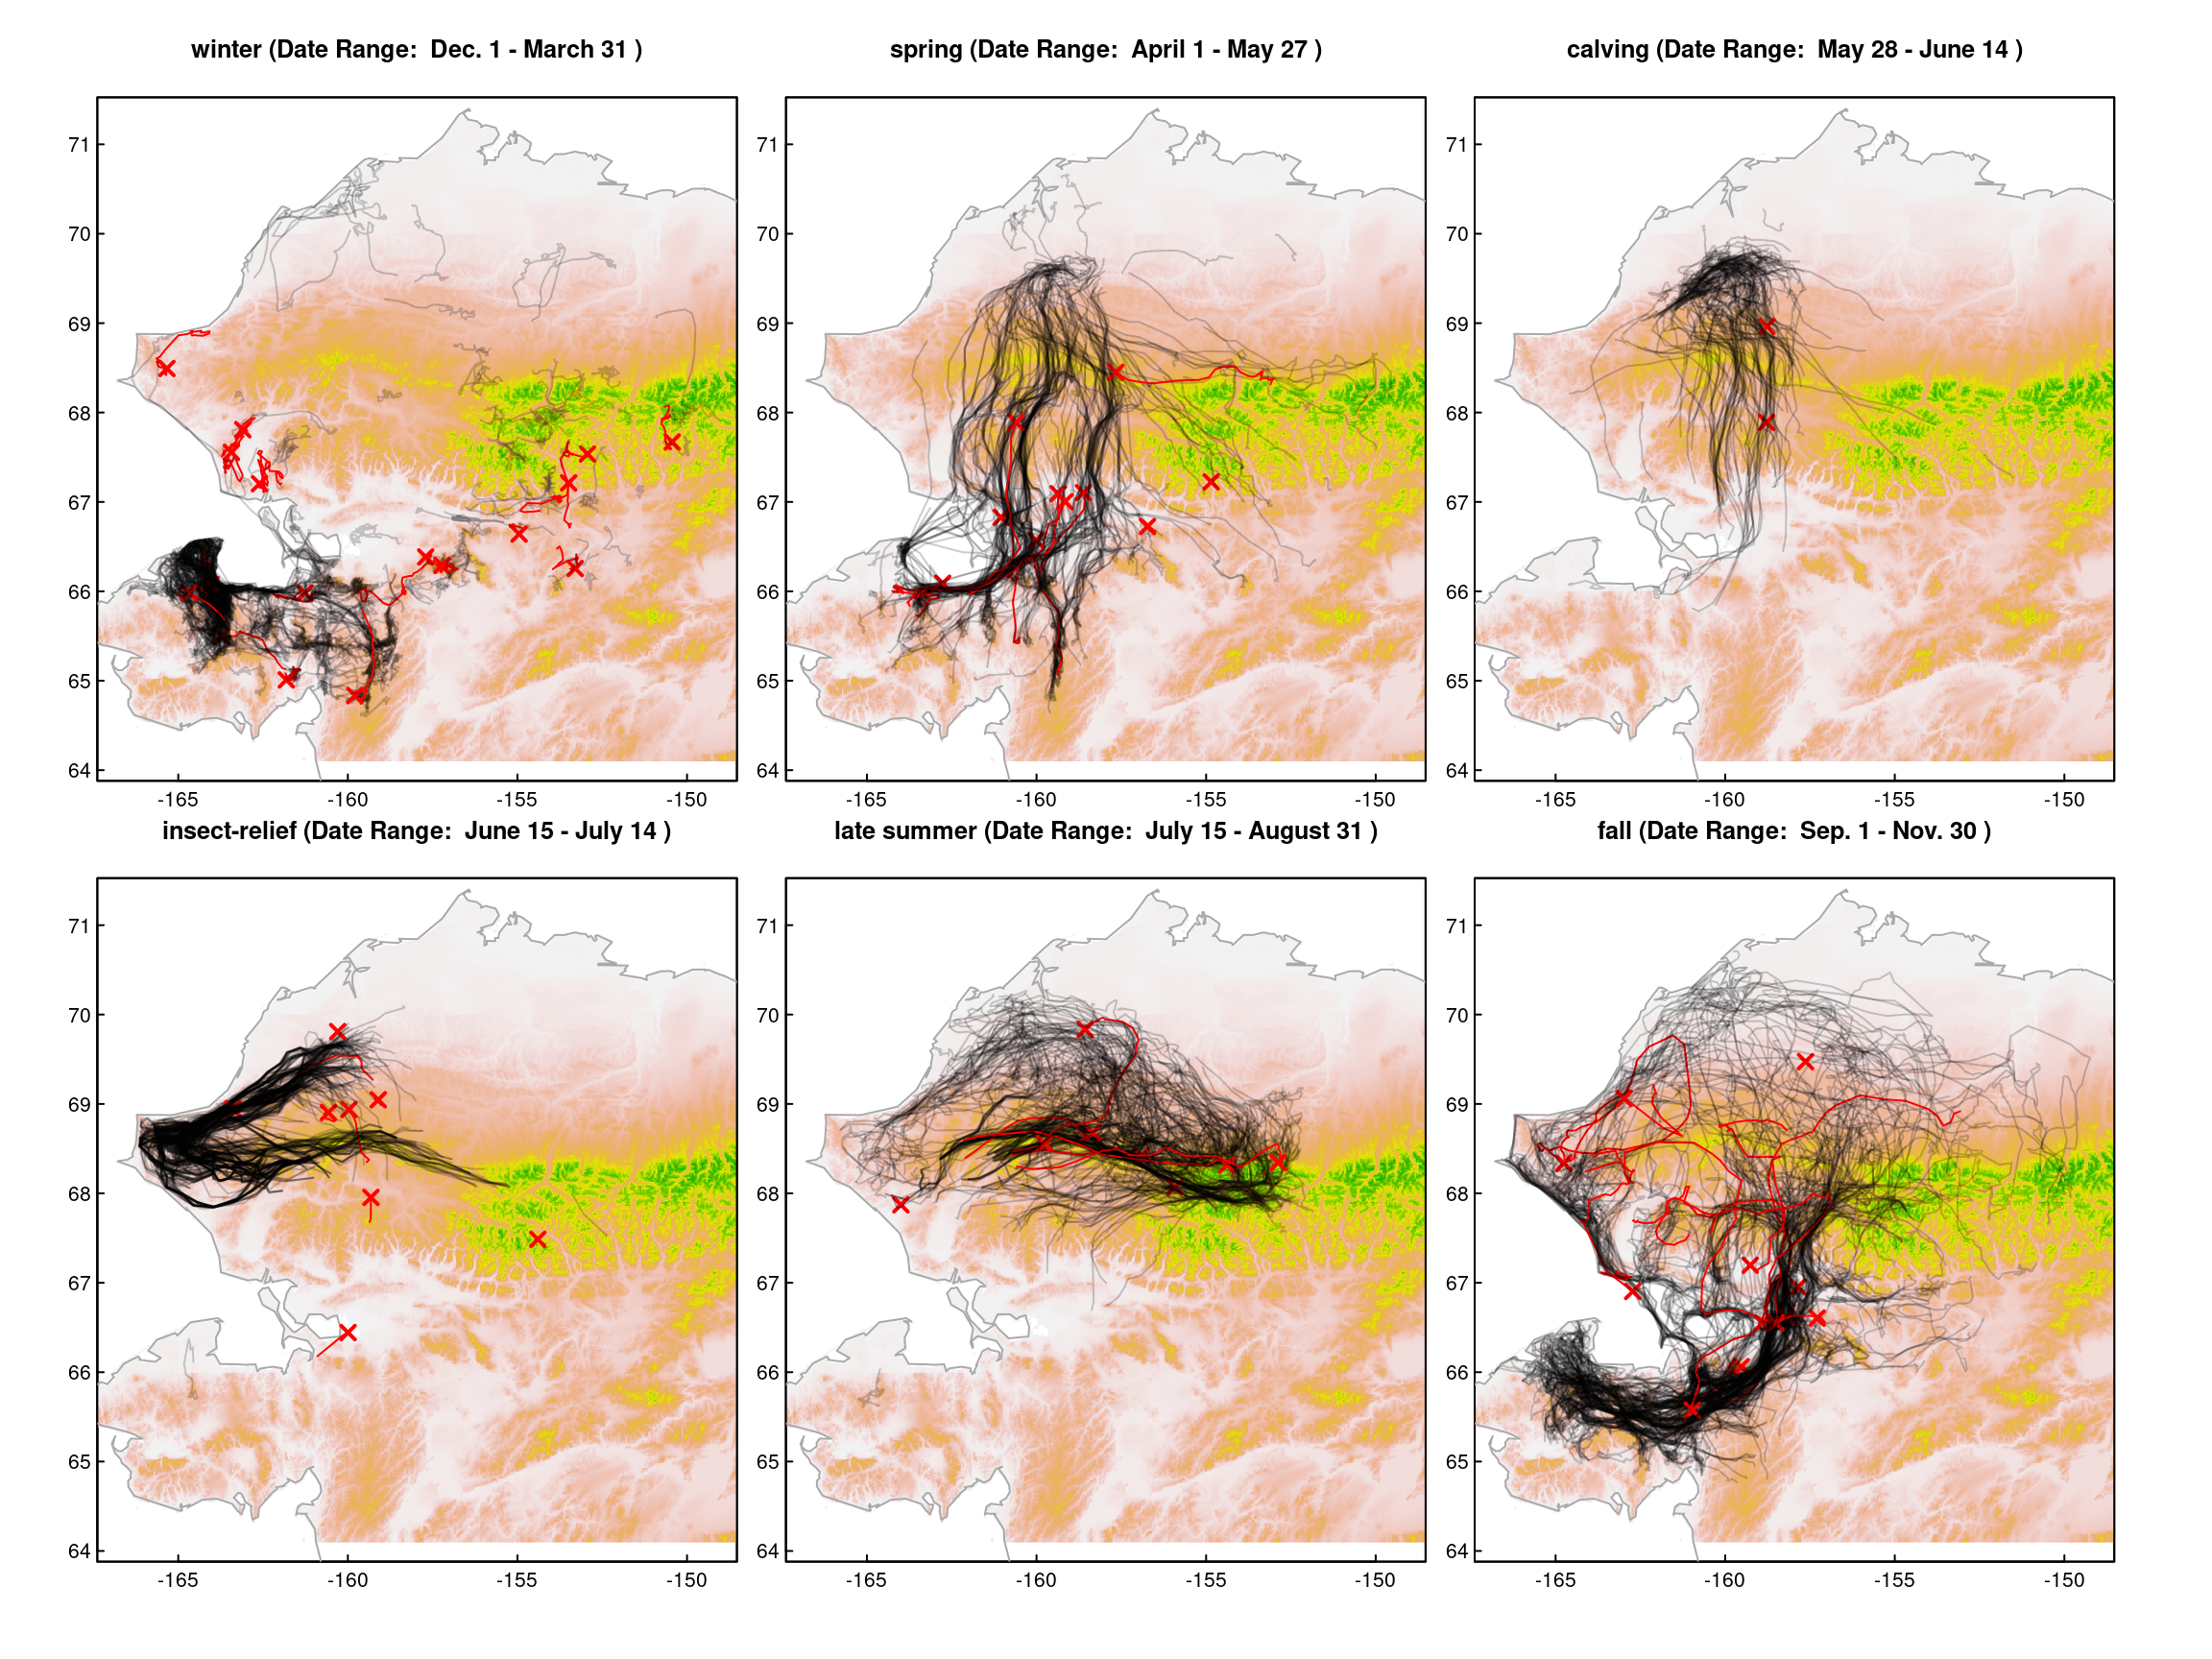
In the following plots, Tracks of Dead (red) and Alive (grey) animals can be compared actross the years and seasons of observations.
Map dead vs. alive by season
winter
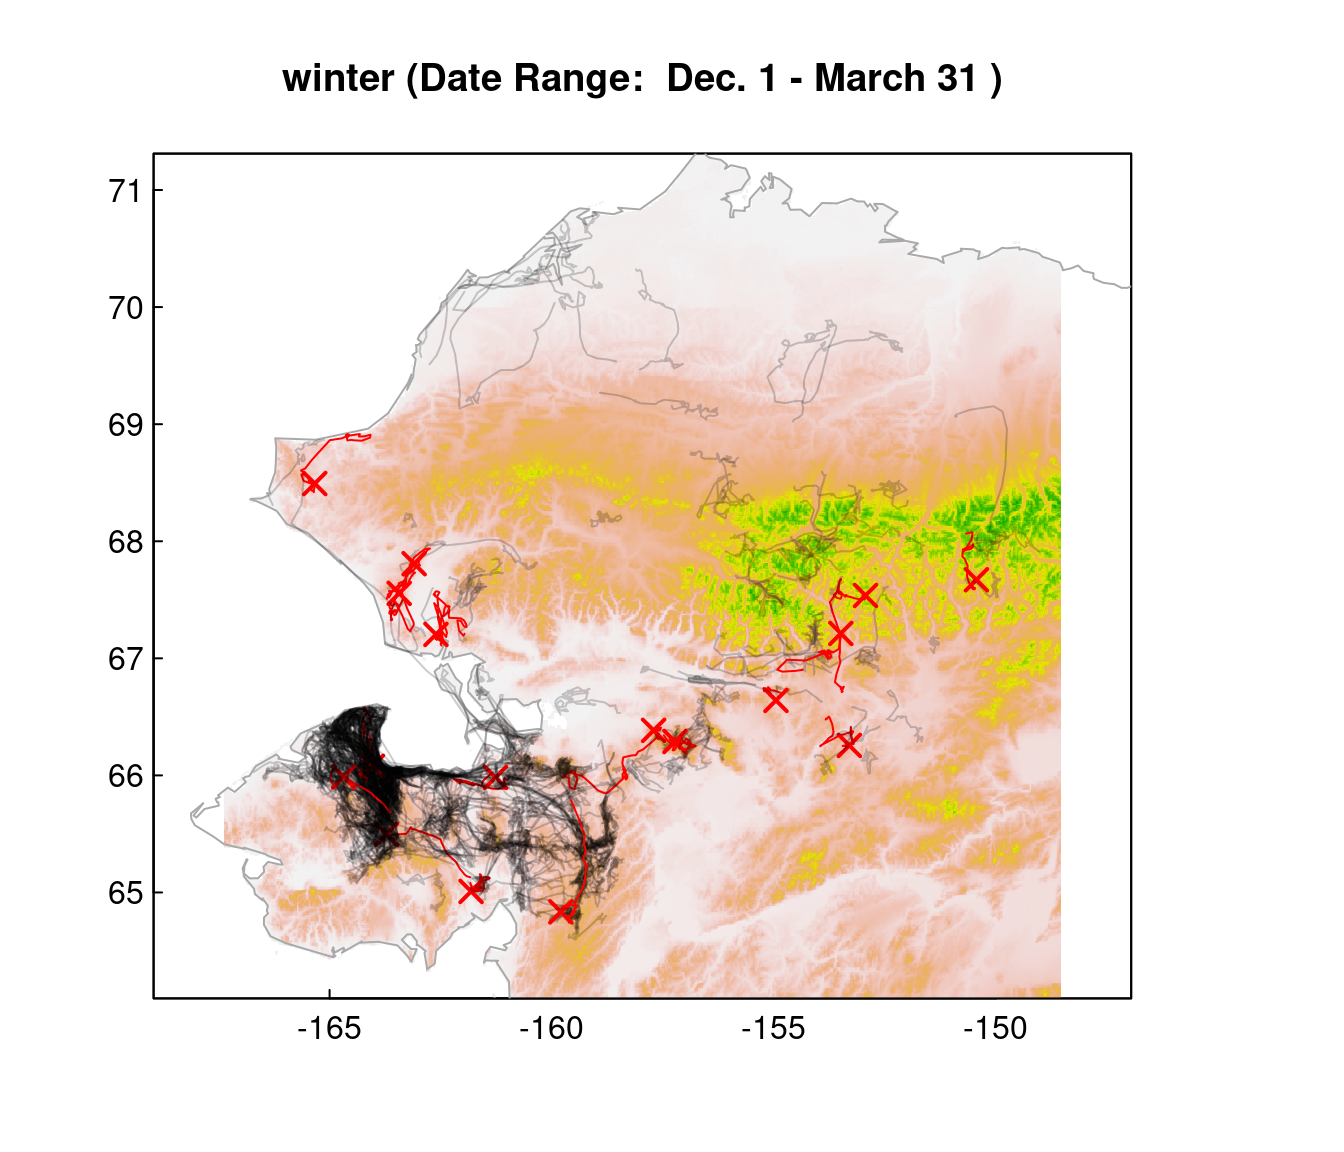
| ID | deathDate | Lon.mort | Lat.mort |
|---|---|---|---|
| 0909 | 2009-12-21 | -163.7209 | 65.49710 |
| 0936 | 2010-02-16 | -157.7054 | 66.38451 |
| 0910 | 2010-12-31 | -161.2634 | 65.98299 |
| 0920 | 2012-02-12 | -153.3450 | 66.24923 |
| 0924 | 2012-02-28 | -152.9346 | 67.53674 |
| 1101 | 2012-03-01 | -161.8149 | 65.00881 |
| 0917 | 2012-03-05 | -165.3324 | 68.49196 |
| 0911 | 2012-03-18 | -150.4382 | 67.67076 |
| 1023 | 2012-03-19 | -157.2197 | 66.28961 |
| 1038 | 2013-01-23 | -163.4297 | 67.55400 |
| 1108 | 2013-02-25 | -164.0398 | 66.08316 |
| 1403 | 2014-12-30 | -164.6717 | 65.99394 |
| 1504 | 2017-01-10 | -153.4918 | 67.21234 |
| 1522 | 2017-03-18 | -163.0967 | 67.80822 |
| 1307 | 2017-03-27 | -162.6059 | 67.20423 |
| 1517 | 2018-01-08 | -154.9662 | 66.63033 |
| 1521 | 2018-01-26 | -159.7932 | 64.83440 |
spring
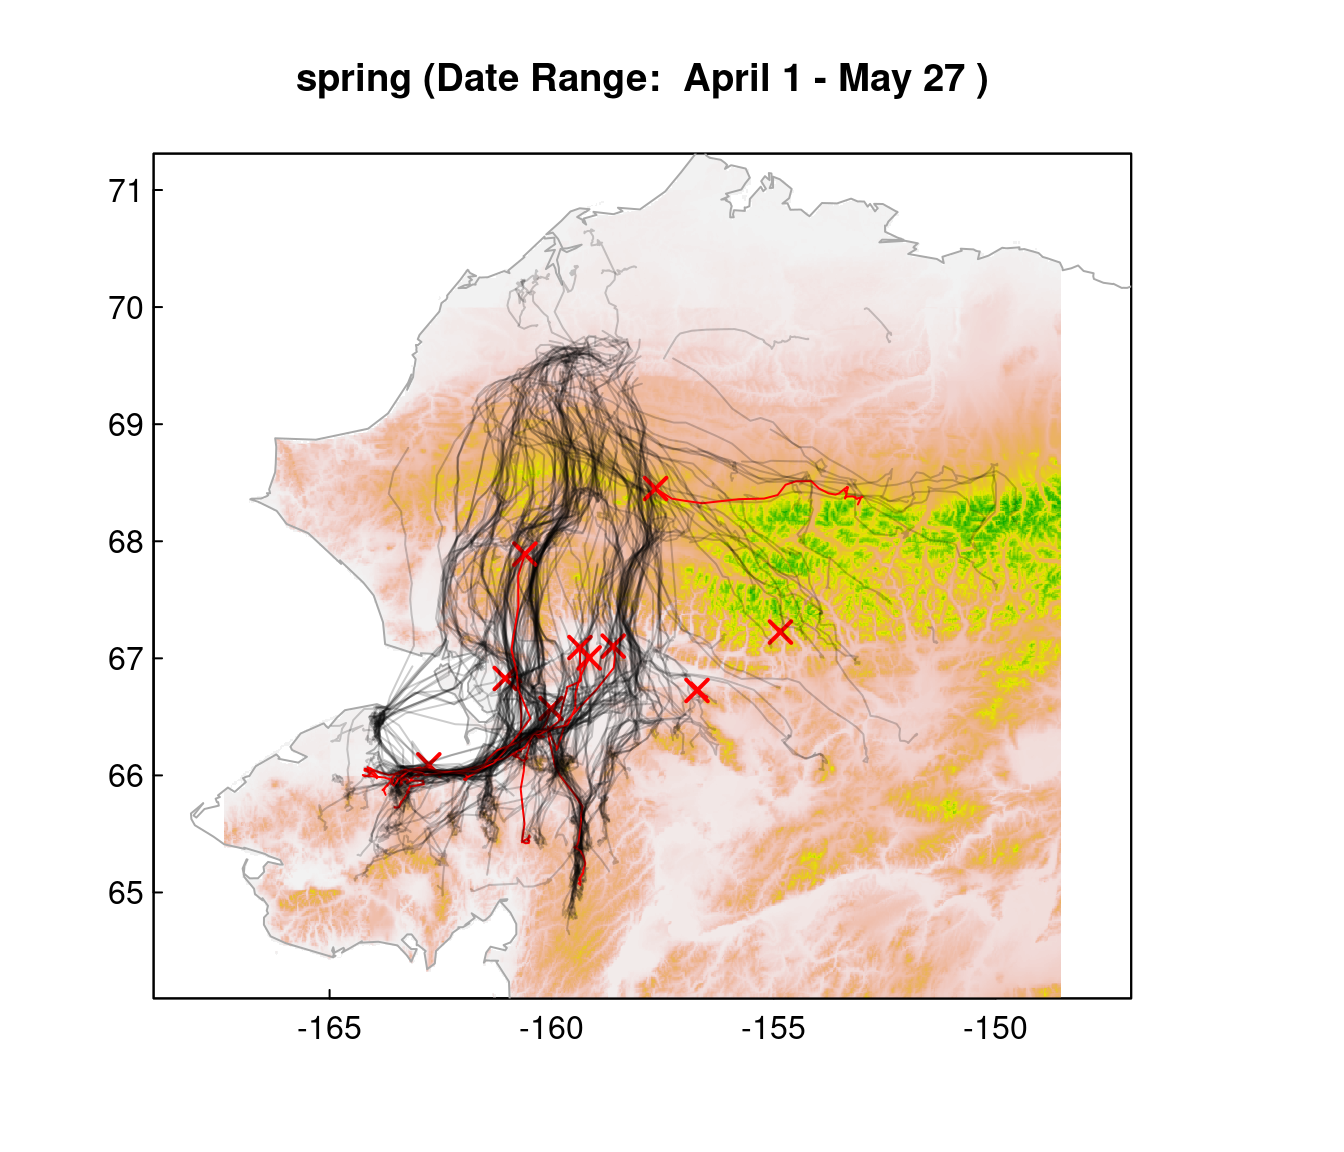
| ID | deathDate | Lon.mort | Lat.mort |
|---|---|---|---|
| 1007 | 2011-05-21 | -158.6149 | 67.10424 |
| 0904 | 2012-05-07 | -154.8506 | 67.22440 |
| 1104 | 2012-05-20 | -162.7666 | 66.09005 |
| 0967 | 2013-05-11 | -161.0457 | 66.82789 |
| 1024 | 2014-04-25 | -160.0294 | 66.57731 |
| 1305 | 2014-05-09 | -159.1366 | 67.01280 |
| 1308 | 2015-05-11 | -160.6029 | 67.88993 |
| 1303 | 2015-05-12 | -157.7442 | 68.46204 |
| 1211 | 2015-05-16 | -159.3626 | 67.11158 |
| 1309 | 2017-04-27 | -156.7283 | 66.72523 |
calving
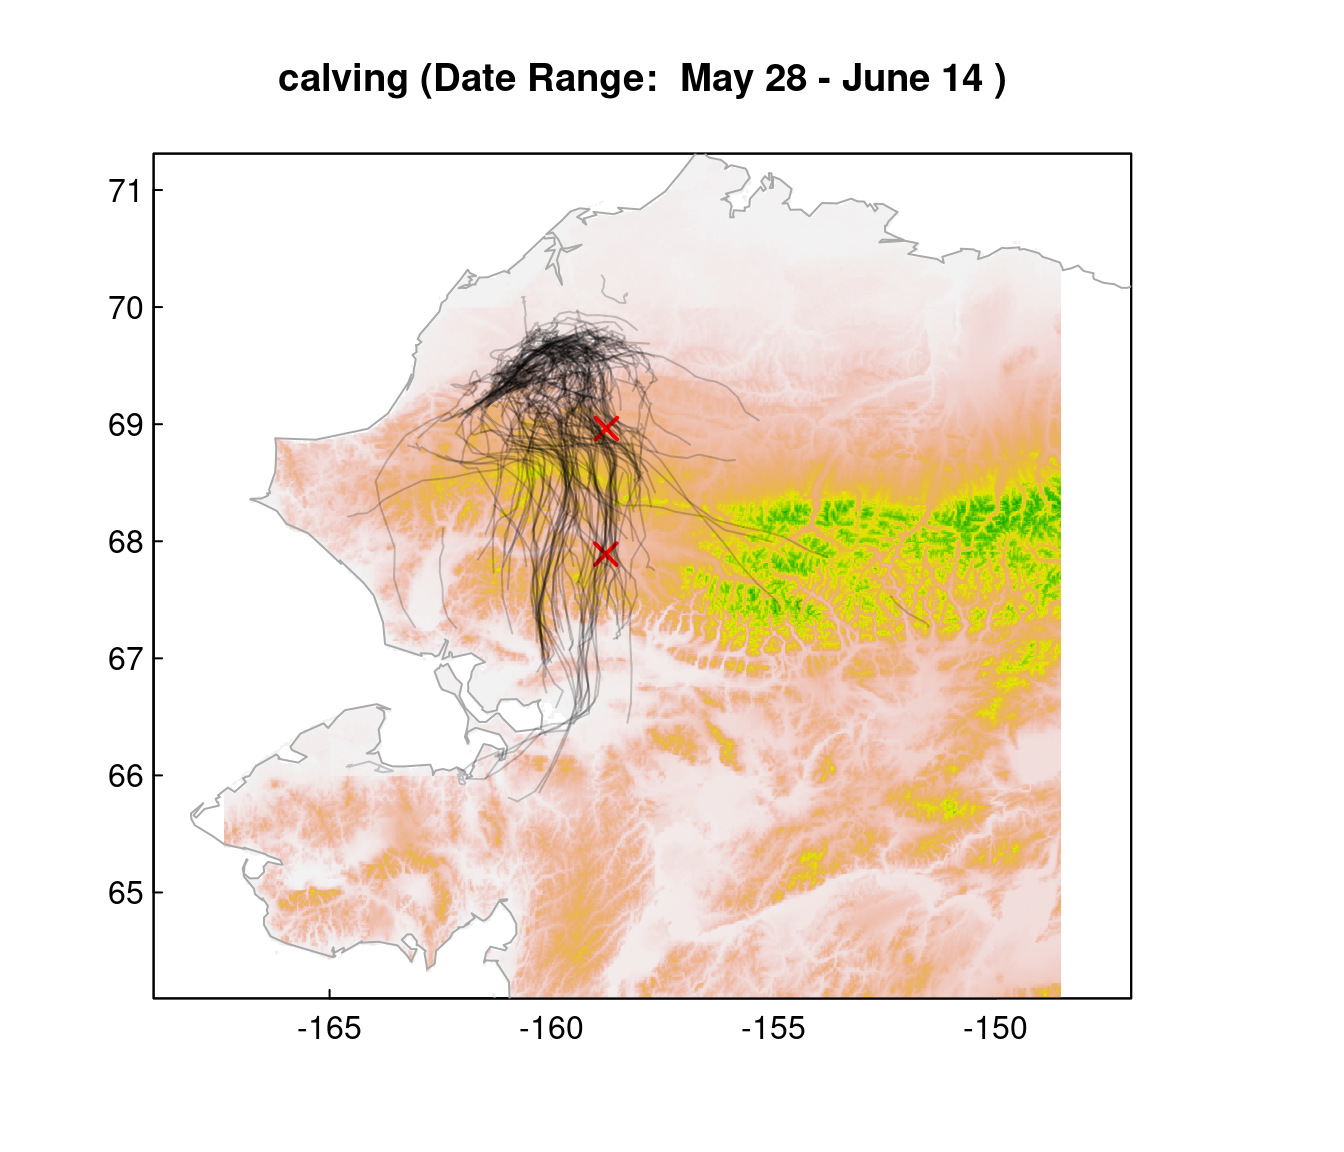
| ID | deathDate | Lon.mort | Lat.mort |
|---|---|---|---|
| 0925 | 2010-06-11 | -158.7745 | 67.89320 |
| 0960 | 2014-06-01 | -158.7804 | 68.96013 |
insect-relief
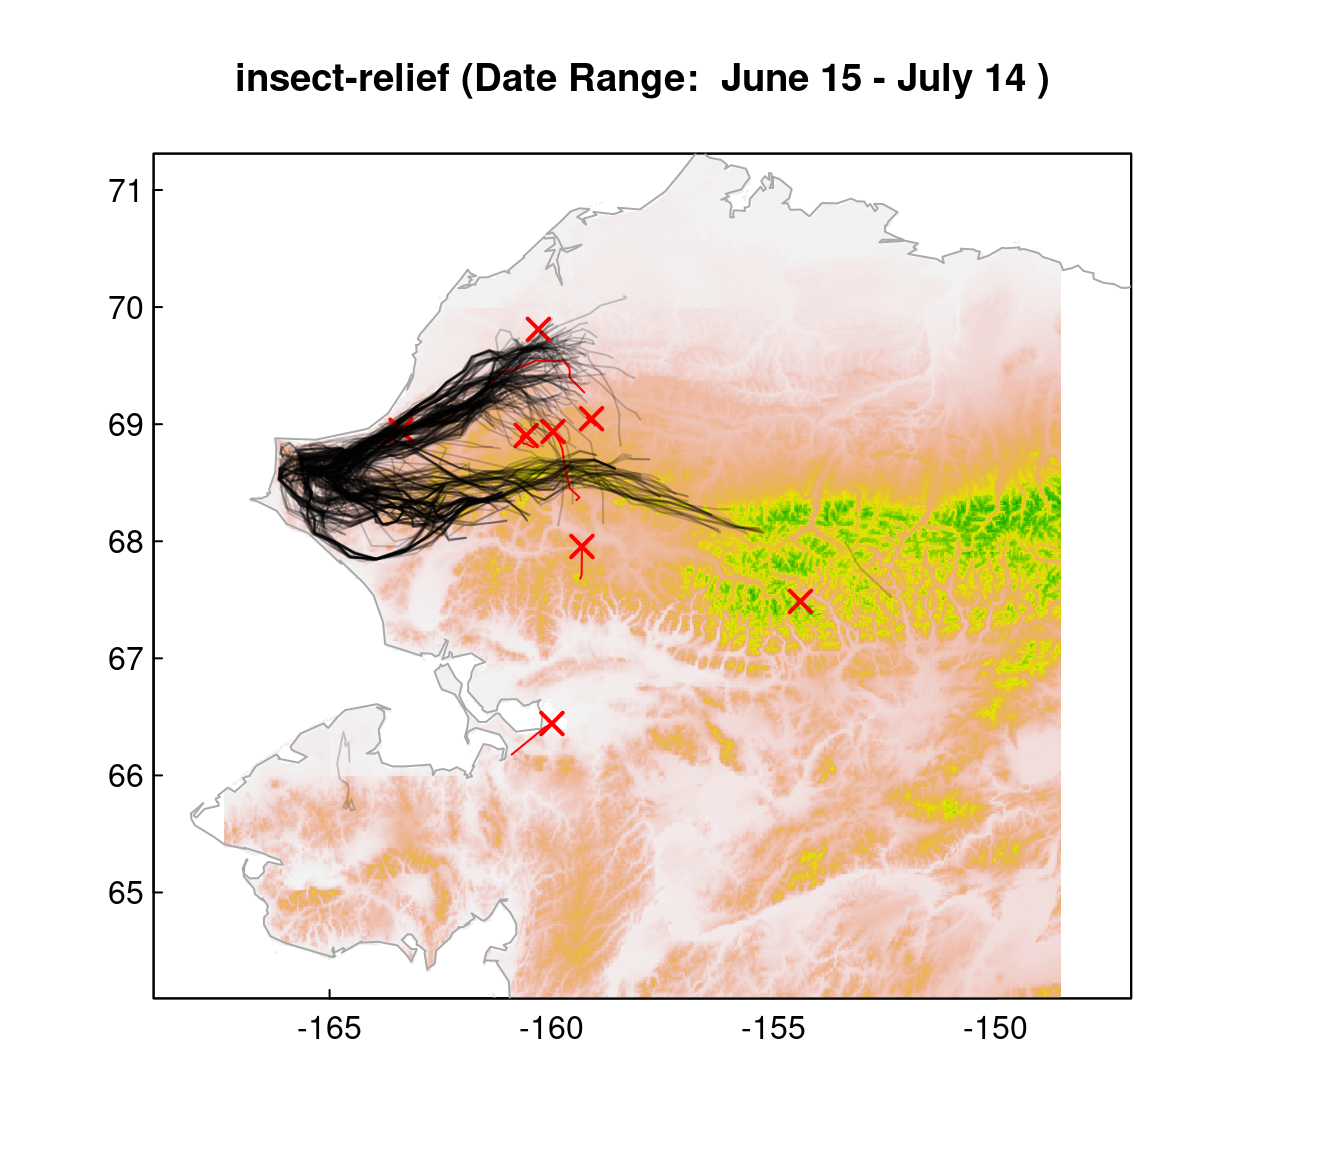
| ID | deathDate | Lon.mort | Lat.mort |
|---|---|---|---|
| 1028 | 2011-06-25 | -160.5721 | 68.90342 |
| 1008 | 2012-06-14 | -154.3997 | 67.48616 |
| 1206 | 2013-06-17 | -159.9915 | 66.43899 |
| 1207 | 2013-06-18 | -159.3195 | 67.95487 |
| 1201 | 2013-06-22 | -159.9703 | 68.93681 |
| 0974 | 2013-07-02 | -163.3911 | 68.94764 |
| 1304 | 2015-06-17 | -160.2892 | 69.81105 |
| 1306 | 2015-07-01 | -159.1043 | 69.04624 |
late summer
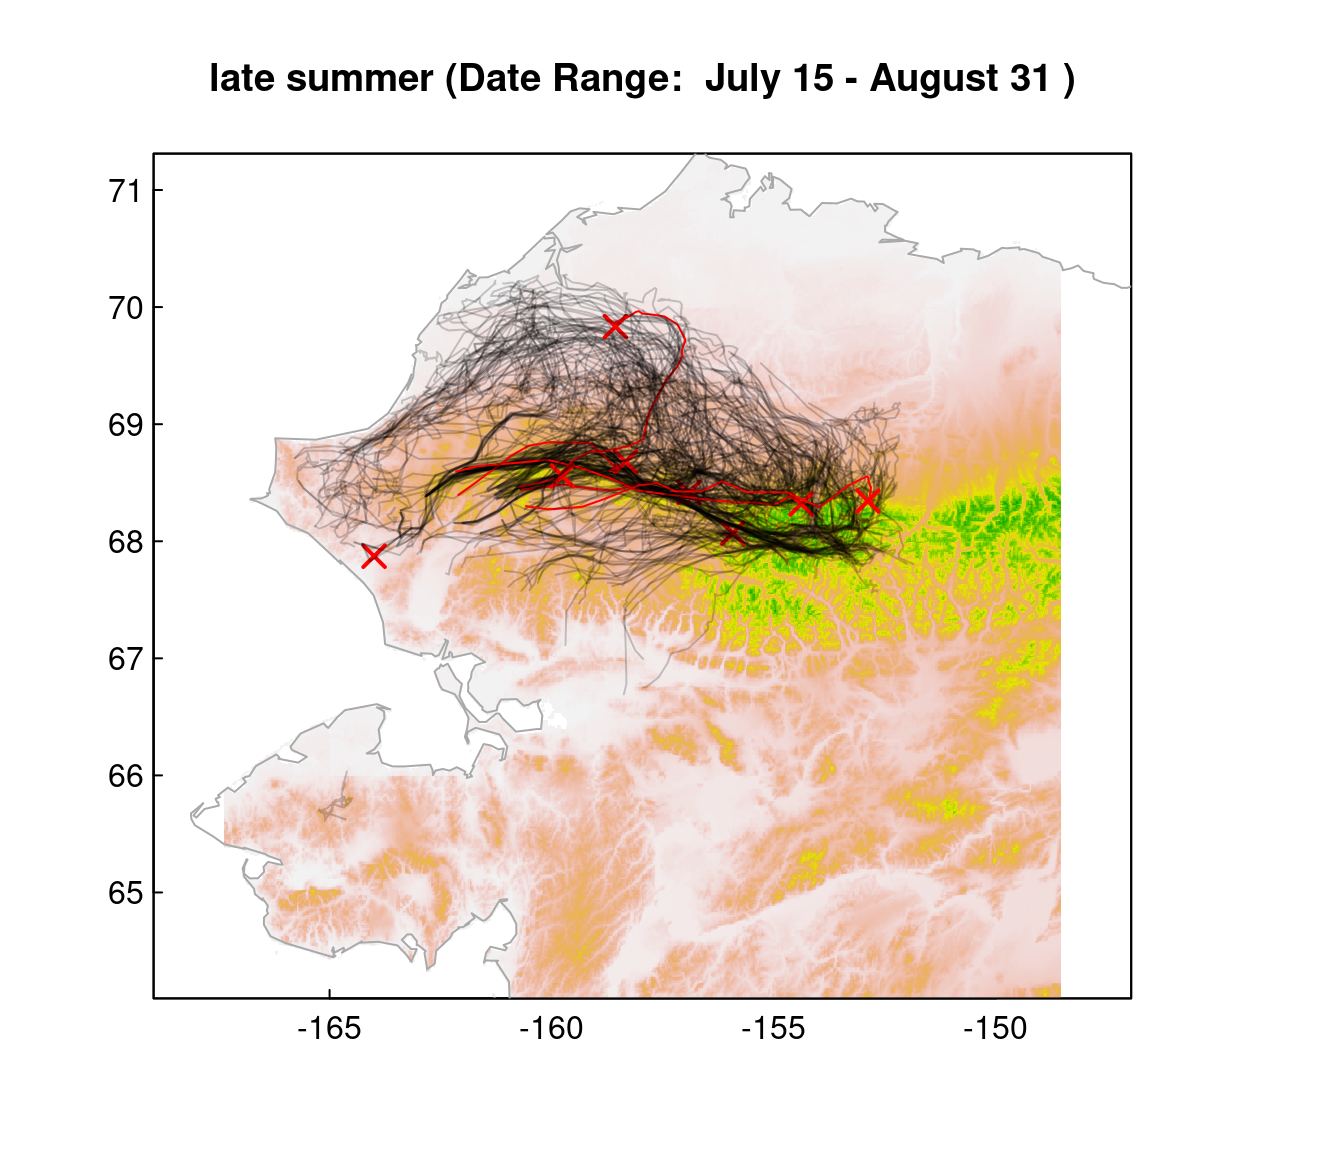
| ID | deathDate | Lon.mort | Lat.mort |
|---|---|---|---|
| 0958 | 2010-07-20 | -155.9145 | 68.07047 |
| 0944 | 2010-08-20 | -156.9080 | 68.41600 |
| 0918 | 2012-07-17 | -163.9868 | 67.86977 |
| 1111 | 2012-08-25 | -158.3342 | 68.67821 |
| 1212 | 2013-07-28 | -154.3344 | 68.31328 |
| 1301 | 2014-08-19 | -158.5643 | 69.83340 |
| 1405 | 2015-07-25 | -159.7633 | 68.55646 |
| 1518 | 2017-08-14 | -152.8803 | 68.34366 |
fall
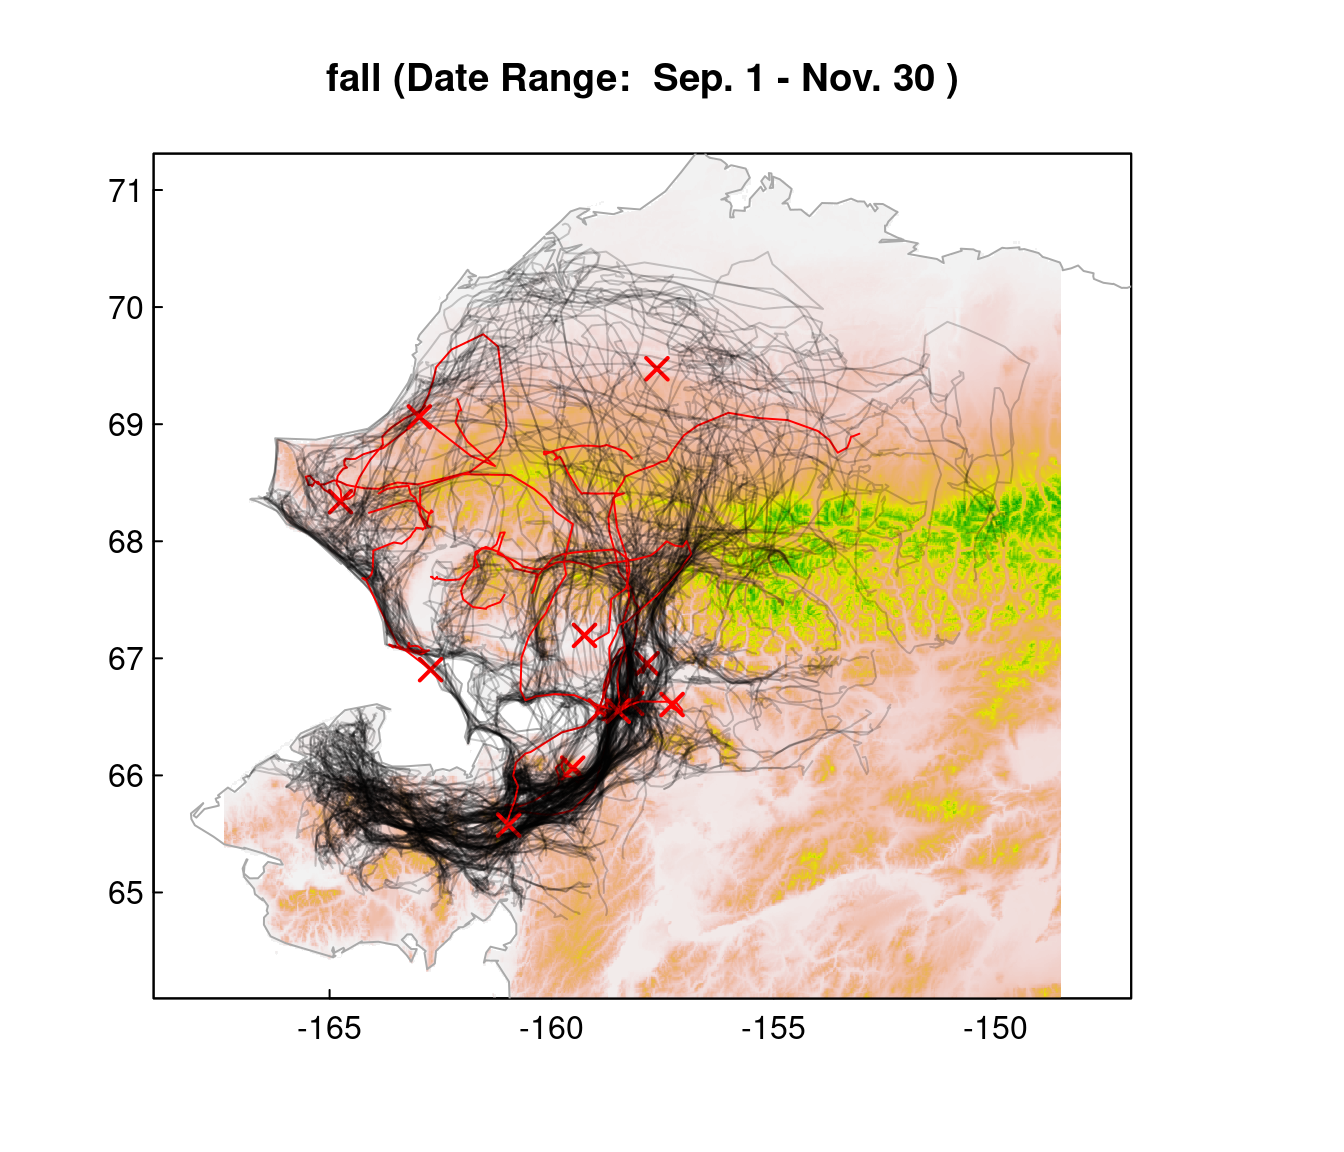
| ID | deathDate | Lon.mort | Lat.mort |
|---|---|---|---|
| 0975 | 2009-10-01 | -158.9004 | 66.54363 |
| 0969 | 2009-10-31 | -159.5391 | 66.04882 |
| 0907 | 2010-09-12 | -157.6304 | 69.47321 |
| 0938 | 2010-10-18 | -157.8499 | 66.95720 |
| 0906 | 2011-11-09 | -164.7281 | 68.32778 |
| 1109 | 2012-09-23 | -162.9787 | 69.06194 |
| 1102 | 2012-11-16 | -158.2277 | 66.60541 |
| 1512 | 2015-10-05 | -158.5019 | 66.54929 |
| 1402 | 2015-11-12 | -162.7261 | 66.90316 |
| 1502 | 2016-10-26 | -157.2885 | 66.60500 |
| 1507 | 2017-10-22 | -159.2641 | 67.19680 |
| 1510 | 2017-11-16 | -160.9678 | 65.57534 |
Map dead vs. alive by year
2009
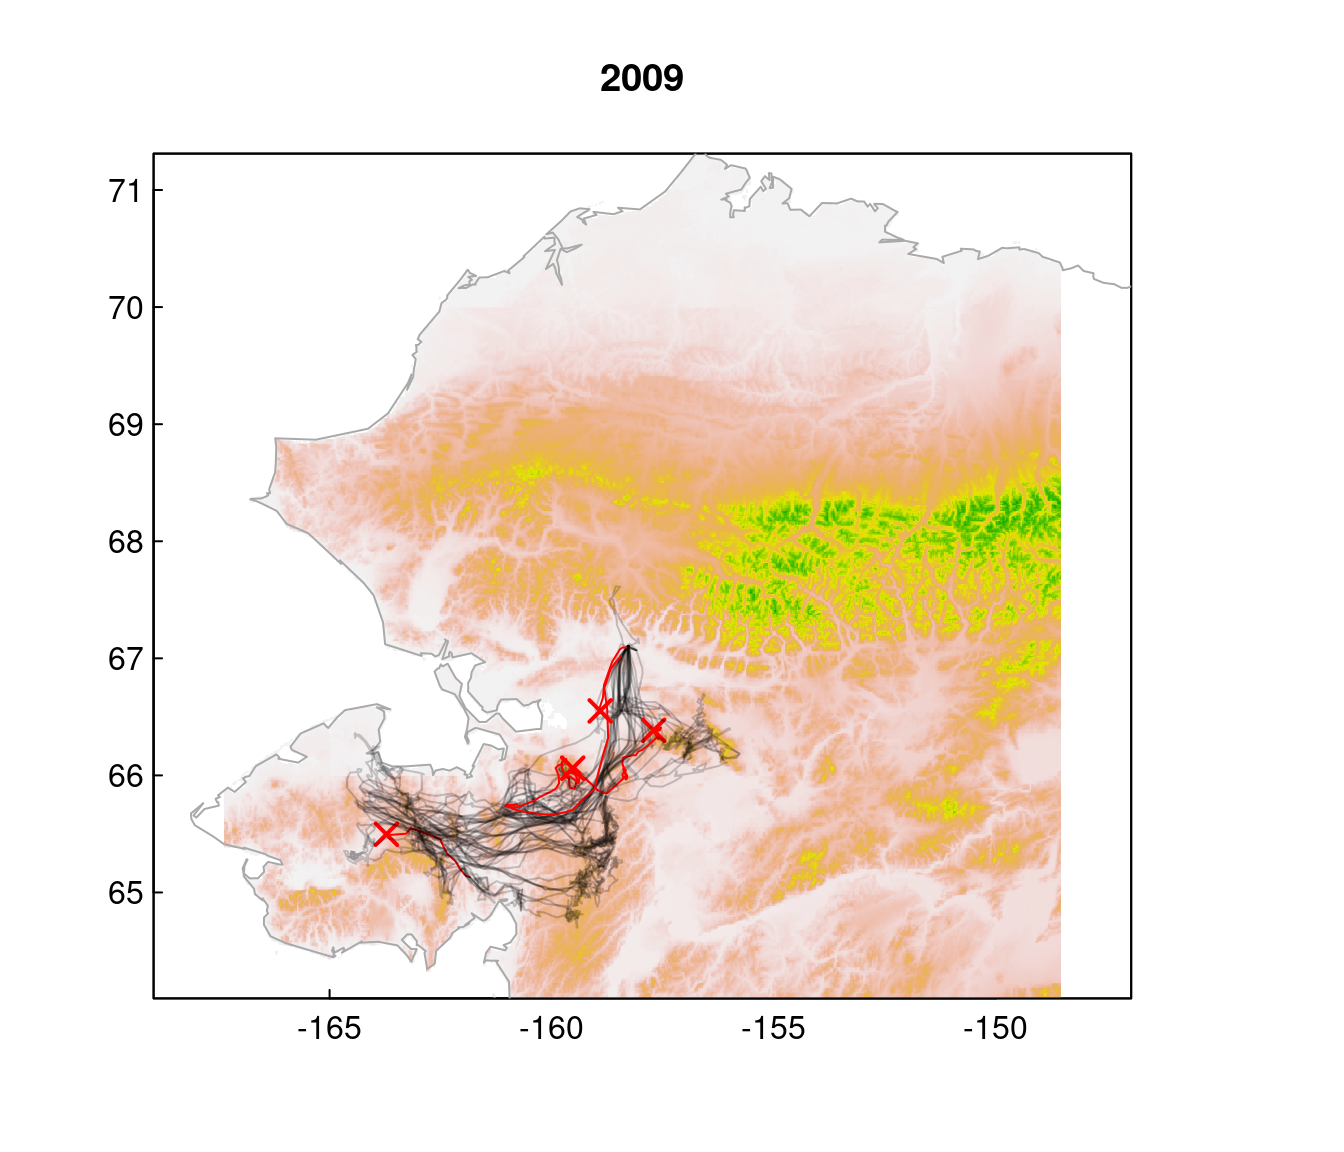
| ID | deathDate | Lon.mort | Lat.mort | deathSeason.year |
|---|---|---|---|---|
| 0975 | 2009-10-01 | -158.9004 | 66.54363 | 2009 |
| 0969 | 2009-10-31 | -159.5391 | 66.04882 | 2009 |
| 0909 | 2009-12-21 | -163.7209 | 65.49710 | 2009 |
| 0936 | 2010-02-16 | -157.7054 | 66.38451 | 2009 |
2010
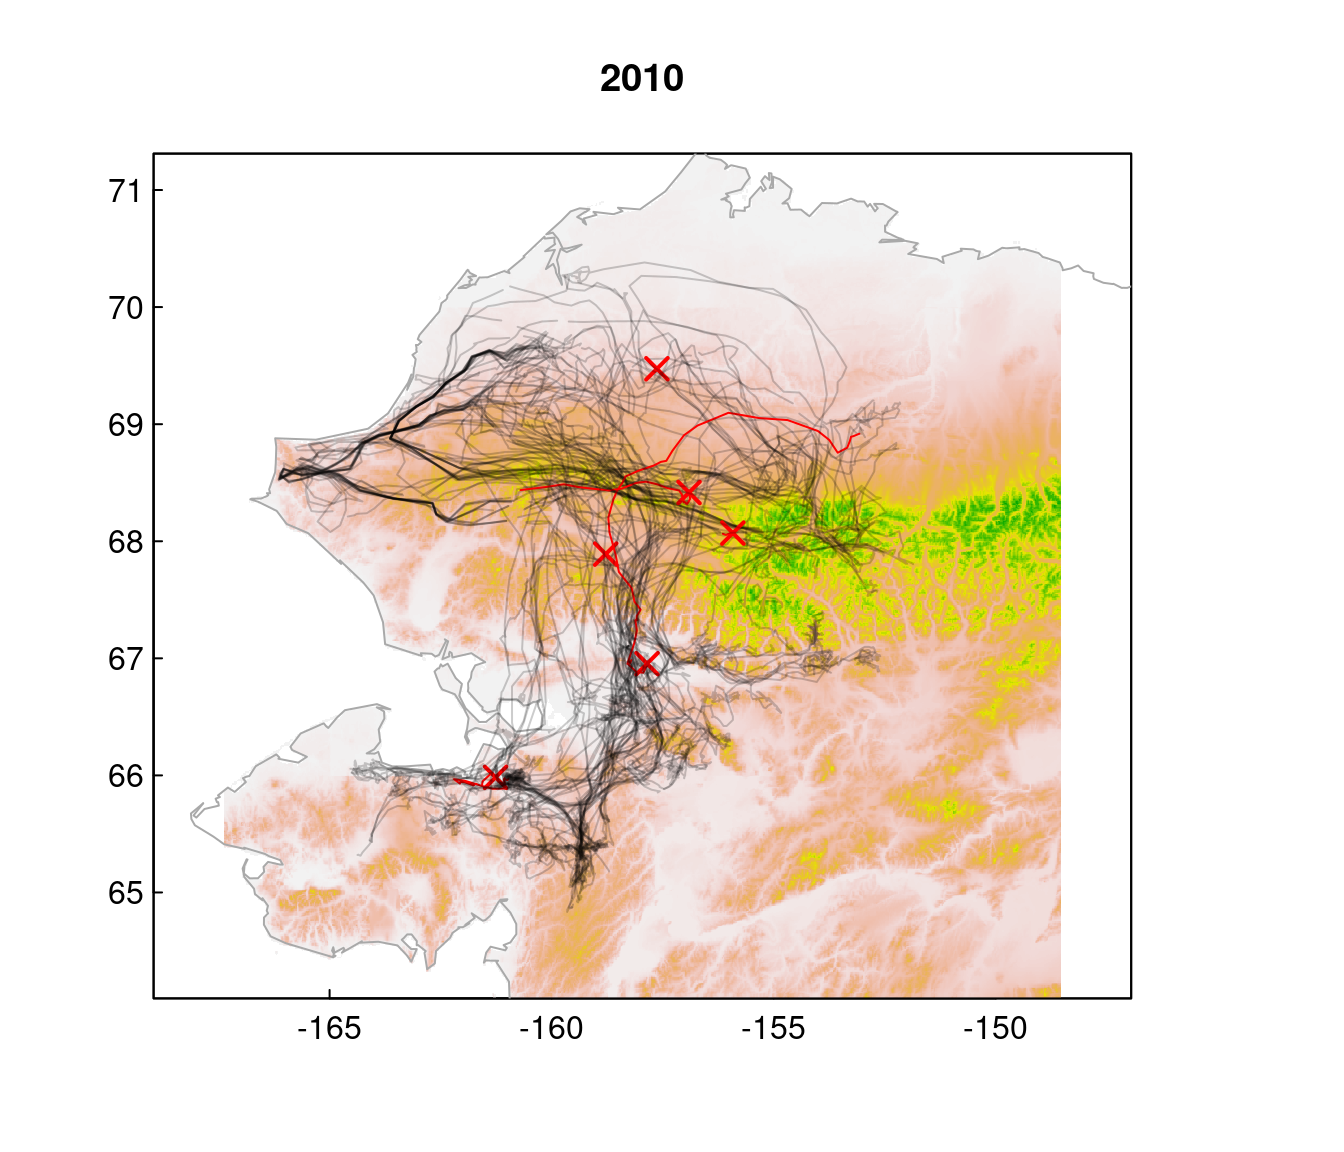
| ID | deathDate | Lon.mort | Lat.mort | deathSeason.year |
|---|---|---|---|---|
| 0925 | 2010-06-11 | -158.7745 | 67.89320 | 2010 |
| 0958 | 2010-07-20 | -155.9145 | 68.07047 | 2010 |
| 0944 | 2010-08-20 | -156.9080 | 68.41600 | 2010 |
| 0907 | 2010-09-12 | -157.6304 | 69.47321 | 2010 |
| 0938 | 2010-10-18 | -157.8499 | 66.95720 | 2010 |
| 0910 | 2010-12-31 | -161.2634 | 65.98299 | 2010 |
2011
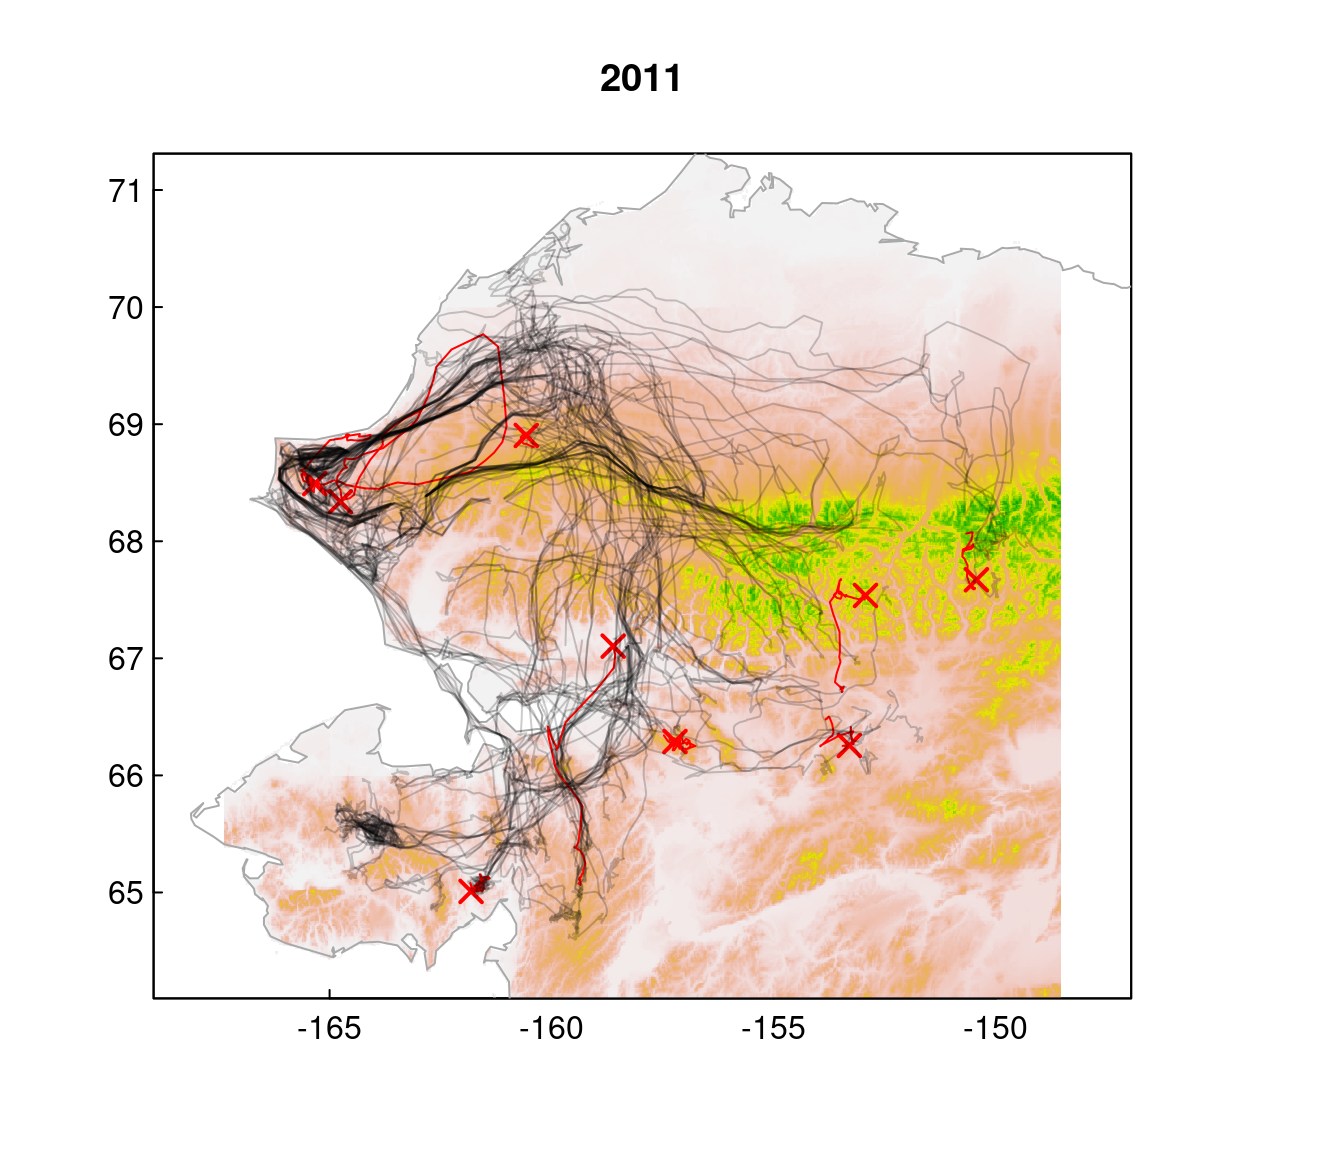
| ID | deathDate | Lon.mort | Lat.mort | deathSeason.year |
|---|---|---|---|---|
| 1007 | 2011-05-21 | -158.6149 | 67.10424 | 2011 |
| 1028 | 2011-06-25 | -160.5721 | 68.90342 | 2011 |
| 0906 | 2011-11-09 | -164.7281 | 68.32778 | 2011 |
| 0920 | 2012-02-12 | -153.3450 | 66.24923 | 2011 |
| 0924 | 2012-02-28 | -152.9346 | 67.53674 | 2011 |
| 1101 | 2012-03-01 | -161.8149 | 65.00881 | 2011 |
| 0917 | 2012-03-05 | -165.3324 | 68.49196 | 2011 |
| 0911 | 2012-03-18 | -150.4382 | 67.67076 | 2011 |
| 1023 | 2012-03-19 | -157.2197 | 66.28961 | 2011 |
2012
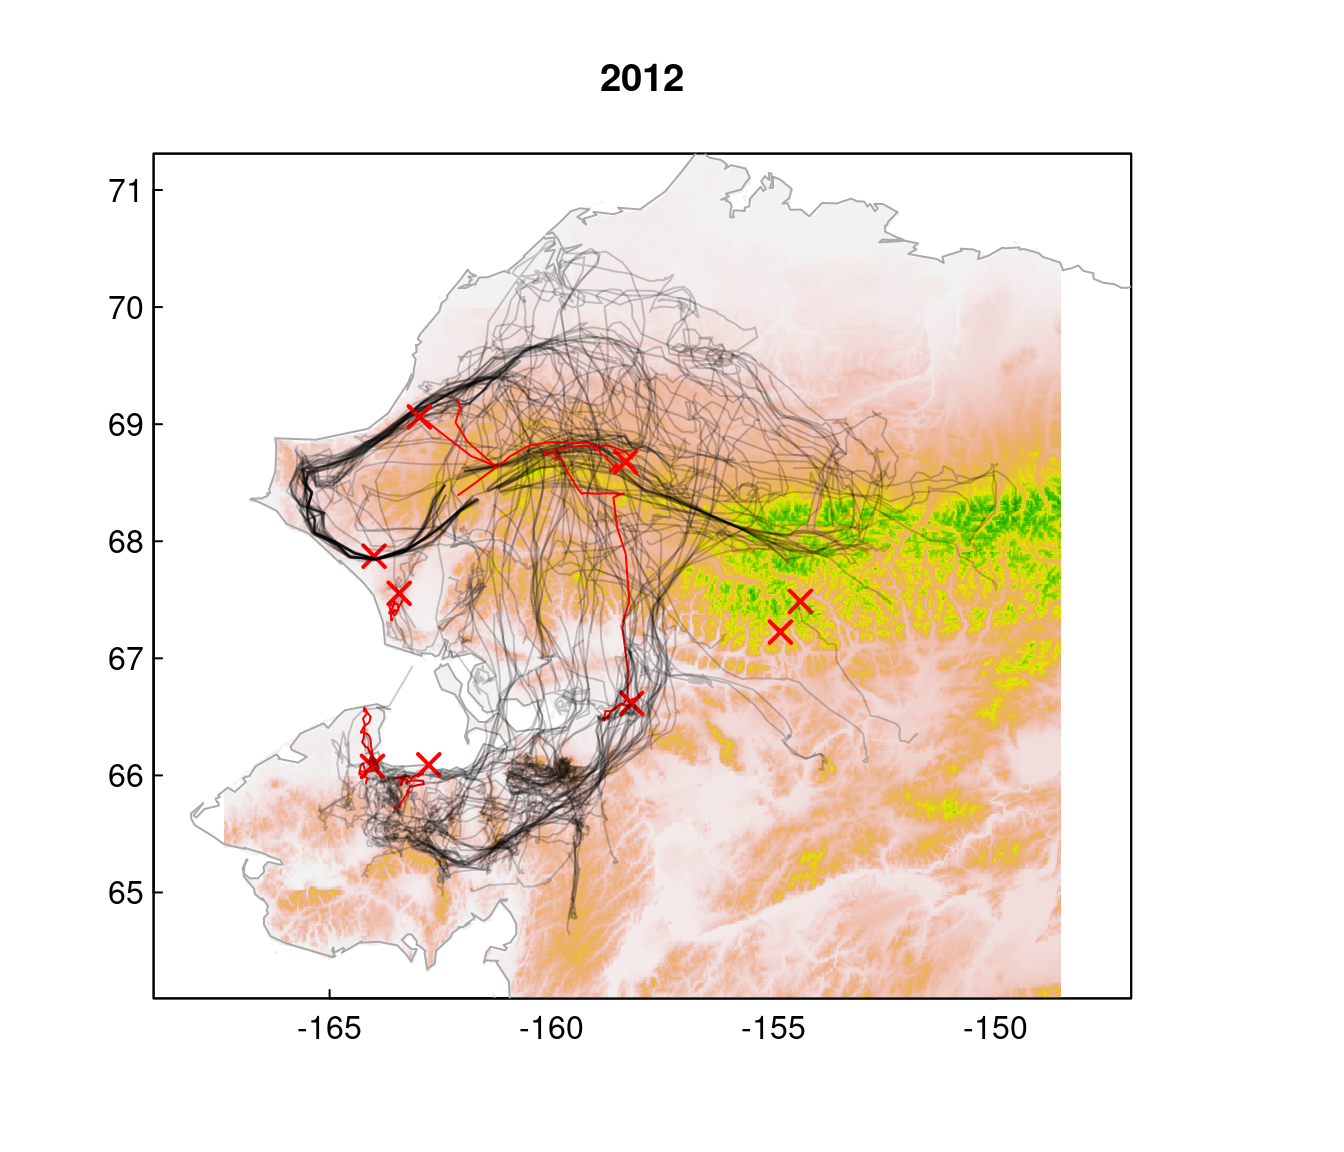
| ID | deathDate | Lon.mort | Lat.mort | deathSeason.year |
|---|---|---|---|---|
| 0904 | 2012-05-07 | -154.8506 | 67.22440 | 2012 |
| 1104 | 2012-05-20 | -162.7666 | 66.09005 | 2012 |
| 1008 | 2012-06-14 | -154.3997 | 67.48616 | 2012 |
| 0918 | 2012-07-17 | -163.9868 | 67.86977 | 2012 |
| 1111 | 2012-08-25 | -158.3342 | 68.67821 | 2012 |
| 1109 | 2012-09-23 | -162.9787 | 69.06194 | 2012 |
| 1102 | 2012-11-16 | -158.2277 | 66.60541 | 2012 |
| 1038 | 2013-01-23 | -163.4297 | 67.55400 | 2012 |
| 1108 | 2013-02-25 | -164.0398 | 66.08316 | 2012 |
2013
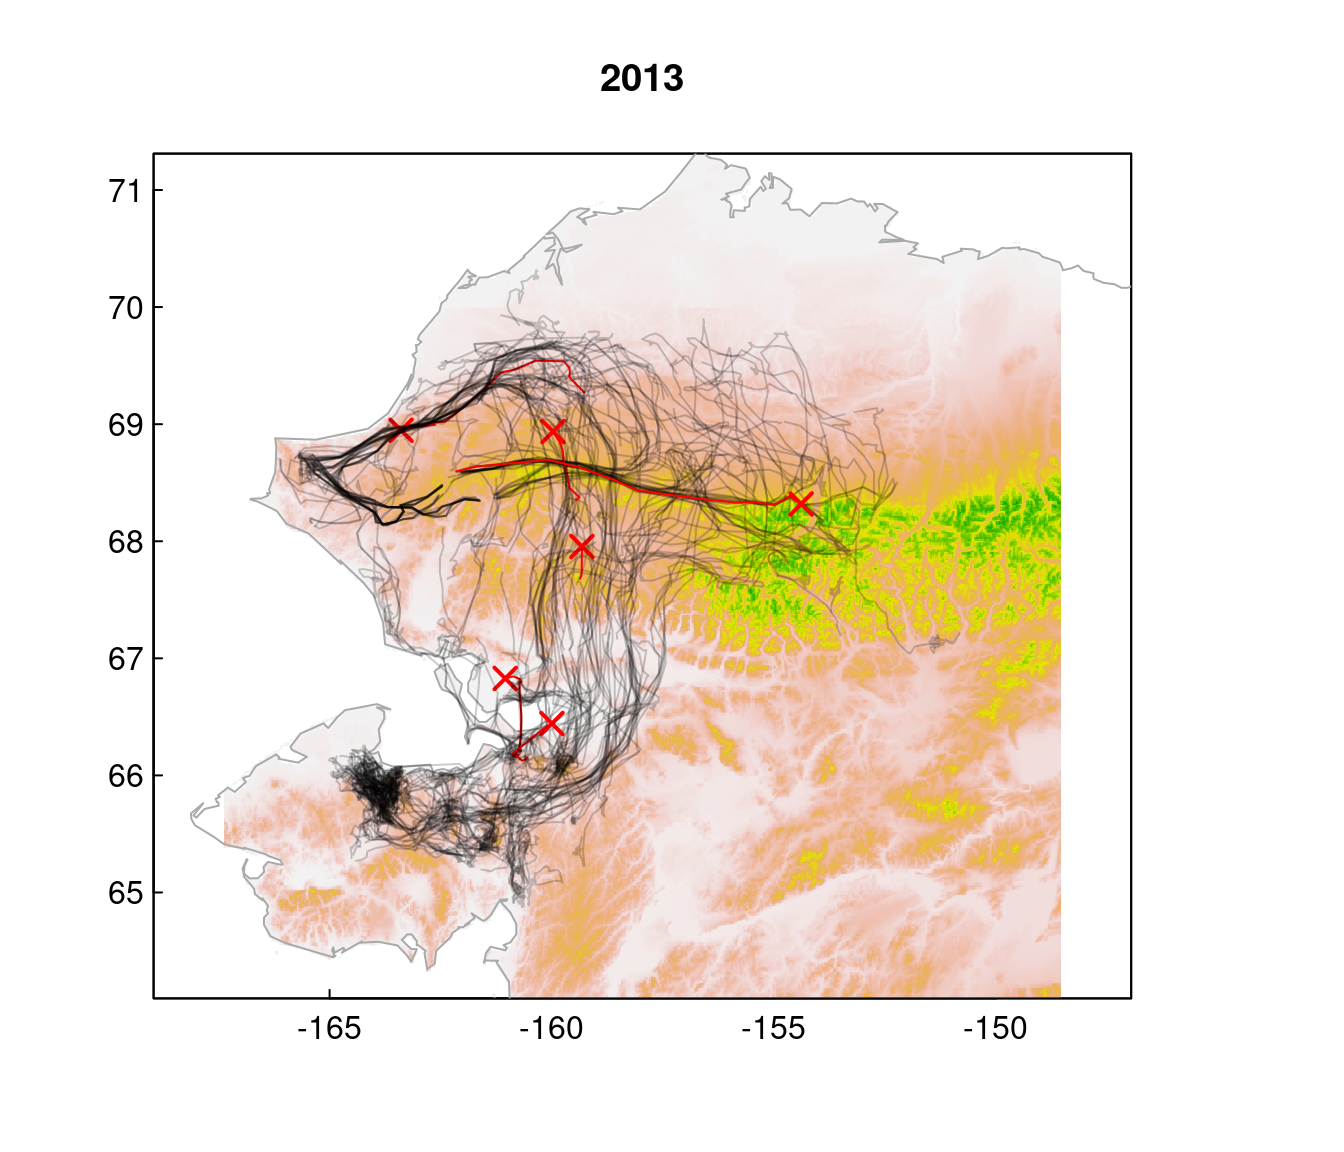
| ID | deathDate | Lon.mort | Lat.mort | deathSeason.year |
|---|---|---|---|---|
| 0967 | 2013-05-11 | -161.0457 | 66.82789 | 2013 |
| 1206 | 2013-06-17 | -159.9915 | 66.43899 | 2013 |
| 1207 | 2013-06-18 | -159.3195 | 67.95487 | 2013 |
| 1201 | 2013-06-22 | -159.9703 | 68.93681 | 2013 |
| 0974 | 2013-07-02 | -163.3911 | 68.94764 | 2013 |
| 1212 | 2013-07-28 | -154.3344 | 68.31328 | 2013 |
2014
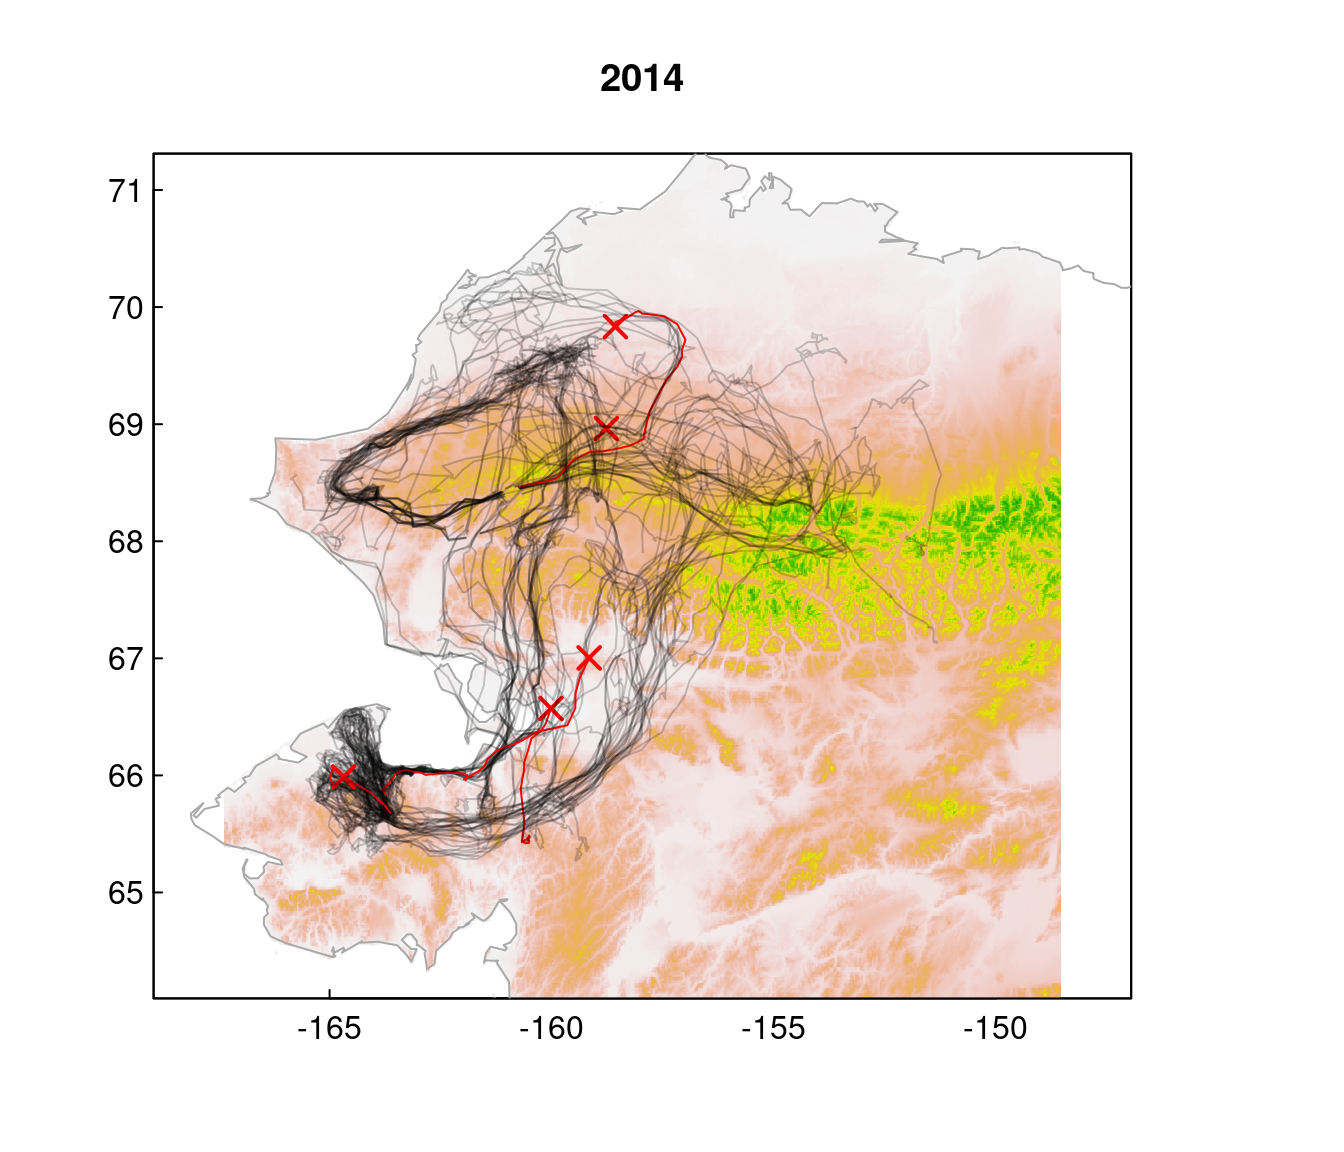
| ID | deathDate | Lon.mort | Lat.mort | deathSeason.year |
|---|---|---|---|---|
| 1024 | 2014-04-25 | -160.0294 | 66.57731 | 2014 |
| 1305 | 2014-05-09 | -159.1366 | 67.01280 | 2014 |
| 0960 | 2014-06-01 | -158.7804 | 68.96013 | 2014 |
| 1301 | 2014-08-19 | -158.5643 | 69.83340 | 2014 |
| 1403 | 2014-12-30 | -164.6717 | 65.99394 | 2014 |
2015
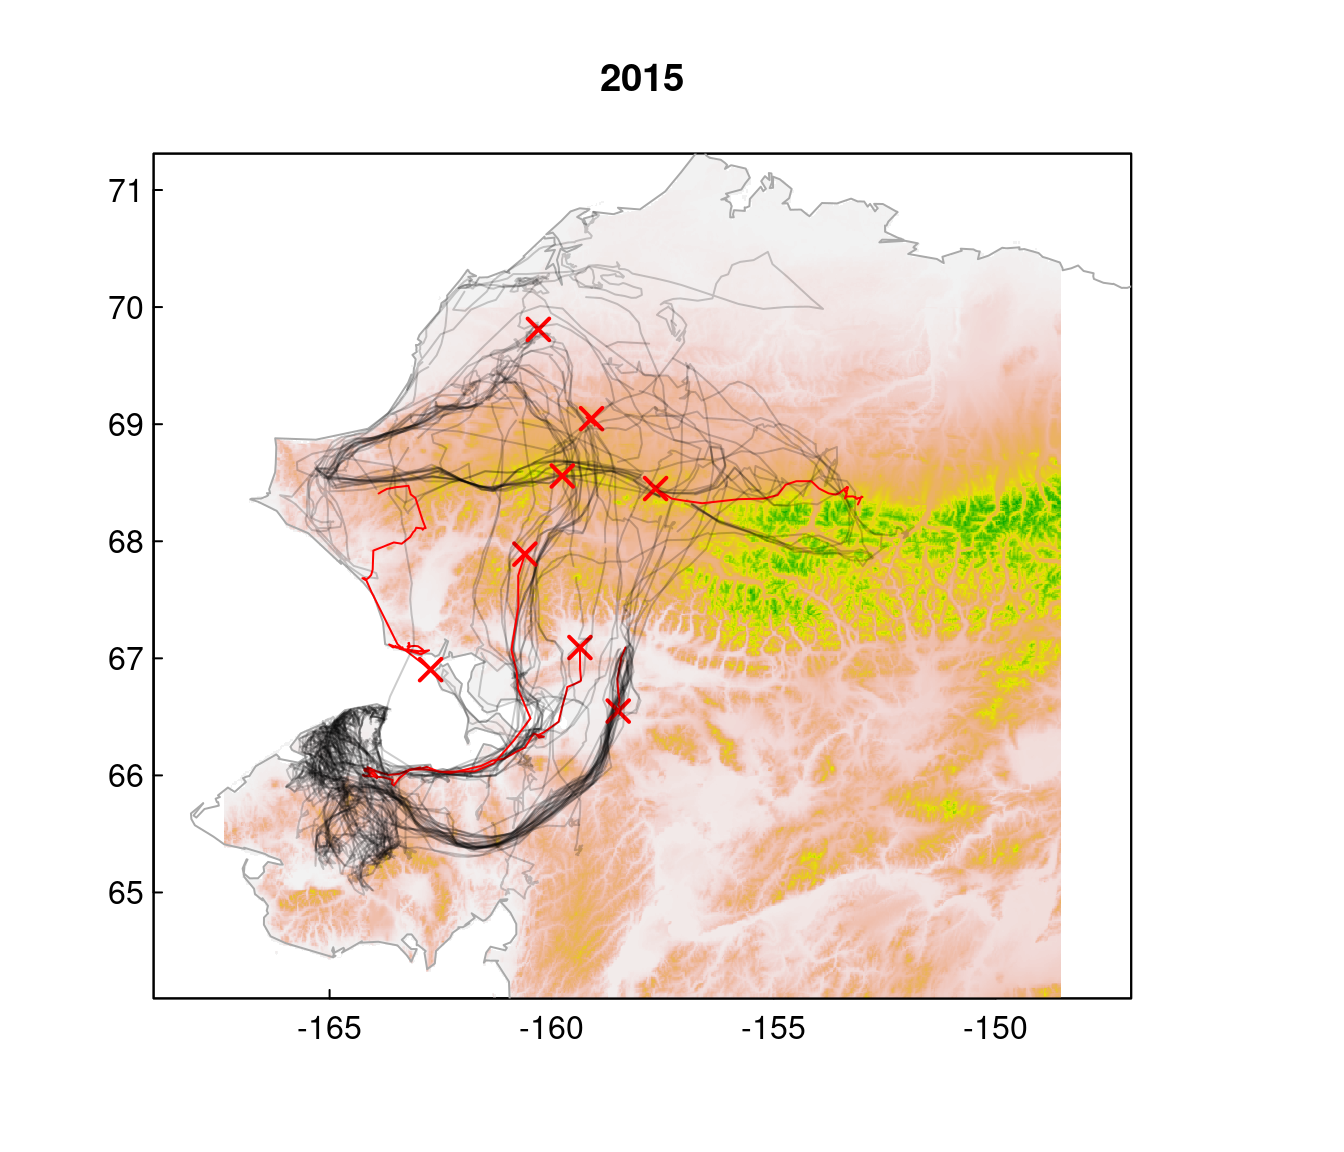
| ID | deathDate | Lon.mort | Lat.mort | deathSeason.year |
|---|---|---|---|---|
| 1308 | 2015-05-11 | -160.6029 | 67.88993 | 2015 |
| 1303 | 2015-05-12 | -157.7442 | 68.46204 | 2015 |
| 1211 | 2015-05-16 | -159.3626 | 67.11158 | 2015 |
| 1304 | 2015-06-17 | -160.2892 | 69.81105 | 2015 |
| 1306 | 2015-07-01 | -159.1043 | 69.04624 | 2015 |
| 1405 | 2015-07-25 | -159.7633 | 68.55646 | 2015 |
| 1512 | 2015-10-05 | -158.5019 | 66.54929 | 2015 |
| 1402 | 2015-11-12 | -162.7261 | 66.90316 | 2015 |
2016
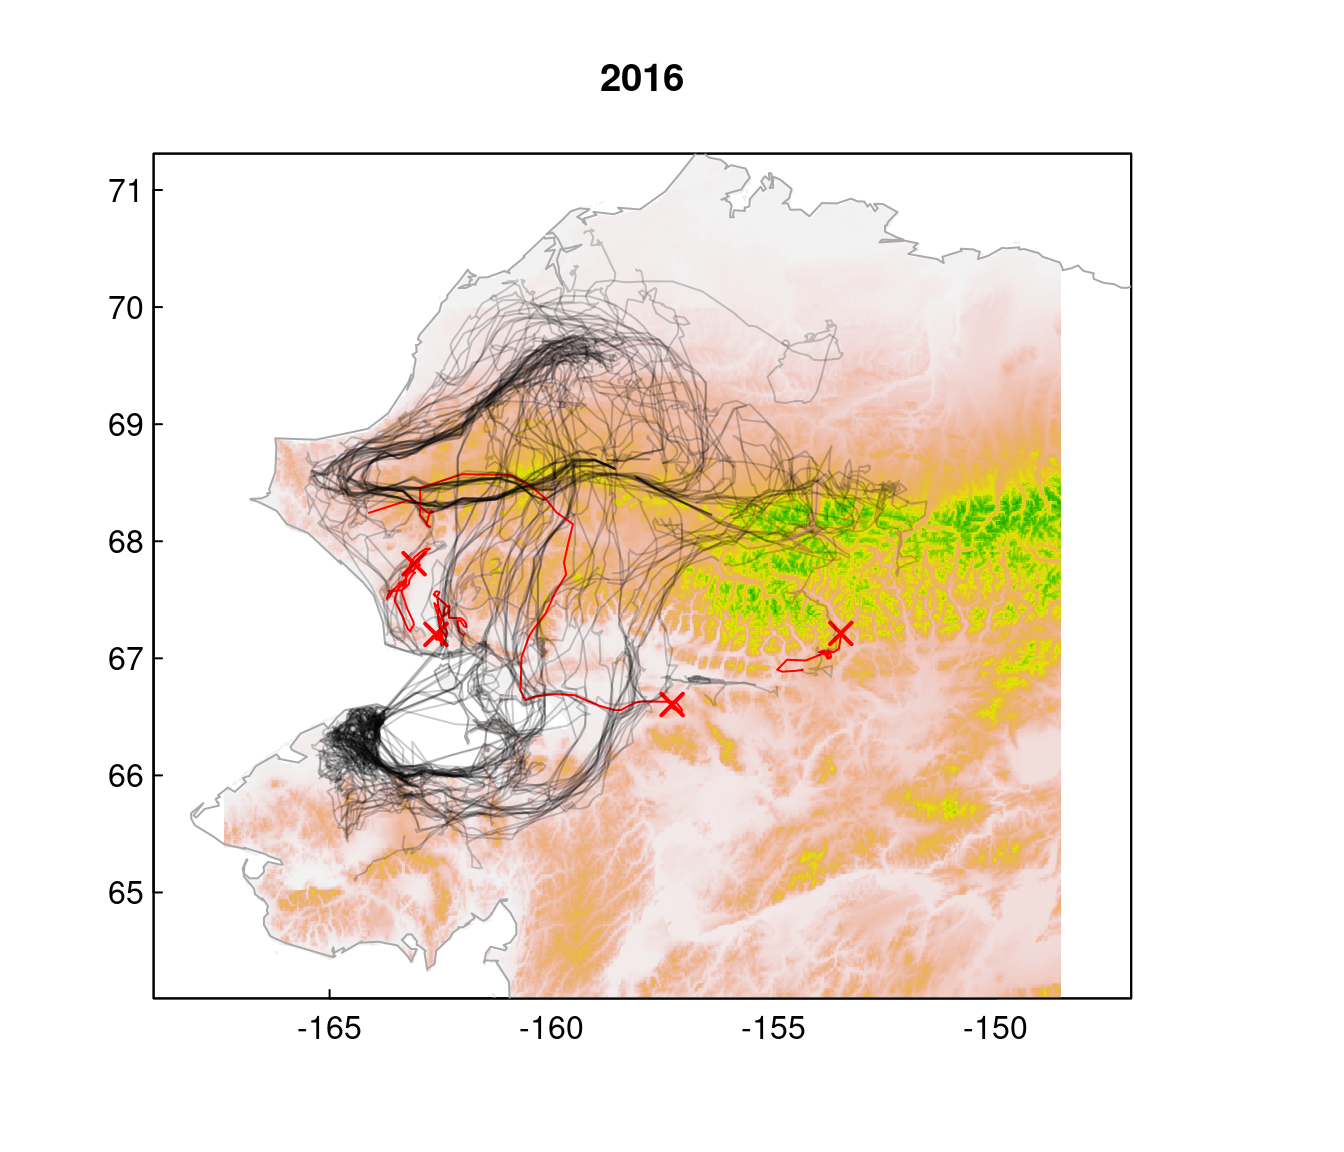
| ID | deathDate | Lon.mort | Lat.mort | deathSeason.year |
|---|---|---|---|---|
| 1502 | 2016-10-26 | -157.2885 | 66.60500 | 2016 |
| 1504 | 2017-01-10 | -153.4918 | 67.21234 | 2016 |
| 1522 | 2017-03-18 | -163.0967 | 67.80822 | 2016 |
| 1307 | 2017-03-27 | -162.6059 | 67.20423 | 2016 |
2017
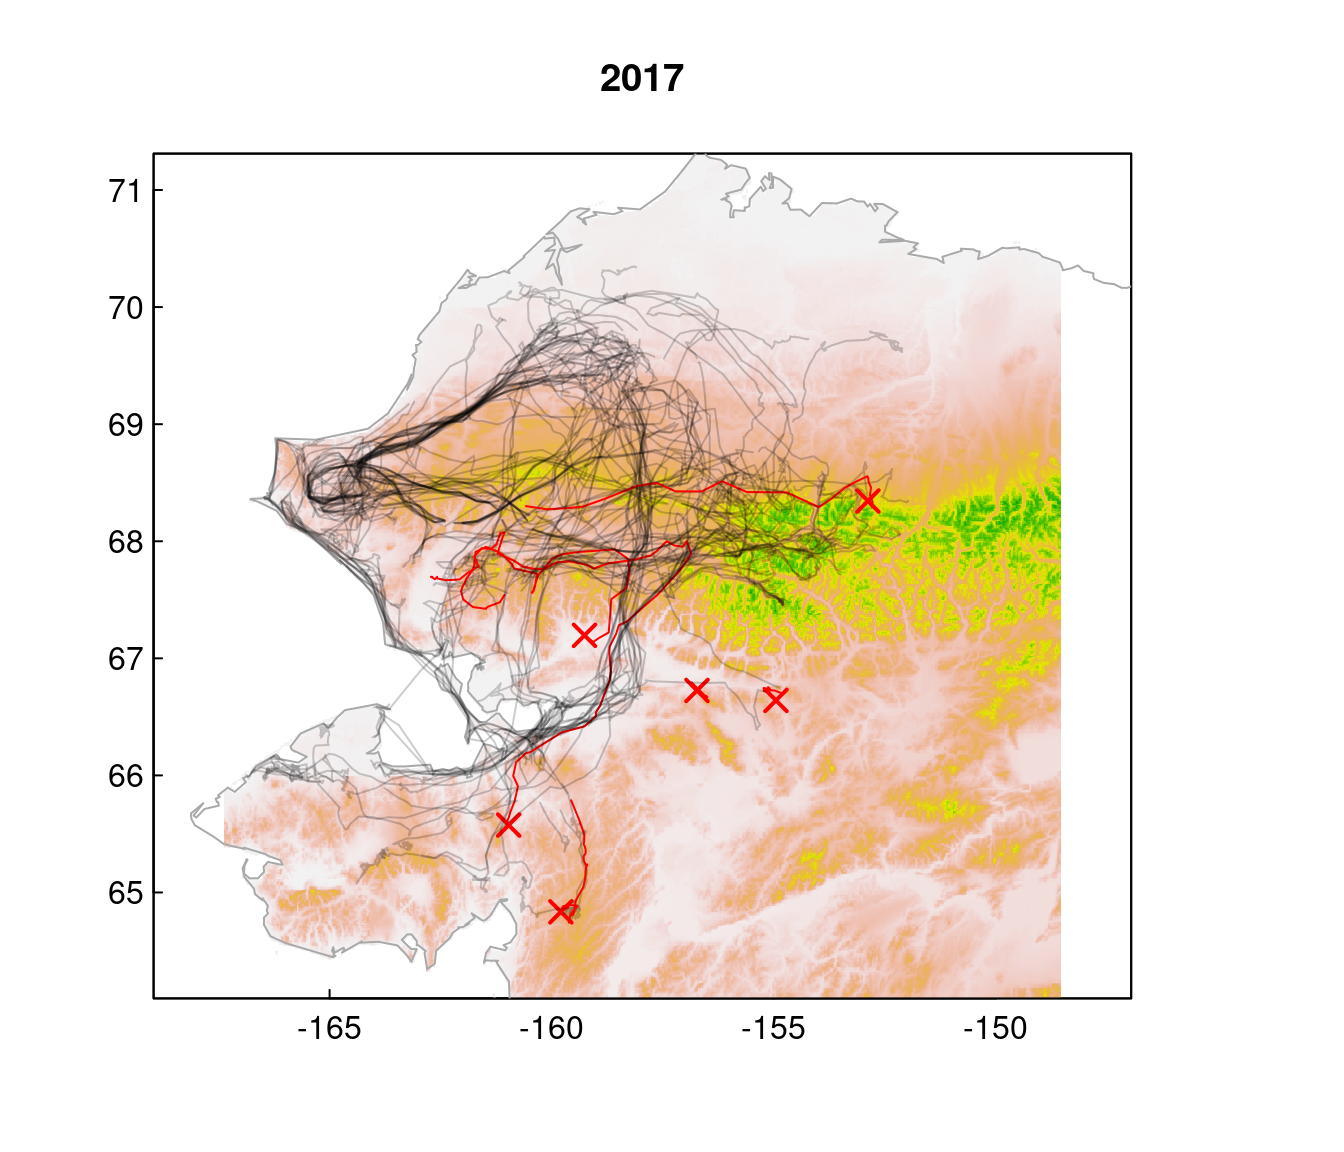
| ID | deathDate | Lon.mort | Lat.mort | deathSeason.year |
|---|---|---|---|---|
| 1309 | 2017-04-27 | -156.7283 | 66.72523 | 2017 |
| 1518 | 2017-08-14 | -152.8803 | 68.34366 | 2017 |
| 1507 | 2017-10-22 | -159.2641 | 67.19680 | 2017 |
| 1510 | 2017-11-16 | -160.9678 | 65.57534 | 2017 |
| 1517 | 2018-01-08 | -154.9662 | 66.63033 | 2017 |
| 1521 | 2018-01-26 | -159.7932 | 64.83440 | 2017 |
2018
| ID | deathDate | Lon.mort | Lat.mort | deathSeason.year |
|---|---|---|---|---|