![[Man versus machine]](software/man-machine.gif)
|
|
| |
|
|
|
Table 1. Summary of Strengths and Weaknesses -- Man versus Machine
The handout describes the process of problem solving with computers. This requires an ability to analyze a problem, outline the problem requirements, and design step-by-step algorithms that can be solved in a finite amount of time. It also requires an appreciation of the complementary strengths of man and machine, and an ability to formulate models that lend themselves to implementation on computers.
History indicates that large-scale engineering systems can be created without computers (e.g., Great Wall of China; Pyramids of Giza in Egypt; Golden Gate Bridge).
What computers and computer software bring to the table is an ability to design and efficiently implement systems that have
To participate in these cutting-edge developments, you'll need to be a skilled problem solver, and have a good knowledge of computers and computer technologies.
Man and Machine
This process is facilitated by the complementary strengths and weaknesses of man and machine:
![[Man versus machine]](software/man-machine.gif)
|
|
| |
|
|
|
Table 1. Summary of Strengths and Weaknesses -- Man versus Machine
Therefore, a good "problem solving strategy" is to let engineers + computers do what they are best at. This:
For this strategy to work, need to describe to the computer solution procedures in a manner that is completely unambiguous (i.e., we will need to look at data, organization and manipulation of data, and formal languages).
Users versus Developers
Engineers tend to have two types of relationships with with computers:
Perhaps you will simply supply the problem data, push a button, and get the result? This approach suffices for the solution of main-stream, mature, engineering problems.
If present-day software does not do what you want, or perhaps you are working in a problem domain that is new and innovative, then knowledge of software design will allow you to fill that gap.
For the most part, we are all computer users.
Far fewer engineers are also competent software developers.
Expectations of Computing
The world is not a static entity -- every day the world gets a little bit smaller, a little bit flatter, and a little bit smarter.
In many aspects of life, if you want to see where you are heading, then often it is a good idea to see where we have come from....
| Characteristics | Stage 1 Mechanical Era |
Stage 2 Electrical Era |
Stage 3 Information Era |
| Economic Focus | Agriculture and Mining | Manufacturing and Construction | Services |
| Productivity Focus | Farming | Factory | Information |
| Underlying Technologies | Mechanical Tools | Electromechanical Machines | Information and Communication |
| Product Lifecycle | Decades | Years | Months |
| Human Contribution | Muscle Power | Muscle Power and Brain Power | Brain Power |
| Living Standard | Subsistence | Quality of Goods | Quality of Life |
| Geographical Impact | Family Locale |
Regional National |
Global |
| Onset in the U.S. | Late 1700s. | Late 1800s. | Late 1900s. |
Table 2. Stages in a nation's economic evolution.
(Adapted from Tien, 2003).
After spending two centuries figuring out how to create mechanical and electrical machines, we are now on the cusp of an information era, where delivery of information services are enabled by a world that is:
Examples of these trends abound (IBM, 2009):
We now have the ability to measure, sense, and see the exact condition of almost everything. Consider:
By the end of 2010 there will be 1 billion trasistors per human;
By the end of 2010 there will be 30 billion RFID (radio frequency id) tags;
Due to transformational advances in (wireless) communications technology, people, systems and objects can communicate and interact with each other in entirely new ways. Consider:
We are heading toward one trillion connected objects -- comprising the Internet of Things.
In 2007, worldwide mobile phone subscriptions reached 3.3 billion -- one for every two people on the planet.
By 2011 approximately 1/3 of the world's population (approximately 2 billion) will be on the web.
More intelligent behavior means an ability to respond to changes quickly, accurately and securely, predicting and optimizing for future events. Enablers include:
Hundreds of satellites in orbit -- collecting and generating terabytes of data every day.
15 petabyes of data are generated daily. This is eight times more than the information in US libraries.
In 2008 64 billion credit card transactions were processed (up 35 per cent from 2007).
Moving forward, our expectations of computing simply expand. Advances in hardware/software enable:
The latter provide:
Observation
Hindsight indicates that it takes about one decade for a major advance in computing to occur. Today, we expect computers to support all activities, from numerical computations to social networking.
| Capability | 1970s | 1980s | 1990s | 2000-present | 2020-2030 |
| Users: | specialists | individuals | groups of people | groups of people, sensors, computers |
integration of cyber and physical worlds |
| Usage: | numerical computations | desktop publishing | e-mail, web, file transfer | mobile computing, control of physical systems, social networking (e.g., facebook) |
embedded real-time control of physical systems (e.g., programmable contact lenses, augmented cognition). Movement toward ubiquitous computing systems. |
| Interaction: | type at keyboard | graphical screen and mouse | audio/voice | touch/multi-touch proximity, orientation and motion sensors |
... |
| Languages: | Fortran | C, C++, MATLAB | HTML, Java | XML, RDF, OWL | New languages to support time-precise computations. |
Table 3. Stages in the evolution of computing capability.
Economics and Mobility
In the early 1970s,
Nowadays, development and maintenance of software typically consumes more than 80% of the total project costs.
![[Software Development]](software/software-development1.gif)
Figure 1. Economics of Systems Development and Integration
This change in economics is the combined result of falling hardware costs, and increased software development budgets.
Here are a few examples of these trends ...
Example 1
In a modern automobile, the electronics and communication systems
now account for 30% of the overall cost (W. Reitzle, BMW, 2000).
![[Car electronics]](software/car-information.jpg)
Figure 2. Electronics and Communications in a Modern Car.
(Source: A.S. Sangiovanni-Vincentelli, EE 249, UC Berkeley, Fall 2002.)
These electronics and communications systems provide drivers with functionality that would not be possible without an ability to gather and work with data/information. For example, electronic and automatic control systems improve the rider comfort, reliability, stability, and fuel efficiency of the automobile. GPS systems coupled with real-time traffic management systems can provide drivers with directions that will avoid congestion, traffic accidents, ... and so forth.
Example 2.
Access to computing becomes more mobile ....
![[Apple1]](software/apple-mac1.gif)
|
![[Apple2]](software/apple-mac2.jpg)
|
| 2005-2006 | 2007-2008 |
Figure 3. Access to Computing becomes more Mobile
Example 3.
Here are two applications of touch technology.
![[Touch Interfaces]](software/touch-interfaces.jpeg)
Figure 4. Touch interfaces. Left: Microsoft Playtable, Right: Apple iPhone.
Hitachi has just released a giant multi-touch interface.
See the demo on youtube .
A good engineering design balances the need for functionality and performance against limitations on cost.
The systematic consideration of these concerns in engineering systems design is becoming increasingly complex because of demands to expand system functionality and improve performance while keeping costs in check.
An analysis of industrial-age applications reveals that in many cases, constraints on system functionality and performance can be attributed to limitations in our ability to:
Many present-day (so-called industrial-age) systems rely on human involvement as a means for sensing and controlling behavior, e.g.,
But as already noted, humans are slow. They also easily tire. Information-age systems are developed under the premise that advances in computer, sensing, and wireless networking technologies allow for relaxation (or even removal) of the aforementioned constraints. The result is new types of systems where human involvement is replaced by automation, e.g.,
This change in strategy increases the role of sensing, computing and control in engineering, and the need to handle and work with large quantities of data.
Physical Systems versus Computational Systems
Many modern civil engineering systems are a combination of physical and computational systems.
Physical Systems
Computational Systems
Embedded computers and networks monitor and control physical processes in feedback loops where physical processes affect computations, and computations affect physical processes. During the past decade these embedded computers have become networked, which has opened the door to a whole new array of services.
Example 4.
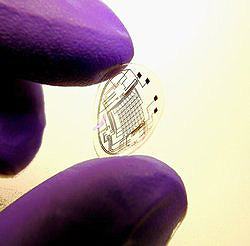
Here is an example of the integration of computation with physical media -- i.e., the programmable contact lens
|
Engineers at the University of Washington have for the first time used manufacturing techniques at microscopic scales to combine a flexible, biologically safe contact lens with an imprinted electronic circuit and lights.
Looking through a completed lens, you would see
what the display is generating superimposed on the world outside.
Virtual displays for practical purposes --
visual aids to help vision-impaired people,
holographic driving control panels
and even as a way to surf the Web on the go. |
|
Table 4. Programmable Contact Lenses
Example 5. Programmable Building Skins/Cybertecture
|
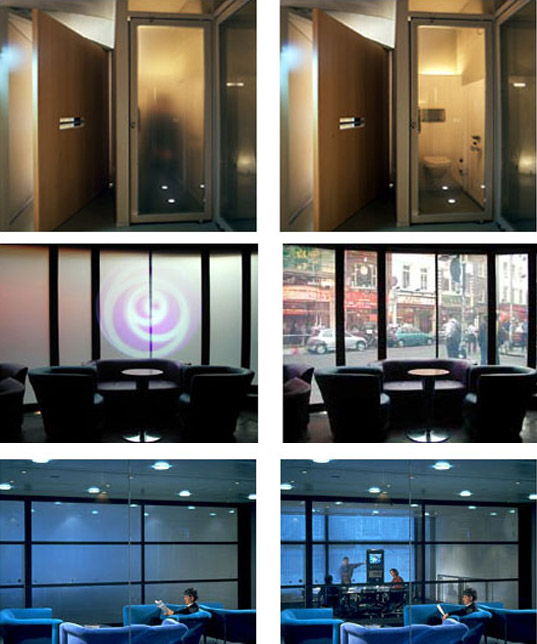
Building facade designs offer the greates opportunity for savings in building system energy consumption. Multi-functional facades provide:
|
|
Table 5. Framework for development of programmable building skins.
|
Present-day technology.... Thermo-chromatic materials changes their optical properties when a change in the temperature changes. Mostly the materials are liquids and some are gel like substances that sit between the layers of the glazing. Thin-Film Electrochromics Thin-film electrochromics has been seen as a possible way to make "smart windows" -- windows with an electrochromic (EC) coating that can electronically control the flow of solar light and heat in response to changing outdoor conditions. On hot, sunny days the tint in the windows would darken to reduce glare and block out heat. On cold, cloudy days the windows would clear to allow sunlight and heat to fill the office or home. In addition to reducing energy requirements, the electric shading of smart windows may eliminate or reduce the need for expensive blinds or curtains. Application .. Luxury hotels -- four seasons. |
|
Table 6. Programmable electro-chemical window elements.
From Data to Information and Knowledge
The pathway from data to information to knowledge can be visualized as follows:
![[System Interpretation 3]](software/system-interpretation3.gif)
Figure 5. Pathway from Data to Information to Knowledge.
Points to note:
Dealing with this trend requires attention to:
In many cases the software isn't even visible to the outside users (i.e., increased use of so-called ubiquitous computing).
Remark. In a classical sense, information is a noun that means "knowledge communicated" or received concerning a particular fact or circumstances. In other words,
Information is valuable because it resolves uncertainty -- and the less predicable a message is, the more information it conveys! Conversely, if somebody sends you a message that does not further your knowledge with respect to an event or circumstance, then from your perspective, the message does not contain information.
Within Civil Engineering, the trend from industrial- to information-age systems is gaining traction in the use of sensors to improve the functionality and performance of large-scale infrastructure systems. Applications include:
Example 5. Panama Canal Upgrade
Early Days of the Panama Canal
Present-Day Panama Canal
![[Panama Canal: Fig. 1]](software/Panama-Collage1.gif)
Figure 6. Collage of ship activity in the Panama Canal.
(Left-hand graphic shows transiting ships crowding Miraflores Locks and Lake;
Right-hand graphic illustrates of limitations of present-day canal capacity).
Panama Canal Rennovations
![[Panama Canal: Fig. 1]](software/Panama-Collage2.gif)
Figure 7. Cross Section of new Canal System
Role of Information-Age Technology
Example 6. Health Monitorting of Buildings/Bridges
Motivation
The I-35W Mississippi River bridge was steel truss arch bridge that spanned the Mississippi River in Minneapolis, Minnesota. It had eight-lanes and was 1,907 feet in length.
![[Bridge Collapse]](software/bridge-collapse2007.jpg)
Figure 8. Collapsed I35 W. Mississippi Bridge
Source: http://en.wikipedia.org/wiki/I-35W_Mississippi_River_Bridge
The bridge collapsed at 6:05pm on August 1, 2007 during rush hour. Thirteen people died and 100 people injured as a result of the collapse.
Lessons learned from the post-failure evaluation include:
Jan 16, 2008 update.
The National Transportation Safety Board (NTSB) today announced that a
serious design flaw was found in some of the gusset plates on the I-35W bridge.
As a result, the NTSB issued a recommendation that the Federal
Highway Administration (FHwA) require bridge owners to verify that
the stress levels in all structural elements, including gusset plates,
remain within applicable requirements whenever planned modifications
or operational changes may significantly increase stresses.
This would apply to all non-load-path-redundant steel truss bridges
within the National Bridge Inventory.
Framework for Health Monitoring of Bridge Components
![[Bridge Monitoring]](software/bridge-monitoring.jpg)
Figure 9. Composite Marine Pile Bridge Monitoring
Role of Technology in Health Monitoring of Bridges
Example 7. Building-Integrated Energy Systems
Standard models of building construction rely on "centrally produced" power as a source of high-grade energy (i.e., energy that can be readily converted into work).
Advances in technology have opened the door to electrical energy displacements -- that is, reducing the costs of energy consumption through replacement of power produced locally.
Examples of building-integrated energy systems:
For the environment, the use of sensor systems in buildings implies an efficient management of resources. Demand for energy consumption is generally reduced through the use of insulating materials in the building structure.
The use of sensor systems, in contrast, allow for...
Analysis requires an electrical modeling capability with coupled thermal and electrical energy flows (Kelly, 1998).
|
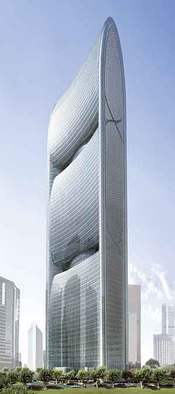
Importance of this Problem Commercial buildings account for 18% of energy consumption in the US. Skidmore-Owings-Merrill Design The Pearl River Tower epitomizes the super tall corporate headquarters building of tomorrow as an iconic, high performance structure, that is designed so that it potentially produces as much energy as it consumes. The building's form guides wind to a pair of openings at its mechanical floors. The winds drive turbines that generate energy for the building's heating, ventilation and air conditioning systems. The openings also provide structural relief, by allowing wind to pass through the building instead of pressing against it. Present-Day Mechanisms Orientation, conservation, lighting efficiency, geothermal, energy reuse and energy storage techniques are used to enable the building to generate enough renewable power to meet its energy demands. Cyber-Physical Mechanisms But even further improvements in efficiency would be possible if we could monitor the inhabitants and their activities. |
|
Table 7. Architectural design of Pearl River Tower, a futuristic net-zero energy building.
|
Mumbai's Cybertecture Egg The oblong office building incorporates passive solar design to decrease heat gain and lower energy loads. An elevated garden also moderates temperate by using natural vegetation to assist with cooling the building envelope. The Cybertecture Egg will use solar photovoltaic panels and rooftop wind turbines to generate onsite electricity. Water conservation will be managed with a greywater recycling system that will harvest water for irrigation and landscaping. |

|
Table 8. Framework for development of programmable building skins.
Complex engineering systems are becoming increasing reliant on:
Satisfying this criterion is complicated by the fact that a small fault in the software implementation can trigger (or result in) system-level failures that are very costly and, sometimes, even catastrophic.
A few famous examples include (see http://infotech.fanshawec.on.ca/gsantor/Computing/FamousBugs.htm):
|
Example 1. Ariane 5, 1996
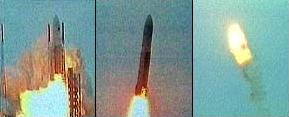
The Ariane 5 rocket exploded on its maiden flight in June 1996 because the navigation package was inherited from the Ariane 4 without proper testing. The new rocket flew faster, resulting in larger values of some variables in the navigation software. Shortly after launch, an attempt to convert a 64-bit floating-point number into a 16-bit integer generated an overflow. The error was caught, but the code that caught it elected to shut down the subsystem. The rocket veered off course and exploded. |
|
|
Example 2. Power Shutdown of the USS Yorktown
A crew member of the guided-missile cruiser USS Yorktown mistakenly entered a zero for a data value, which resulted in a division by zero. The error cascaded and eventually shut down the ship's propulsion system. The ship was dead in the water for several hours because a program didn't check for valid input (Reported in Scientific American, November 1998). |
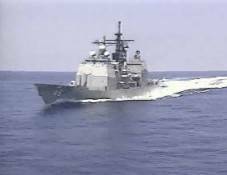
|
|
Example 3. Denver Airport Baggage Handling System
1995
2005 |
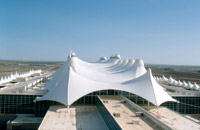
|
|
Example 4. Mars Climate Orbiter, September 1999
The 125 million dollar Mars Climate Orbiter is assumed lost by officials at NASA. The failure responsible for loss of the orbiter is attributed to a failure of NASA's system engineer process. The process did not specify the system of measurement to be used on the project. As a result, one of the development teams used Imperial measurement while the other used the metric system of measurement. When parameters from one module were passed to another during orbit navigation correct, no conversion was performed, resulting in the loss of the craft. |
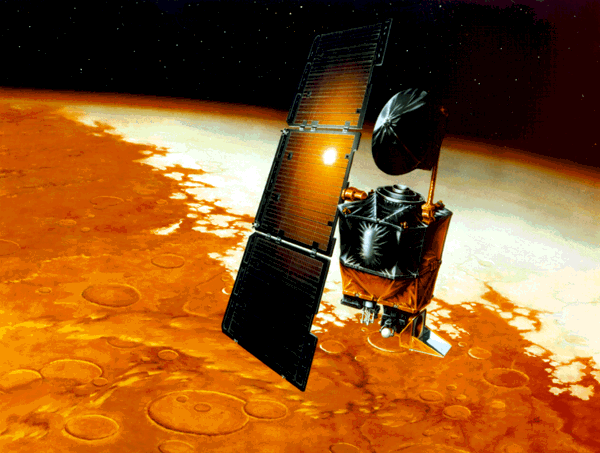
|
Table 9. Famous System Failures caused by Buggy Software.
Later in this course we will see that many software errors can be avoided through the use of formal models of requirements and the engineering system, coupled with rigorous procedures for checking software systems for faults.
A Few Key Points ...
Advances in computer science and communications technology:
But when technologies are weaved together to achieve new levels of system functionality,...
To complicate matters,
Thus, in order for design of information-age systems to be correct, we need design methodologies that use formal approaches to modeling, strategic in their evaluation of system performance.
Practical Considerations
To complicate matters, of all the classes that you will take in Civil Engineering, none will have material with a shorter half-life than this one.
Hence, for the purposes of a class like ENCE 200 we should ...
Step-by-Step Procedure
A high-level procedure for solution of problems with computers can be visualized as follows:
![[Solution Procedure1]](software/solution-procedure1.gif)
Figure 10. High-level Procedure for Solution of Problems with Computers.
The four stages of development each require attention:
This early stage of development is part science and part art.
Often this translation involves the development of models that are focused on a specific system viewpoint (e.g., system behavior, system structure). The result might be families of objects making up the system, or it might be families of equations that describe system behavior. Algorithms are step-by-step procedures for understanding some aspect of the system under study (e.g., system behavior might be defined by the solution to a differential equation).
To the extent possible, you should validate your algorithm on a small example (possibly a hand calculation) before getting getting into the details of actually implementing your solution procedure on a computer.
A development error will when the user-defined source code does not match the rules of the underlying computer language.
Ingredients of an Algorithm
The essential ingredients of an algorithm are as follows:
When an algorithm is initiated with sensible data, then it should terminate/finish in a sensible way.
Computer Programming
Computer programming is all about ...
As we will soon see the translation of a real-world algorithm into a set of computer-compatible instructions can be a complex process. Hence, we also need ....
Flowchart and Pseudocode Representations
A flowchart is simply a graphical representation of the steps in an algorithm, e.g.,
![[Algorithm1]](software/algorithm-part1.gif)
Figure 11. Sequence of Steps in an Algorithm.
The textual/pseudocode counterpart to Figure 11 is:
    Starting Point
       Step 1.
       Step 2.
       Step 3.
       ......
       Step N.
    Finishing Point
The "starting point" of an algorithm may require that pre-conditions be satisfied (e.g., availablity of data). Often the "finishing point" of an algorithm will be defined by the generation of textual and/or graphical output.
Support for Decision Making
![[Algorithm2]](software/algorithm-part2.gif)
Figure 12. Flowchart for Basic Decision Making
Support for Repetitive Operations
![[Algorithm3]](software/algorithm-part3.gif)
Figure 13. Flowchart for Repetitive Operations
Flows of Data/Information in General Computer Programs
It is convenient to think of Figures 11 trough 13 as templates for problem solving.
General purpose programming languages allow the programmer to customize a problem solving procedure by mixing-and-matching these basic problem-solving templates.
Computer Program Source Code
When you write the source code for a computer program, in essence, all that you are doing is using text to fill-in the details of programming templates. While the basic problem solving strategy will be language-independent, the syntax details will vary from one language to another, e.g.,
    Branching Construct in Java                 Branching Construct in Matlab
    =========================================================================

    if ( i < 3 ) {                              if i < 3,
      .... do something ....                       .... do something ....
    } else {                                    else
      .... do something else ....                  .... do something else ....
    }                                           end;

    =========================================================================
In both cases, if the fragment of code "i < 3" evaluates to true, then we will "do something ...". Otherwise, we will "do something else...".
Prevalent Computer Languages
In each of these examples, algorithms (or strategies) for completing tasks need to be translated into sequences of instructions a computer can understand.
And ...
Because computer languages need to be precise statements for what needs to be computed, languages tend to have a small syntax, and are generally designed to facilitate the solution of a well-defined class of problems. As a result, one general-purpose language does not exist. Instead, new languages are developed to serve the needs of new expectations from computing.
High and Low-Level Languages
Low-Level Languages
In the earliest days of computing, low-level languages were all that was avaialable.
High-Level Languages
Compiled versus Interpreted
There are two main mechanisms for the implementation of programming languages: compiled and interpreted.
Compiled Code
![[Compiled Code]](software/code-compiled-fig1.gif)
Figure 14. Pathway of compilation for compiled code.
High-level programming constructs (e.g., evaluation of logical expressions, loops, and functions) are translated into equivalent low-level constructs that a machine can work with.
Interpreted Code
Compiled Code versus Interpreted Code
Code that is both Compiled and Interpreted
![[Interpreted Code]](software/code-interpreted-fig1.gif)
Figure 15. Pathway of compilation for compiled code.
Figure 16 shows a framework for general-purpose modeling and creation of structure and behavior models for engineering applications.
![[Model]](software/model-development1.gif)
Figure 16. Process for Simplified Development of Engineering Models
Key points:
Abstraction means that we concentrate on the essential features of one part/module of the engineering problem, and abstract from details of the engineering system that are not immediately relevant to the current module.
For our purposes, abstraction replaces the real world system with a similar but simpler-to-understand model (e.g., visual/graphical description; analytical/mathematical description). This, in turn, can reduce the difficulty in working through the essential steps for completing a task.
A fundamental consideration is validating (or ensuring) that the model represents the real system to a certain degree of accuracy.
The closed loop of one-way arrows indicates that several iterations of abstraction and validation may be required. Without validation, results of the modeling may amount to little more than educated guesswork!
| Modeling Ingredient | |
| Subject | A model must have a well-defined subject. |
| Viewpoint | A model should be based on a point of view (i.e., frame of reference) that can guide identification of the relevant issues and information. |
| Representation |
A modeling technique must have a means to express a particular model.
Examples include:
|
| Technique | Model formulation is part science and part art. Technique matters. Sometimes the formulation of the model can be guided (and constrained) by relevant mathematical and physical theories. |
Table 10. Basic Ingredients in a Model
A good representation allows the system model to be conveniently stored, accessed, and manipulated. It should allow for the easy communication of infomation among team members.
A model of the environment will help to define what functions the system may need to provide. It may also place constraints (e.g., physical constraints) on the system itself.
For example, the dynamic behavior of a building shaking during an earthquake is constrained to follow conservation laws (e.g., balance of forces, conservation of energy). The flow of water through a canal needs to satisfy conservation of momentum. The application of these principles leads to "continuous system behavior" defined by ordinary or partial differential equations.
Computers, on the other hand, are inherently discrete. Thus approxmations will be needed for number storage, and evolution of system behavior in both space and time.
Numerical analysis is the study of algorithms that can find the efficient and accurate solution to numerical problems. We will come back to this topic in ENCE 201.
Transformational and Reactive Systems
Systems can be classified as being either transformational or event-hased. In the transformational definition, a system is a function that receives one or more system inputs I from an external environment, transforms them with process T , and then releases them as system outputs O to an external environment. This input-output (I/O) relationship can be expressed symbolically as
See Figure 17.
![[Studying a system]](software/system-basics2.gif)
Figure 17. A Transformational System
subject to appropriate external mechanisms and controls. A transformational system generates an output and then terminates.
A reactive system is a system that, when turned on, is able to create desired effects in its environment by enabling, enforcing, or preventing events in the environment.
![[System Reactive 1]](software/system-reactive1.gif)
Figure 18. Elements of a Reactive System
Reactive systems typically exist to collaborate or interact with some entity or entities in the environment (e.g., traffic controllers; process control). They never have all of their inputs ready -- rather, the inputs arrive in endless and perhaps unexpected sequences.
Formal Models of Development
An engineering model for analysis or design is said to be formal if it has semantics that are precise and unambiguous. That is, each term in the model/design has a well defined meaning. Tranformations among model/design representations will also be well defined.
Such models will be assembled from the following components:
Separation of Concerns
Complex systems are characterized by many components, concurrent subsystem level behaviors, and complicated communications and interactions among subsystems and components.
To facilitate understanding of these design issues/concerns, we aim to pull a design apart and examine it from perspectives (or "facets" or viewpoints) that are almost orthogonal, thereby factoring out so-called cross-cutting concerns (see details below). Achieving (almost) orthogonality of concerns is important because it means we can explore options in one viewpoint (or dimension of design) without affecting other concerns.
Figure 19 shows, for example, a simple design consisting of two communicating subsystems.
![[End-to-end Development]](software/system-design-concerns1.gif)
Figure 19. Separation of Design Concerns: Structure, Behavior, Communication
The task of understanding and evaluating a design (i.e., what it does, how it works, how it can be changed to improve performance) is simplified through the separate consideration of concerns:
    Understanding system Structure
    ========================================================================
      -- Objects
      -- Collections of objects
      -- Relationships among objects (e.g., decomposition of the system into
         hierarchies, connectivity of components/objects).
      -- Assignment of geometric properties (e.g., size, placement).
    ========================================================================
    Understanding system behavior
    ========================================================================
      -- Capture/identification of basic system functions.
      -- Ordering and decomposition of functions.
      -- Identification of control structures through system logic.
      -- Identification of states of behavior.
    ========================================================================
It is the ordering of these functions coupled with the system logic that produces the system behavior.
It is not hard to think of design applications where other types of concerns make sense (e.g., external environment vs system; connectivity).
Suppose that you have been given a quadratic equation:
q(x) = ax^2 + bx + c
with nonzero coefficents (a, b and c) and that you have been asked to find values of x for which
q(x) = 0
Types of Solutions
Plots of q(x) versus x illustrate the three types of solution that are possible:
![[Quadratic1]](software/quadratic-solutions.gif)
Figure 20. Types of Solution to a Quadratic Equation.
Algorithm. Step-by-step Solution Procedure
We need to devise an algorithm that is amenable to step-by-step solution on a computer. So here goes ... we are given that
q(x) = ax^2 + bx + c = 0,
Hence for nonzero "a",
q(x) = 4a(ax^2 + bx + c) = 0.
Completing the square gives:
q(x) = (2ax + b)*(2ax + b) - b*b + 4ac = 0.
The terms can be easily rearranged to give the two solutions that we all learned in high school, i.e.,
    Root: x_1 = (-b + sqrt(b*b - 4*a*c))/2a
    Root: x_2 = (-b - sqrt(b*b - 4*a*c))/2a
Flowchart for Solution Procedure
Figure 21 shows the essential steps in a flowchart for computing and printing the roots to a quadratic equation.
![[Quadratic2]](software/quadratic-flowchart.gif)
Figure 21. Flowchart for Step-by-Step Solution to a Quadratic Equation.
A few key point:
Performance Assessment
From a theoretical standpoint, these formulae are all that you need to compute roots x_1 and x_2.
From a practical standpoint, however, a computer implementation will allocate a finite amount of space (usually 4 or 8 bytes) for the storage of each coefficient (a, b and c). This is usually sufficient for the accurate evaluation of the root values.
However, when two numbers of almost equal value are subtracted we can generally expect a significant loss of accuracy in the numerical result.
Subtractive cancellation occurs in the computation of x_1 when b*b >> 4*a*c. To overcome this problem, multiply the numerator and denomiator by:
(-b - sqrt(b*b - 4*a*c)
Most Important Points ...
This problem is simple enough that a formula can be derived for roots to the quadratic equation. However, most engineering problems do not lend themselves to analytic solutions and we need to rely on numerical approximations to the real solutions.
     Input: Coefficients a, b and c.
    Output: Roots x_1 and x_2.
Figure 22 shows a scenario where a tennis ball is hit with velocity V and angle "theta" to the horizontal plane. The ball is launched at a distance "d" from a net of height "h".
![[Tennis1]](software/tennis-court-example1.gif)
Figure 22. A Tennis Ball Projectile that only just Clears the Net.
System Structure and Behavior
Performance Requirements
We also need to make sure that the ball doesn't go outside the court:
Outline of Solution
This problem can be solved in a number of ways, including trial and error. However, the best approach is to derive the equations of motion for the projectile behavior (it's pretty simple) and then constrain the projectile profile to match the boundary conditions (i.e., launch position and top of net).
Assumption: Ignore air resistance.
Horizontal behavior is defined by the equation:
d^2 x(t)/d^2 t = 0.0.
Integrating twice with respect to time t and inserting the boundary conditions gives:
x(t) = [ V cos (theta) ] t
Similarly, vertical behavior is defined by
d^2 y(t)/d^2 t = -g,
where g is acceleration due to gravity. Integrating twice with respect to time t and inserting the boundary condition for initial velocity gives:
y(t) = [ V sin (theta) ] t - [ g/2 ]*t*t
Now we apply the boundary condition "the ball just clears the net".
In mathematical terms, this means that a some undetermined time t',
    x(t') = [ V cos (theta) ] t' = d
    y(t') = [ V sin (theta) ] t' - [ g/2 ]*t'*t' = h
Plugging the first equation into the second and rearranging terms leads to a quadratic equation in tan (theta), i.e.,
A tan(theta)^2 + B tan (theta) + C = 0
where A, B, and C are symbolic expressions involving the problem parameters (h,d,g,V). Solutions to questions 1 and 2 are obtained through analysis of the quadratic equation roots.
Performance Assessment
Performance of the tennis ball trajectory is directly related to roots of the quadratic equation. Three cases exist:
Most Important Points ...
     Input: g, h, d, and V.
    Output: angles theta1 and theta2.
A computer implementation might also validate behavior by plotting the trajectory coordinates (x(t),y(t)).
iTunes (Windows and Mac OS X) is an easy-to-use software application for organization and execution of music files, videos, podcasts, and so forth. iTunes content can be synched with external devices such as the iPod, Apple TV, and iPhone.
Figure 23 is an annotated schematic for the iTunes graphical user interface.
![[iTunes1]](software/itunes-example1.gif)
Figure 23. iTunes Graphical User Interface
iTunes Object Model
iTunes stores its content (e.g., music files, video files) as a library of object. Each object is described by a set of attributes (e.g., name of the song, artist, genre, duration, date).
![[iTunes2]](software/itunes-music-file.gif)
Figure 24. Schematic of a Music File Object
Music objects can be sorted by attribute. For this to work, iTunes needs a ways to systematically compare various types of attribute (e.g., names are ordered alphabetically, dates and durations require models of time and calendar).
Collections of Objects
What makes iTunes really neat is the ease with which: (1) Groups of objects can be organized into collections, and (2) Objects within a group can be ordered according to attribute values. according the
![[iTunes3]](software/itunes-music-organization.gif)
Figure 25. Library and Collections of Music File Objects
The data storage model is really quite simple:
This framework is very general and, in fact, is employed by a host of Apple applications (e.g., iPhoto, Safari Web Browser, Final-Cut Pro for Video Editing).
Most Important Points ...
Now let's consider behavior modeling for two-phase traffic flow at an intersection. The traffic intersection system can be conveniently thought of as the composition of three loosely coupled systems.
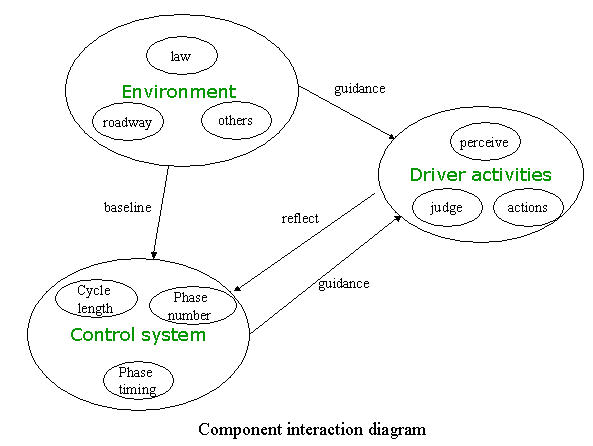
Figure 26. Interaction diagram for the component sub-systems
The sub-systems are:
On the surface of it, this problem looks really simple. But it isn't -- covering every possible scenario is a lot of work.
Statechart diagrams can be used to describe the behavior of a single traffic light and a group of traffic lights at an intersection. Generally, groups of traffic lights will be controlled by a single traffic control box, as shown in Figure 27.
![[Traffic Intersection 1]](software/traffic-intersection-fig1.gif)
Figure 27. Schematic of a Two-Phase Traffic Intersection
Each traffic signal will have lights pointing in two directions -- for example, traffic signal 1 has lights pointing towards the South (S) and East (E).
Our goal for this question is to formulate a statechart diagram for the "traffic control box" operations when each light follows a green-yellow-red cycle and there is two-phase traffic control.
Symmetries and Constraints
Two-phase traffic flow
![[Traffic Intersection 1]](software/traffic-intersection-fig2.gif)
Figure 28. Details of Two-Phase Traffic Flow
implies:
    Signal 1 S = Signal 4 N
    Signal 2 S = Signal 3 N
    Signal 1 E = Signal 2 W
    Signal 4 E = Signal 3 E
The systematic pattern of switching colors could be affected by the time of day, cycle of the lights and time to cycle.
State Table
For "Phase A" (N/S) traffic flow, the light settings are:
    Signal/Direction     North           South     East     West
    ============================================================
    Signal 1 :             ---   Green, Yellow      Red      ---
    Signal 2 :             ---   Green, Yellow      ---      Red
    Signal 3 :   Green, Yellow             ---      ---      Red
    Signal 4 :   Green, Yellow             ---      Red      ---
    ============================================================
For "Phase B" (E/W) traffic flow, the light settings are:
    Signal/Direction  North  South           East           West
    ============================================================
    Signal 1 :          ---    Red  Green, Yellow            ---
    Signal 2 :          ---    Red            ---  Green, Yellow
    Signal 3 :          Red    ---            ---  Green, Yellow
    Signal 4 :          Red    ---  Green, Yellow            ---
    ============================================================
Sequences of States
Taking into account symmetries and phase behavior, the sequence of states in the traffic light settings is as follows:
![[Traffic Intersection 3]](software/traffic-intersection-fig3.gif)
Figure 29. Sequences of States for Traffic Light Behavior
States 1 and 2 correspond to Phase A. Phase B corresponds to States 3 and 4.
StateChart Diagram
Now lets expand the behavior model by accounting for an error state -- all lights flashing red!!! -- and organizing the description of behavior into a hierarchy.
![[Traffic Intersection 4]](software/traffic-intersection-fig4.gif)
Figure 30. Statechart Description of Traffic Light Behavior
Clearly, classes for Phase A and Phase B could be expanded to include the detailed light settings described in the "state tables" and Figure 30.
Most Important Points ...
Motivating observation:
From an engineering perspective, the key challenge ahead is:
We are particularly interested in:
Designers need to model and view artifacts at the highest level of abstraction (and minimal dimensionality) that is unambiguous with respect to the decision making at hand (Kalay, 1989).
Smart Buildings/Smart Spaces
Task/ambient conditioning systems allow thermal conditioning in small, localized zones to be individually controlled by building occupants, creating "micro-climates" with a building. Other functions include: security, identification and personalization, object tagging, and seismic monitoring.
Home Networking
Application (subnet) clusters.
![[Smart Building]](software/smart-building.gif)
Figure 31. Smart Building
Established Approaches to Floorplan Design
A floorplan is
The plan shows placement of walls, doors and windows, fixtures for plumbing and electrical services, detail symbols and dimensions. At the meta-model level, we need support for:
The second level of object specification expands to seven entity types: products (physical objects), processes (timed actions taking place within a project), controls (constraints on objects), resources (use of an object mainly within a process) and actors.
Architectural floor planning processes are concerned with the hierarchical decomposition of spaces within blocks. During the early phases of design, shapes are transformed into "architectural regions" (e.g., rooms, groups of rooms) through the preliminary evaluation of properties (e.g., size, shape, orientation, adjacency) coupled with the assignment of properties to regions.
Requirements for architectural floor planning emanate from multiple sources, including national standards and user requirements. Often, the original user requirements will include a comprehensive list of specific rooms with planned area. Each stage of development deals with a subset of the design requirements. Decisions made at a high level of development will flow down to lower levels of development as constraints.
Multi-Level Specification of Floorplans and Services
We want to create a "design tool" for the interactive system-level development of building architectures augmented by services (e.g., plumbing and lighting systems; internet services; security services). Researchers at Berkeley have created a multi-level abstraction of building designs that can be read by computers and support partial run-time evaluation of design rules.
![[Multi-level Architecture1]](software/multi-level-architecture1.gif)
Figure 32. Framework for Multi-level Specification of Building Function and Form
Floor plans are organized into levels of progressive detail: organizational (i.e., clustering of spaces), symbolic (i.e., room contours; connected wall segments), simple geometry (i.e., thick walls; fleshed out columns; openings for doorways and windows).
Since different tools require different representations in order to perform their tasks, the key contribution of this work is an interchange language. Tools for floorplan layout and extrusion to 3D geometries have been written.
To keep the the complexity of computation for geometric reasoning among an arbitrary number of components in check, the building geometry will need to be organized into a hierarchy of localized coordinate systems (e.g., a room; a space; small groups of rooms and spaces having a related function) that depend on the objects concerned.
Floorplan Design for an Apartment
Development of a small apartment building can be viewed as a goal driven process, subject to constraints:
The step-by-step development procedure might be as follows:
Part 1. Clustering and Organization of Spaces/Rooms
At this point we are interested in identifying objects, relationships among objects, and properties that may need to exist to support evaluation of requirements.
![[Case Study. Floorplan Development 1]](software/case-study1.gif)
Figure 33. From Requirements to Organizational Hierarchies/Clusters
Figure 33 shows the pathway from high-level requirements to a decomposition hierarchy (clusters of objects and their relationships), proximity relationships, and structure connectivity diagram.
Constraints/Proximity Concerns
An example of an orientation constraint is:
High-level topological constraints include factors like,
In order to avoid ambiguity of the allowed operations in an interactive design phase and also to make the implementation efficient and tractable, certain restrictions on allowable geometrical configurations have to be imposed. One such restriction might be a strictly nested hierarchy of polygon contours.
Multiple Concerns in AEC
Architecture, Engineering and Construction (AEC) environments are inherently multi-disciplinary. Participating disciplines include architects, structural and mechanical engineers, and construction personnel.
| Discipline | Concerns |
| Architects |
|
| Structural Engineers |
|
| Mechanical Engineers |
|
| Construction Contractors |
|
Table 11. Summary of concerns for disciplines involved in AEC.
Viewpoints and Representations
A summary of viewpoints and representations for disciplines involved in AEC is as follows:
| Discipline | Viewpoint(s) | Representations |
| Architects |
|
|
| Structural Engineers |
|
|
| Mechanical Engineers |
|
|
| Construction Contractors |
|
|
Table 12. Summary of viewpoints and representations for disciplines involved in AEC.
Representation of Architectural Domain Concepts
Architects are concerned with the spatial layout of a system, and a systems functionality and performance.
![[Multiple Viewpoint Design 6]](software/multiple-viewpoint-design6.gif)
Figure 34. Decomposition, Layout, and Connectivity of Spaces in a Building
Within the "space decomposition" concern, Figure 34 says:
Figure 34 abstracts spaces to the "block/object level" -- at this point we have not said anything about the geometry of spaces, nor how relationships among collections of spaces would be evaluated.
Architectural spaces can be assigned to Groups.
![[Multiple Viewpoint Design 10]](software/multiple-viewpoint-design10.gif)
Figure 35. Organization of Architectural Spaces into Groups
Here, we extend Figure 35 to include two types of groups, Bays and Floors (could also include concepts like Wings, ...etc).
Specific Example: Small Holiday Home
Figure 36 shows an end elevation and simplified plan view of a small holiday home -- think of a kitchen on the first floor, a small living area, and a bedroom in a loft. The living room spans two floor levels and may be viewed from the loft.
![[Multiple Viewpoint Design 11]](software/multiple-viewpoint-design11.gif)
Figure 36. Schematic/data structure for symbolic representation of floorplans.
From an architectural standpoint, we note:
Although not explicitly stated, there are lots of architectural constraints implied by these views, e.g.,
We hope that UML's "association class" diagrams will be a good way of graphically showing the required constraints.
Representation of Structural Engineering Concepts
Structural engineers are concerned with estimation of loads on a structure and the design and proportioning of a structural system that can safely transfer these loads from the structure to the ground.
![[Multiple Viewpoint Design 7]](software/multiple-viewpoint-design7.gif)
Figure 37. High-level class diagram for structural design
(Adapted from Biedermann and Grierson, 1995)
Figure 37 diagram says:
Figure 37 only includes those aspects of the problem that will interact with the architecture domain. Not included are classes for the "loads" that a structure will support, nor the "materials" from which the structural components would be built.
Specific Example: Small Holiday Home
The high-level classes can be decomposed into class hierarchies, e.g.,
![[Multiple Viewpoint Design 7]](software/multiple-viewpoint-design8.gif)
Figure 38. Object Diagram and Concepts for a Simple Building
The structural system in Figure 38 has 10 nodes and 12 components. An example of a group assignment is as follows:
    Group: Bay 1
    =========================================
    Column elements  1, 2, 4, 5, and 7,
    Beam   element   8,
    Rafter elements  9 and 11.

    These elements are connected to:

    Nodes            1, 2, 4, 5, 7, 8 and 10.
    =========================================
At the system-level, structural engineers are primarily concerned with the connectivity of structural elements and the pathway of loads from point of application to the ground. From an external viewpoint, the structure doesn't do much -- it just sits there!!! Engineers view behavior in terms of how the structural system responds to different types and magnitudes of external loads. If a small load leads to a very large deflection, then even if the structure is not even close to material failure, people will not go inside the structure.
Most Important Points ...
The current offerings of ENCE 200 and ENCE 201 focus on software development in Java and Matlab.
In past semesters, we have attempted to cover a bit of each language in each course; we have learned that this strategy sometimes overloads students and leads to confusion.
Hence, to avoid those problems, Matlab is now covered in ENCE 201, and we will stick to Java in ENCE 200.
Software Development with MATLAB (ENCE 201)
The Matlab programming language has been around since the mid 1980s. It stands for Matrix Laboratory.
![[Matlab Development]](software/development-matlab.gif)
Figure 39. Flowchart for Software Development in MATLAB
Strengths of Matlab
Weaknesses of Matlab
Software Development with Java (ENCE 200)
The Java programming langage was invented in the early 1990s (..a lot more on this later in the class). The original goal was to create a language for the development of software that would bring dynamic content to web pages (e.g., embedding a spreadsheet inside a web page).
![[Java Development]](software/development-java.gif)
Figure 40. Flowchart for Software Development in Java
Strengths of Java
Weaknesses of Java
Our goals for this class will be to simply cover the basics.
At the end of the class you should be able to design, write, compile and run a java program that solves a simple engineering problem.
Modified in August 2009 by Mark Austin
Copyright © 2007-2009, Mark Austin, University of Maryland.