Signal
is an interactive Matlab function that performs smoothing for
time-series signals using the fastsmooth algorithm, with keystrokes
that allow you to adjust the smoothing parameters continuously while observing the
effect on your signal dynamically. Other functions include
differentiation, peak sharpening, and least-squares peak
measurement. View the code here or dowload
the ZIP file with sample data for
testing. Note:
you can right-click on any of the m-file links on this site
and select Save Link As... to download them to
your computer for use within Matlab.
To use it, just place
isignal.m in the Matlab path and type
             >> isignal(DataMatrix); or
             >> isignal(x,y);  or
             >> isignal(y);
Use the cursor arrow keys to pan and zoom. The S key (or input argument "SmoothMode") cycles through four
smoothing modes:
If SmoothMode=0,
the signal is not smoothed.
If SmoothMode=1,
rectangular (sliding-average or boxcar)
If SmoothMode=2,
triangular (2 passes of sliding-average)
If SmoothMode=3,
pseudo-Gaussian (3 passes of sliding-average)
IfSmoothMode=4,Savitzky-Golaysmooth
The A and Z keys (or optional input
argument SmoothWidth)
control the SmoothWidth, w. Example shown in the
figure on the right. New in Version 6: To specify a segmented smooth,
press Shift-Q. You can specify the smooth width vector in
two ways: at the prompt you can (a) enter the number of
segments (then you'll be prompted to enter the smooth widths in the
first and last segments, and the computer will calculate integer
values of smooth widths that are evenly divided between the
specified first and last values, or (b) type in the smooth width
vector directly including the square brackets, e.g. [1 3 3
9]. In either case, subsequently adjusting the smooth width with the
A and Z keys will vary all the segments by
the same percentage factor. (To return to an ordinary single segment
smooth, enter 1 as the number of segments). Picture on right.
The X key toggles "ends" between 0 and 1. This
determins how the "ends" of the signal (the first w/2 points and the last w/2 points) are handled when
smoothing:
If ends=0,
the ends are zero.
If ends=1,
the ends are smoothed with progressively smaller smooths the closer
to the end.
Generally, ends=1 is best,
except in some cases using the derivative mode when ends=0 result in better vertical
centering of the signal.
Note: when smoothing peaks, you
can easily measure the effect of smoothing on peak height and
width by turning on peak measure mode (press P) and then press S to cycle through the
smooth modes.
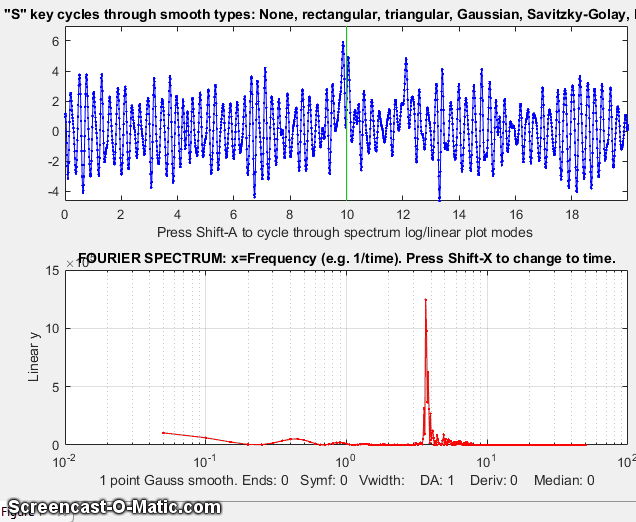
Effect of smoothing on the frequency spectrum. You can
also visualize the effect of smoothing on the frequency spectrum
of the signal by pressing Shift-S, which displays the
frequency spectrum in the
lower window (temporarily replacing the full-signal display).
Use the pan and zoom keys to adjust the region of the signal
to be viewed. PressShift-Ato
cycle through four plot modes (linear, semilog X, semilog Y,
or log-log) and pressShift-Xto
toggle between afrequency on the x axis andtimeon
the x-axis. All signal processing functions remain active in the
frequency spectrum mode
(smooth, derivative, etc) so you can observe the effect of
these functions on the frequency spectrum of the signal, as in
the animated figure on the left.


 parameters continuously while observing the
effect on your signal dynamically. Other functions include
differentiation, peak sharpening, and least-squares peak
measurement. View the code here or dowload
the ZIP file with sample data for
testing. Note:
you can right-click on any of the m-file links on this site
and select Save Link As... to download them to
your computer for use within Matlab.
parameters continuously while observing the
effect on your signal dynamically. Other functions include
differentiation, peak sharpening, and least-squares peak
measurement. View the code here or dowload
the ZIP file with sample data for
testing. Note:
you can right-click on any of the m-file links on this site
and select Save Link As... to download them to
your computer for use within Matlab. vector in
two ways: at the prompt you can (a) enter the number of
segments (then you'll be prompted to enter the smooth widths in the
first and last segments, and the computer will calculate integer
values of smooth widths that are evenly divided between the
specified first and last values, or (b) type in the smooth width
vector directly including the square brackets, e.g. [1 3 3
9]. In either case, subsequently adjusting the smooth width with the
A and Z keys will vary all the segments by
the same percentage factor. (To return to an ordinary single segment
smooth, enter 1 as the number of segments). Picture on right.
vector in
two ways: at the prompt you can (a) enter the number of
segments (then you'll be prompted to enter the smooth widths in the
first and last segments, and the computer will calculate integer
values of smooth widths that are evenly divided between the
specified first and last values, or (b) type in the smooth width
vector directly including the square brackets, e.g. [1 3 3
9]. In either case, subsequently adjusting the smooth width with the
A and Z keys will vary all the segments by
the same percentage factor. (To return to an ordinary single segment
smooth, enter 1 as the number of segments). Picture on right. 