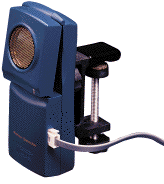
What is a Motion Detector?


Background Information about
Microcomputer-Based Laboratories (MBL)
by Connie Flowers
Microcomputer-Based Laboratories (MBL) are learning experiences in
which students can watch computers draw line graphs at the same time that
something is happening. The computer receives a continuous stream of data
from a measuring device such as a motion detector, temperature probe, or
light sensor. Calculator-Based Laboratories (CBL) use similar measuring
devices to provide data for graphing calculators.
The advantage of MBL is that students can make immediate connections
between the shape of a line graph and the phenomena that the graph
represents. A student can move back and forth in front of a motion
detector, for example, and watch a computer draw a distance versus time
graph for that motion.
Students quickly learn how to interpret specific features of a line
graph. If a student stands still in front of a motion detector, for
example, the computer will draw a straight horizontal line that indicates
no change in position during the duration of the measurement. If the
student moves away from the motion detector at a steady speed, however,
the computer draws an upward slanting line that indicates that the
distance from the detector is increasing. The student can make the
slanting line steeper by moving faster. Students can learn to interpret a
distance versus time graph by pointing to the line graph and stating where
the line represents their moving quickly, standing still, or turning
around.
Once students can interpret specific features of a line graph, they
can make predictions about ways to generate a new graph. Students can look
at a distance versus time graph, for example, and move in ways to make the
computer draw a similar graph. Students also can make connections between
types of graphs. They can work with velocity versus time graphs as well
as distance versus time graphs, for example.
Microcomputer-based laboratories were developed by the Technical
Education Research Center (TERC) with support from the National Science
Foundation. Such real-time laboratory graphing experiences have been
shown to be effective in helping middle school, high school, and college
students learn how to interpret motion graphs (Brasell, 1987; Mokros &
Tinker, 1987; Thornton, 1987). MBL experiences also have been tried
successfully with children as young as first grade (Roberts, 1998).
Resources
Brasell, H. (1987). The effect of real-time laboratory graphing on
learning graphic representations of distance and velocity. Journal
of Research on Science Teaching 24, 385-395.
Mokros, J.R. & Tinker, R.F. (1987). The impact of microcomputer-based
labs on childrens ability to interpret graphs. Journal of Research
on Science Teaching 24, 369-383.
Roberts, D. (1998). Physics and first graders - What a good match! Paper
presented at the annual meeting of the American Educational Research
Association, San Diego.
Thornton, R.K., (1987). Tools for scientific thinking - microcomputer-based
laboratories for physics teaching. Physics Education 22, 230-238.


